Catarina Pereira Nobre
[Nome completo do autor]
[Nome completo do autor]
[Nome completo do autor]
[Nome completo do autor]
[Nome completo do autor]
[Nome completo do autor]
[Nome completo do autor]
Licenciada em Bioquímica Mestre em Energia e Bioenergia
[Habilitações Académicas] [Habilitações Académicas] [Habilitações Académicas] [Habilitações Académicas] [Habilitações Académicas] [Habilitações Académicas] [Habilitações Académicas] Abril, 2019
Thermochemical upgrading of Refuse Derived Fuel
[Título da Tese] Dissertação para obtenção do Grau de Doutor em
Energia e Bioenergia
Dissertação para obtenção do Grau de Mestre em [Engenharia Informática]
Orientadora: Maria Margarida Boavida Pontes Gonçalves, Professora Auxiliar, Faculdade de Ciências e Tecnologia, Universidade NOVA de Lisboa
Co-orien-tadora:
Maria Cândida Lobo Guerra Vilarinho, Professora Auxiliar, Escola de Engenharia, Universidade do Minho
Júri:
Presidente: Doutora Maria Luísa Dias de Carvalho de Sousa Leonardo Arguentes: Doutor Mário Manuel Gonçalves da Costa
Doutor João Luís Monney de Sá Paiva Vogais: Doutora Helena Margarida Nunes Pereira
Doutor José Carlos Fernandes Teixeira Doutor Paulo Sérgio Duque de Brito
i Thermochemical upgrading of Refuse Derived Fuel
Copyright © Catarina Pereira Nobre, Faculdade de Ciências e Tecnologia, Universidade Nova de Lis-boa.
A Faculdade de Ciências e Tecnologia e a Universidade Nova de Lisboa têm o direito, perpétuo e sem limites geográficos, de arquivar e publicar esta dissertação através de exemplares impressos reproduzi-dos em papel ou de forma digital, ou por qualquer outro meio conhecido ou que venha a ser inventado, e de a divulgar através de repositórios científicos e de admitir a sua cópia e distribuição com objetivos educacionais ou de investigação, não comerciais, desde que seja dado crédito ao autor e editor.
iii
v
Acknowledgements
The work presented in this thesis would not have been possible without my close association with many people. I take this opportunity to extend my sincere gratitude and appreciation to everyone who made this PhD thesis possible.
First and foremost, I would like to acknowledge my supervisor, Professor Margarida Gonçalves, whose passion for this work is a motivation for everyone around her. Thank you for sharing your knowledge, for your dedication and availability. Thank you for once again traveling this road with me. To my co-supervisor, Professor Cândida Vilarinho, thank you for your professionalism and availa-bility, for all your input into this work and for always having a kind word.
To Professor Benilde Mendes, coordinator of this PhD program and President of the Department of Science and Technology of Biomass (DCTB), thank you for your constant presence throughout these years, for all your help and for the interest you show with all your students.
I gratefully acknowledge all the professors and staff from DCTB. Professor Ana Luísa Fernando, Pro-fessor Paula Duarte, D. Lurdes, D. Rita and D. Rosa, thank you for all the support over the years and for making this department the best place to work in!
To everyone at CVR (Centro para a Valorização de Resíduos), at the Mechanical Engineering De-partment of Minho University and at the School of Technology and Management from IPPortalegre, thank you for your collaboration and for always being so welcoming.
Thank you to the BRISK project, for the financial support that allowed for the work conducted at the ECN facilities. And thank you to the people at ECN for all the technical support.
Thank you to CITRI, S.A, Project I&DT nº 24878 for financial support and for supplying the raw materials used throughout this work.
To all of my “brothers and sisters in arms”: Ricardo Correia, Octávio Alves, Andrei Longo, Ana Paula Oliveira, Luís Durão, Liliana Serrano, Catarina Viegas, Carolina Rodrigues and João Pires. And, of course, to my “babies”: Dieimes Resende, Margarida Santos, Mariana Paiva, Noelia Romero, Leonor Pina and Vasco Soares Jorge. Thank you for all our healthy discussions, for your help and advice, all the laughs, all the venting, all the coffee breaks, lunches, dinners and overall good times we had together! You guys really made this a lot more fun!
To the best friends anyone could have: António, Catarina, Dalila, Diogo, Estela, Joana C., Joana S., and Rui. Thank you for always being by my side, through thick and thin.
To my grandmother, my aunts Bia, Liva and Zezinha, my cousins Zé, Luís, João and Vânia, my godmother, Maria Ana and Luís Alberto, Isabel and Pedro. Thank you for encouraging and helping me every step of the way.
Tiago, I couldn’t have done this without you. You also lived every single minute of this and I am truly grateful for your support and your patience. I love you.
To my dad, Tozézico “Master of the Seas”, thank you for being the “best dad in the world” since 1986!
And finally, my most heartfelt acknowledgement goes to my mother. I wish she could share this moment with me. I miss her every single day. There you go Mãe, we did it!
vii
Abstract
The main objective of this thesis was to study Refuse Derived Fuel (RDF) upgrading by torrefaction and carbonization and to evaluate composition, fuel properties and adsorbent properties of the produced RDF chars
RDF is a solid fuel produced from non-hazardous wastes, such as municipal solid wastes, construc-tion and demoliconstruc-tion wastes or regular industrial wastes, and it is destined for energy producconstruc-tion through incineration or co-incineration. Despite the processing, RDF still exhibits unattractive fuel properties, namely high heterogeneity, high moisture and ash contents and low grindability.
In a first approach, torrefaction (200-300 ºC) and carbonization (350 and 400 ºC) were applied to an industrial RDF sample, at a laboratory scale, using residence times between 15 and 60 minutes. The produced chars were characterized for their proximate, elemental and mineral compositions, heating value and leaching behavior. The increase in temperature and residence time showed a positive effect on the decrease in volatile matter and increase in fixed carbon content, as well as carbon content and high heating value (HHV). Leaching tests of the produced chars showed that heavy metals are better retained by the char matrix than within the raw RDF. For temperatures in the torrefaction range, process energy yields were higher than 96.3 % and process energy efficiencies were higher than 85 %. Never-theless, the HHV of these RDF chars were lower than 19.4 MJ.kg-1. In the carbonization range, RDF
chars presented HHV in the range of 20.1 to 26.2 MJ.kg-1, with energy yields from 84.5 to 91.7 % and
process energy efficiencies from 70.8 to 79.2 %.
Torrefaction and carbonization tests were also carried out on a pre-pilot scale at 300 and 400 °C, and all products, namely char, condensates and permanent gases were collected and characterized. Chars showed high carbon contents (61.6 % and 80.2 %, 300 ° C and 400 ° C, respectively) and high calorific values (19.9 MJ.kg-1 and 23.5 MJ.kg-1, at 300 °C and 400 °C, respectively). Nevertheless, the ash content
of the produced chars increased when compared to the raw RDF, reaching a maximum value of 28.8 wt.%. The thermal treatment caused the organic chlorine present in the RDF to be converted into inor-ganic species which could be removed by washing with water at room temperature. Gaseous emissions were mostly composed of carbon dioxide and carbon monoxide, with lower amounts of methane and hydrogen. The process condensates showed very high COD values and consisted mainly of oxygenated organic compounds, such as acids, furans and phenols.
Although the chars produced by torrefaction and carbonization have presented improved fuel prop-erties, hydrothermal carbonization was also tested in order to validate its potential in the production of hydrochars with reduced ash and chlorine contents. The effects of process temperature (250-300 °C), residence time (30 min and 120 min) and solid-to-water ratio (1:15 and 1:5) on the main characteristics of the hydrochars and process waters were evaluated. The hydrochars had a low ash content (3.3 % at 300 °C and 120 min) and good heating values (28.1 MJ.kg-1 at 275 °C and 120 min). The HTC process
also revealed a maximum dechlorination efficiency of 55 % at 300 °C for 120 min. The energy efficiency calculations showed that the conditions of 275 °C, 30 minutes with a solid-to-water ratio of 1:5 had lower energy requirements (5.6 MJ), presenting a positive net energy (8.5 MJ) and a higher process efficiency (52.6 %). The process waters presented acid pH, high COD (maximum 27.2 gO2.L-1) and
significant concentrations of total phenolic compounds and total reducing sugars. Several organic com-pounds have been identified in process waters, mainly organic acids, alcohols, furan derivatives, phe-nolic compounds and aromatic hydrocarbons. Remediation of the HTC process water was attempted through chemical precipitation and adsorption using activated carbon and RDF derived char. Although
viii removal efficiencies for COD and phenolic compounds were higher for activated carbon, RDF char may be a more sustainable adsorbent to be used in the treatment of these liquid effluents, due to its availability and low cost when compared to activated carbon.
The evaluation of the energetic valorization of RDF char by gasification was carried out at a pre-pilot scale using pellets of pine waste fortified with 5 % and 10 % of RDF char. The gasification tests were carried out at the temperatures of 800 and 850 °C and equivalence ratios of 0.25 and 0.30. The product gas yield ranged from 1.5 to 2.5 m3.kg-1 and was higher for an equivalence ratio of 0.25. The
carbon conversion efficiency and the cold gas efficiency ranged from 60.4 to 96.1 % and 42.2 to 73.5 %, respectively. The pellets with RDF char had a better gasification performance at 850 ºC and ER 0.25. The incorporation of RDF char increased the concentrations of heavy PAHs in the gasification tars.
Finally, the material valorization of the RDF char was tested through its use as a low-cost adsorbent for the removal of the dye methylene blue or the heavy metal chromium (VI) from aqueous effluents. The experiments were carried out in batch and column modes and process parameters were varied, namely, contact time, solution pH, adsorbent mass, contaminant concentration, test temperature or col-umn height. RDF char showed potential to remediate methylene blue, and it has been found that the adsorption may follow a chemical adsorption mechanism. Activation of the RDF char by extraction with aqueous KOH improved its removal efficiency towards both analytes.
Keywords: RDF; Torrefaction; Carbonization; Hydrothermal carbonization; RDF char; Hydrochar; Gasification; Adsorption
ix
Resumo
O principal objetivo desta tese consistiu no estudo do melhoramento das características físico-quí-micas de Combustíveis Derivados de Resíduos (CDR) através dos processos termoquímicos de torrefa-ção e carbonizatorrefa-ção, de forma a avaliar as propriedades combustíveis e adsorventes dos carvões de CDR produzidos.
O CDR é um combustível sólido produzido a partir de resíduos não perigosos, tais como resíduos sólidos urbanos, resíduos de construção e demolição ou resíduos industriais, e é destinado à produção de energia através de incineração ou coincineração. Apesar do seu processamento, o CDR ainda exibe propriedades combustíveis pouco atraentes, tais como, elevada heterogeneidade, elevados teores de hu-midade e cinzas e baixa moabilidade.
Numa primeira abordagem, os processos de torrefação (200-300 °C) e carbonização (350 e 400 °C) foram aplicados a uma amostra CDR industrial, em escala laboratorial, utilizando tempos de residência entre 15 e 60 minutos. Os carvões produzidos foram caracterizados relativamente às suas composições imediata, elementar e mineral, poder calorífico e comportamento de lixiviação. O aumento da tempe-ratura e do tempo de residência mostraram um efeito positivo na diminuição da matéria volátil e aumento do teor de carbono fixo, bem como no teor de carbono e no poder calorífico superior (PCS). Os testes de lixiviação dos carvões de CDR demonstraram que os metais pesados são retidos de forma mais eficaz pela matriz de carvão em comparação com o CDR original. Para temperaturas na gama da torrefação, os rendimentos energéticos do processo foram superiores a 96,3 % e as eficiências energéticas do pro-cesso foram superiores a 85 %. No entanto, o PCS dos carvões de CDR obtidos por torrefação foram inferiores a 19,4 MJ.kg-1. Na gama da carbonização, os carvões de CDR apresentaram PCS de 20,1 a
26,2 MJ.kg-1, com rendimentos energéticos de 84,5 a 91,7 % e eficiências energéticas de 70,8 a 79,2 %.
Foram também realizados testes de torrefação e carbonização em escala pré-piloto a 300 e 400 ° C, e todos os produtos, ou seja, carvão, condensados e gases permanentes foram recolhidos e caracteriza-dos. Os carvões de CDR apresentaram elevados teores de carbono (61,6 % e 80,2 %, a 300 ° C e 400 ° C, respetivamente) e elevado PCS (19,9 MJ.kg-1 e 23,5 MJ.kg-1, a 300 ° C e 400 ° C, respetivamente).
No entanto, o teor de cinzas dos carvões produzidos aumentou significativamente quando comparado com o CDR original, atingindo um valor máximo de 28,8 %. O tratamento térmico fez com que o cloro orgânico presente no CDR fosse convertido em espécies inorgânicas que foram removidas por lavagem com água à temperatura ambiente. As emissões gasosas foram compostas maioritariamente por dióxido de carbono e monóxido de carbono, com menores quantidades de metano e hidrogénio. Os condensados produzidos demonstraram valores muito elevados de carência química de oxigénio (CQO) e consistiram principalmente de compostos orgânicos oxigenados, como ácidos, furanos e fenóis.
Embora os carvões produzidos por torrefação e carbonização tenham apresentado propriedades com-bustíveis melhoradas, a carbonização hidrotérmica (HTC) foi também testada para validar o seu poten-cial na produção de hidrocarvões com teores reduzidos de cinzas e cloro. Os efeitos da temperatura do processo (250-300 ° C), tempo de residência (30 min e 120 min) e relação sólido-água (1:15 e 1: 5) nas principais características dos hidrocarvões e águas de processo foram avaliados. Os hidrocarvões apre-sentaram teores de cinza reduzidos (3,3% a 300 ° C e 120 min) e PCS elevados (28,1 MJ.kg-1 a 275 ° C
e 120 min). O processo HTC também revelou uma eficiência máxima de descloração de 55 % a 300 ° C e 120 min. Os cálculos de eficiência energética demonstraram que as condições de 275 ° C, 30 minutos com relação sólido-água de 1:5 apresentaram menores necessidades energéticas (5,6 MJ), apresentando uma energia líquida positiva (8,5 MJ) e uma maior eficiência do processo (52,6 %). As águas de pro-cesso apresentaram pH ácido, elevados valores de CQO (máximo 27,2 gO2.L-1) e concentrações
x significativas de compostos fenólicos totais e açúcares redutores totais. Diversos compostos orgânicos foram identificados nas águas de processo, principalmente ácidos orgânicos, álcoois, derivados de fu-rano, compostos fenólicos e hidrocarbonetos aromáticos. A remediação da água do processo HTC foi realizada através de precipitação química e adsorção usando carvão ativado comercial e carvões deriva-dos de CDR. Embora as eficiências de remoção de CQO e compostos fenólicos tenham sido mais ele-vadas para o carvão ativado, os carvões de CDR podem ser considerados adsorventes mais sustentáveis para o tratamento destes efluentes, devido à sua disponibilidade e baixo custo quando comparados ao carvão ativado.
A avaliação da valorização energética do carvão de CDR através de gaseificação, foi realizada em escala pré-piloto utilizando pellets de resíduos de pinho com 5 % e 10 % de incorporação de carvão de CDR. Os testes de gaseificação foram realizados nas temperaturas de 800 e 850 ° C e razões de equiva-lência (ER) de 0,25 e 0,30. O rendimento de gás produto variou entre 1,5 e 2,5 m3.kg-1 e foi maior para
uma razão de equivalência de 0,25. A eficiência de conversão de carbono e a eficiência de gás frio variaram entre 60,4 e 96,1% e 42,2 a 73,5%, respetivamente. Os pellets com incorporação de carvão de CDR tiveram um melhor desempenho de gaseificação a 850 °C e ER 0.25. A incorporação de carvão de CDR aumentou as concentrações de hidrocarbonetos aromáticos policíclicos (PAHs) pesados nos tars de gaseificação.
Por fim, a valorização material do carvão de CDR foi testada através da sua utilização como adsor-vente de baixo custo, para a remoção do corante azul de metileno ou do metal pesado crómio (VI) de efluentes aquosos. As experiências foram realizadas em descontínuo (batch) e em contínuo (coluna) e parâmetros do processo foram variados, nomeadamente, tempo de contato, pH da solução, massa de adsorvente, concentração de contaminante, temperatura de teste ou altura da coluna. O carvão de CDR demonstrou potencial para remediar o azul de metileno e verificou-se que a adsorção pode seguir um mecanismo de adsorção química. A ativação do carvão de CDR por extração com KOH aquoso melho-rou a sua eficiência de remoção para ambos os analitos.
Palavras-chave: CDR; Torrefação; Carbonização; Carbonização hidrotérmica; carvão de CDR; Hidro-carvão; Gaseificação; Adsorção
xi
Table of contents
Acknowledgements v Abstract vii Resumo ix Table of contents xi List of figures xvList of tables xix
List of abbreviations, symbols and units xxi
Chapter 1: General Introduction 1
1.1. Relevance of the study 1
1.2. Research goals 3
1.3. Thesis outline 3
Chapter 2: State-of-the-art 7
2.1. Introduction 7
2.2. RDF production in Portugal 13
2.3. Thermochemical conversion technologies applied to RDF 14
2.3.1. Combustion 14
2.3.2. Gasification 16
2.3.3. Pyrolysis 19
2.3.4. Torrefaction and carbonization 21
2.3.5. Hydrothermal carbonization 25
2.4 General considerations 30
Chapter 3: Upgrading of RDF through torrefaction and carbonization: evaluation of RDF char fuel
properties 31
Abstract 31
3.1. Introduction 31
3.2. Materials and methods 32
3.2.1. Raw material 32
3.2.2. Torrefaction and carbonization experiments 34
3.2.3. RDF and RDF char characterization 34
3.2.4. Process performance 35
3.3. Results and discussion 36
3.3.1. RDF and RDF char characterization 36
3.3.2. Process performance 44
3.4. Conclusions 47
Chapter 4: Torrefaction and carbonization of RDF: Char characterization and evaluation of gaseous
and liquid emissions 49
Abstract 49
4.1. Introduction 49
4.2. Materials and methods 50
4.2.1. Raw material 50
4.2.2. Torrefaction and carbonization tests 50
4.2.3. RDF and RDF char characterization 52
4.2.4. Leaching tests 52
4.2.5. Characterization of gaseous products 52
xii
4.3. Results and Discussion 53
4.3.1. Characterization of raw material and produced chars 53
4.3.2. Characterization of gaseous products 59
4.3.3. Characterization of liquid products 60
4.4. Conclusions 63
Chapter 5: Hydrothermal carbonization of RDF 65
Abstract 65
5.1. Introduction 65
5.2. Materials and methods 67
5.2.1. Raw material 67
5.2.2. HTC experiments 67
5.2.3. RDF and hydrochar characterization 68
5.2.4. Process water characterization 69
5.2.5. Process water remediation 70
5.2.6. Process performance 71
5.3. Results and discussion 72
5.3.1. Proximate and elemental analysis of RDF and hydrochars 72
5.3.2. Thermogravimetric analysis 78
5.3.3. Structural properties of RDF and hydrochars 80
5.3.4. Process performance 83
5.3.5. Characterization of HTC process water 86
5.3.6. Remediation of HTC process water 89
5.4. Conclusions 93
Chapter 6: Gasification of pine waste pellets with incorporation of RDF char 95
Abstract 95
6.1. Introduction 95
6.2. Materials and methods 96
6.2.1. Raw materials 96
6.2.2. Pellet characterization 96
6.2.3. Gasification tests 97
6.2.4. Gasification performance 98
6.2.5. Tar analysis 99
6.3. Results and discussion 99
6.3.1. Characterization of raw materials 99
6.3.2. Gasification performance 101
6.3.3. Producer gas composition 102
6.3.4. Tar analysis 104
6.4. Conclusions 108
Chapter 7: Material valorization of RDF char – Use as low-cost adsorbent 109
Abstract 109
7.1. Introduction 109
7.2. Materials and methods 111
7.2.1. Chemicals 111
7.2.2. Raw material 111
7.2.3. RDF char production and treatment 112
7.2.4. RDF char characterization 112
xiii
7.2.6. Fixed-column adsorption experiments 115
7.3. Results and discussion 117
7.3.1. Adsorbent selection and characterization 117
7.3.2. Batch equilibrium experiments 121
7.3.3. Fixed-column experiments 133
7.4. Conclusions 136
Chapter 8: Conclusions and future work 139
8.1. Conclusions 139 8.2. Future work 142 References 143 Appendix 159 A.1 – Chapter 3 159 A.2 – Chapter 4 162 A.3 – Chapter 5 164 A.4 – Chapter 6 168 A.5 – Chapter 7 169
xv
List of figures
Figure 1.1: Final destinations of MSW in 2017. ... 2
Figure 2.1: Example of process flow schematics for the production lines of MBT and MT plants. ... 11
Figure 2.2: RDF typologies ... 12
Figure 2.3: Impact of torrefaction in homogeneity and volume reduction. ... 21
Figure 2.4: Mass and energy balances for the torrefaction of willow wood at different conditions ... 22
Figure 2.5: Water phase diagram ... 25
Figure 2.6: Main reaction pathways in biomass hydrothermal carbonization. ... 26
Figure 3.1: Flow chart for the production line of the RDF used in this work. ... 33
Figure 3.2: RDF sample used in this work, as received. ... 33
Figure 3.3: RDF chars produced by torrefaction and carbonization at 200, 250, 300, 350 and 400 ºC and residence times of 15, 30 and 60 min. ... 37
Figure 3.4: Proximate composition of the raw RDF and the RDF chars produced at 200, 250, 300, 350 and 400 ºC and residence times of 15, 30 and 60 min... 38
Figure 3.5: van Krevelen diagram for raw RDF and the RDF chars obtained in this work and comparison with different fossil fuels and biomass wastes... 41
Figure 3.6: Relations between the process energy efficiency (PEE) and: (a) heating value of RDF chars (HHV) and (b) process energy yield (PEE). ... 46
Figure 4.1: Morphological composition of the RDF sample, obtained through manual sorting. ... 50
Figure 4.2: (a) Photographic representation of the rotary pyrolysis furnace; (b) Schematic diagram of the experimental setup used in the torrefaction and carbonization tests. ... 51
Figure 4.3: (a) Raw RDF, as received; (b) RDF char produced at 300 °C for 30 min and (torrefaction) (c) RDF char produced at 400 ºC for 30 min (carbonization)... 53
Figure 4.4: Solid, liquid and gaseous products distribution (wt.%) obtained with RDF torrefaction (300 ºC) and carbonization (400 ºC). ... 54
Figure 4.5: van Krevelen diagram for the RDF and RDF chars produced at 300 ºC and 400 ºC. ... 57
Figure 4.6: Chlorine removal efficiency (%) and high heating value (HHV) improvement (%) for the RDF chars produced at 300 ºC and 400 ºC, after water leaching and Soxhlet extraction. ... 58
Figure 4.7: Composition of the gas products for RDF torrefaction (300 ºC) and carbonization (400 ºC). ... 59
Figure 4.8: Condensates originating from RDF torrefaction (300 ºC) and carbonization (400 ºC) ... 60
Figure 4.9: Major chemical species present in the liquid phase of RDF torrefaction (300 ºC) and carbonization (400 ºC) at different collection points, expressed in absolute peak area. ... 63
Figure 5.1: Stainless steel autoclave reactor used in the HTC experiments. ... 67
Figure 5.2: Raw RDF and produced hydrochars in different conditions. ... 72
Figure 5.3: van Krevelen diagram comparing the produced hydrochars, RDF, biomass wastes and fossil fuels (van der Stelt et al., 2011). ... 75
Figure 5.4: TGA and DTG profiles of: (a) RDF; (b) H-250-30/15; (c) H-300-30/15 and (d) H-300-120/15. ... 79
xvi Figure 5.6: Representation of the energy recovered in the hydrochars (Qoutput, MJ) as a function of the HTC
process energy efficiency (PEE, %). ... 85
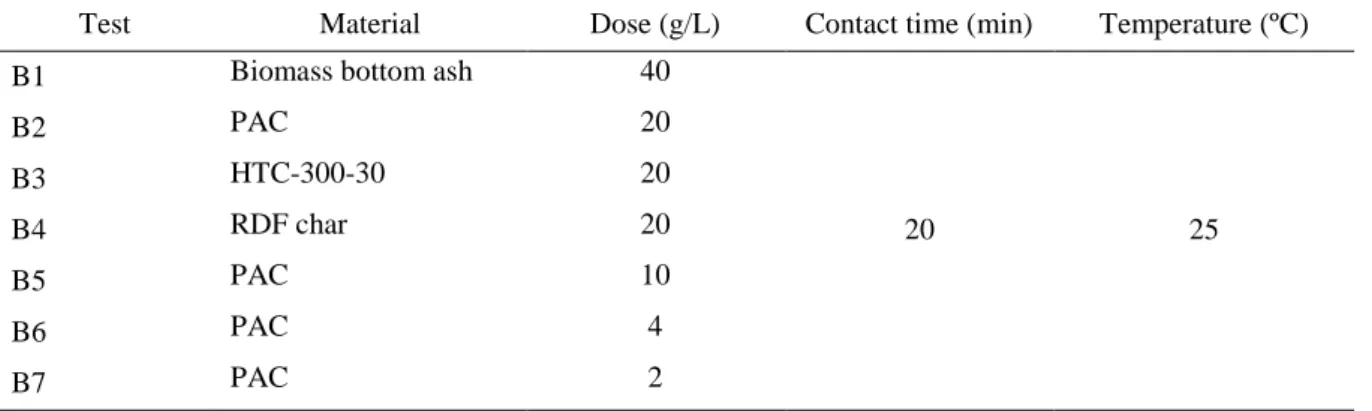
Figure 5.7: Removal efficiencies of total phenolic compounds and COD after batch adsorption tests with different adsorbents B1 (biomass ash), B2 (PAC), B3 (HTC-300-30), B4 (RDF char). ... 90
Figure 5.8: Removal efficiencies of total phenolic compounds and COD after batch adsorption tests with PAC at different doses, B2 (20 g.L-1), B5 (10 g.L-1), B6 (4 g.L-1), B7 (2 g.L-1). ... 92
Figure 5.9: Column adsorption tests with PAC at different doses (a) Total phenolic compounds and (b) COD. . 93
Figure 6.1: Materials used in the preparation of the tested pellets ... 97
Figure 6.2: (a) Bubbling-fluidised-bed gasifier (WOB) schematics and (b) photographic representation. ... 98
Figure 6.3: Effect of temperature and equivalence ratio on light hydrocarbons. ... 103
Figure 6.4: Effect of temperature and equivalence ratio on the yield of producer gas main components. ... 104
Figure 6.5: GC-MS profile of tar extract from Sample 1 (850 ºC, ER 0.25)... 105
Figure 6.6: Relative abundance of tar components for the gasification tests performed at 800 ºC and ER 0.25 (a) or ER 0.30 (b). ... 106
Figure 6.7: Relative abundance of tar components for the gasification tests performed at 850 ºC and ER 0.25 (a) or ER 0.30 (b). ... 107
Figure 7.1: Chemical structure of methylene blue (MB). ... 111
Figure 7.2: RDF sample used in this chapter, before particle size reduction. ... 111
Figure 7.3: Results for the quick adsorption test for adsorbent selection. ... 117
Figure 7.4: N2 adsorption–desorption isotherms of: (a) RDF char and (b) RDFchar-KOH. ... 119
Figure 7.5: FT-IR spectra for the adsorbents used in this work (RDFchar, and RDFchar-KOH). ... 120
Figure 7.6: Influence of initial pH on MB adsorption onto RDF char and RDF char-KOH. ... 121
Figure 7.7: Influence of adsorbent dose on MB adsorption onto RDFchar and RDFchar-KOH. ... 122
Figure 7.8: Influence of contact time on MB adsorption onto RDF char and RDF char-KOH.. ... 123
Figure 7.9: Adsorption kinetics of MB onto RDF char and RDF char-KOH ... 124
Figure 7.10: Influence of initial MB concentration and temperature on MB adsorption removal efficiency onto: (a) RDF char and (b) RDF char-KOH. ... 126
Figure 7.11: Influence of initial MB concentration and temperature on amount of MB adsorbed onto: (a) RDF char and (b) RDF char-KOH. ... 127
Figure 7.12: Langmuir isotherms of MB dye adsorption onto (a) RDFchar and (b) RDFchar-KOH. ... 128
Figure 7.13: Freundlich isotherms of MB dye adsorption onto (a) RDF char and (b) RDF char-KOH. ... 129
Figure 7.14: Temkin isotherms of MB dye adsorption onto (a) RDF char and (b) RDF char-KOH... 131
Figure 7.15: Effect of bed height on the breakthrough curves of MB dye, ... 134
Figure 7.16: Breakthrough curves of Cr (VI) 10 mg/L, pH=2 and a flow rate of 2.5 mL.min-1. ... 134
Figure A.1: Linear regressions used for the calculations of the heat of torrefaction/carbonization (Q4) in Chapter 3 ... 159
Figure A.2: Correlations between the concentrations of alkali and alkali-earth metals and process temperature, in the RDF chars’ leachates from Chapter 3. ... 160
Figure A.3: Correlations between the concentrations of alkali and alkali-earth metals and process residence time, in the RDF chars’ leachates from Chapter 3. ... 160
xvii Figure A.4: Organic acids, peaks labeled with retention times ... 162 Figure A.5: Representative normalized chromatogram from the organic extract of the condensates from the 2nd
collection point of the carbonization test conducted at 400 ºC and 30 minutes from Chapter 4. ... 162 Figure A.6: Calibration curve used for the determination of total phenolic compounds, using the Folin-Ciocalteu
method, with 2,4,6-trimethylphenol as a standard (Chapter 5). ... 164 Figure A.7: Calibration curve used for the determination of total reducing sugars, using the DNS method, with
glucose as a standard (Chapter 5). ... 164 Figure A.8: Calibration curve used for the determination of total phosphorous, using the ascorbic acid method,
with phosphate as a standard (Chapter 5). ... 165 Figure A.9: Correlations between element removal efficiency (ERE, %) and temperature for the hydrochars
produced in Chapter 5 (Ca, K, Fe, Zn). ... 165 Figure A.10: Correlations between element removal efficiency (ERE, %) and temperature for the hydrochars
produced in Chapter 5 (Ti, Pb, Cu, Cr). ... 166 Figure A.11: Correlations between element removal efficiency (ERE, %) and temperature for the hydrochars
produced in Chapter 5 (Ti, Pb, Cu, Cr). ... 166 Figure A.12: Representative normalized chromatogram from the organic extract of HTC process water obtained
from the process at 300 ºC for 120 minutes, from Chapter 5, labeled with retentions times (RT). ... 167 Figure A.13: PAHs mix standard solution used for identification in the tar samples from Chapter 6. ... 168 Figure A.14: Example of calibration curve for methylene blue (MB) used in Chapter 7. ... 169 Figure A.15: Example of calibration curve for chromium (VI), obtained through the 1,4-diphenylcarbizide
xix
List of tables
Table 2.1: Classification system used for solid recovered fuels ... 8 Table 2.2: Proximate analysis results for different samples of RDF from different sources. ... 8 Table 2.3: Typical metal concentrations in the ash of RDF from different sources. ... 9 Table 2.4: RDF production or production of raw material for RDF (ton) from MSW, in Portugal between 2011
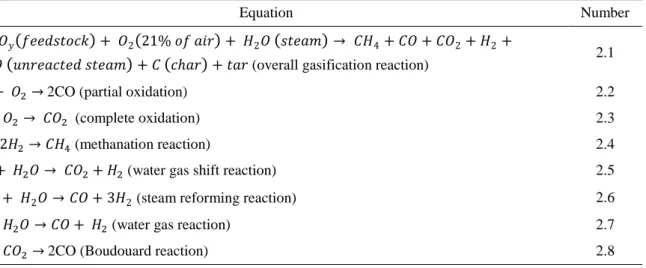
and 2017 ... 13 Table 2.5: Main reactions occurring during gasification... 17 Table 2.6: Examples of gasification technologies for energy production from RDF/SRF ... 17 Table 3.1: Identification of different RDF components through manual sorting. ... 34 Table 3.2: Ultimate composition and heating values of the raw RDF and the RDF chars obtained at the different
temperatures and residence times. ... 40 Table 3.3: Ash mineral composition, chlorine content and slagging and fouling indexes for the raw RDF and
produced RDF chars. ... 42 Table 3.4: Concentrations of chlorine and other mineral components removed by the leaching procedures of raw
RDF and the RDF chars produced at different temperatures and residence times. ... 43 Table 3.5: Mass yield, energy yield, energy requirements and process energy efficiency for the torrefaction and
carbonization of RDF. ... 45 Table 4.1: Chemical properties of raw RDF and produced RDF chars, expressed as average values. ... 55 Table 4.2: Characterization of RDF torrefaction and carbonization liquid products. ... 60 Table 4.3: GC-MS relative peak areas of the main organic compounds found in the chloroform extracts from the
condensates obtained in RDF torrefaction (300 ºC) and carbonization (400 ºC) experiments. ... 62 Table 5.1: Experimental layout for HTC experiments. ... 68 Table 5.2: Experimental layout of the batch precipitation/adsorption tests for HTC water remediation. ... 70 Table 5.3: Chemical characteristics and fuel properties of RDF and RDF hydrochars. ... 73 Table 5.4: Element removal efficiency of the HTC process regarding the different mineral components,
evaluated as ERE (%) = (CRDF-Chydrochar)/CRDF).100, where CRDF is the element concentration in the RDF
and Chydrochar represents element concentration in the hydrochars. ... 76
Table 5.5: Localized elemental composition (Z1, Z2 and Z3) in the raw RDF and in three hydrochar samples, obtained through EDS. ... 81 Table 5.6: FT-IR peak frequencies (cm-1) and corresponding assignments for RDF and hydrochars samples. .... 82
Table 5.7: Energy balance for HTC of RDF. ... 84 Table 5.8: Chemical characterization of the process waters obtained from the different HTC tests. ... 86 Table 5.9: Qualitative analysis of the process waters by GC-MS. ... 88 Table 5.10: Biomass bottom ash mineral composition. ... 90 Table 6.1: Experimental layout for the gasification of each sample. ... 98 Table 6.2: Main chemical properties of the tested samples ... 100 Table 6.3: Effect of temperature and equivalence ratio on gasification performance LHV of the producer gas,
producer gas yield (PGY), carbon conversion efficiency (CCE) and cold gas efficiency (CGE). ... 101 Table 6.4: Effect of temperature and equivalence ratio on the composition of the producer gas. ... 102
xx Table 7.1: Proximate analysis, elemental analysis, high heating value (HHV) and pHpzc results for the RDFchar
and RDFchar-KOH. ... 118 Table 7.2: Kinetic parameters for the adsorption of MB onto RDF char and RDF char-KOH. ... 124 Table 7.4: Model parameters estimated for the Langmuir adsorption isotherm of MB onto RDFchar and
RDFchar-KOH ... 128 Table 7.5: Model parameters estimated for the Freundlich adsorption isotherm of MB onto RDF char and
RDFchar-KOH ... 130 Table 7.6: Model parameters estimated for the Temkin adsorption isotherm of MB onto RDF char and RDF
char-KOH ... 131 Table 7.7: Comparison of the maximum monolayer adsorption of MB onto various adsorbents. ... 132 Table 7.8: Thermodynamic parameters for the adsorption of MB onto RDF char and RDF char-KOH. ... 133 Table 7.9: Adsorption breakthrough data for MB adsorptions tests in fixed-bed column varying adsorbent mass,
and for Cr (VI) adsorption test. ... 135 Table 7.10: Parameters of Thomas model for MB column adsorption under different bed heights, and for CR
(VI) column adsorption. ... 136 Table A.1: Estimated values for the thermal loses (Q5), expressed in %, from the process performance in Chapter
3. ... 159 Table A.2: Pearson correlation coefficients determined through Figures A.2 and A.3. ... 161 Table A.3: Identified peaks from Figure A.5. ... 163 Table A.4: Correlation coefficients determined from Figures A.9, A.10 and A.11. ... 166 Table A.5: Identified peaks from Figure A.12. ... 167 Table A.6: Identified PAHs from Figure A.13. ... 168
xxi
List of abbreviations, symbols and units
Abbreviations
ar As received basis
ASTM American Society for Testing and Materials
BET Brunauer-Emmet-Teller
BFBG Bubbling Fluidized Bed Gasifier
BOD5 Biochemical Oxygen Demand (5 days)
BS EN British Standard European Norm
BSA N,O-Bis(trimethylsilyl)acetamide
CCE Carbon Conversion Efficiency
CDW Construction and Demolition Wastes
CEN/TS European Committee for Standardization Technical Specification
CGE Cold Gas Efficiency
CHP Combined Heat and Power
CITRI Centro Integrado para o Tratamento de Resíduos Industriais
COD Chemical Oxygen Demand
cRDF Carbonized Refuse Derived Fuel
daf dry ash free basis
db dry basis
EBCT Empty Bed Contact Time
EC European Commission
ECN Energy Center of the Netherlands
ER Equivalence Ratio
EU European Union
EWL European Wastes List
FGR Flue Gas Recirculation
FID Flame Ionization Detector
FT-IR Fourier Transform – Infrared Spectroscopy
GC-MS Gas Chromatography – Mass Spectrometry
GHG Greenhouse Gas Emissions
HHV High Heating Value
HMF Hidroxymethylfurfural
HTC Hydrothermal Carbonization
IUPAC International Union of Pure and Applied Chemistry
LHV Low Heating Value
MB Methylene Blue
MBT Mechanical and Biological Treatment
MRF Materials Recycling Facility
MSW Municipal Solid Wastes
MT Mechanical Treatment
MTZ Mass Transfer Zone
PAHs Polycyclic Aromatic Hydrocarbons
PCDD/Fs Polychlorinated Dibenzodioxins/Dibenzofurans
PDF Plastic Derived Fuel
PE Polyethylene
PEE Process Energy Efficiency
PGY Producer Gas Yield
PERSU Plano Estratégico para os Resíduos Urbanos
PET Polyethylene terephthalate
PP Polypropylene
PPF Paper and Plastic Fuel
PS Polystyrene
PVC Polyvinyl chloride
PZC Point of Zero Charge
RDF Refuse Derived Fuel
xxii
RPF Refuse Plastic/Paper Fuel
SEM-EDS Scanning Electron Microscopy - Energy-Dispersive X-ray Spectroscopy
SRF Solid Recovered Fuel
TGA/DSC Thermogravimetric Analysis - Differential Scanning Calorimetry
TOC Total Organic Carbon
VFBC Vortexing Fluidized Bed Combustor
WtE Waste-to-Energy
XRF X-Ray Fluorescence
Symbols
A Area above the breakthrough curve
B/A Base-to-Acid ratio
BT Heat of adsorption constant
Ce Dye concentration at equilibrium
𝐶𝑝𝑥 Specific heat of a given substance (x)
Fu Fouling index
h0 Initial adsorption rate
Hw,HT Water enthalpy at hydrothermal temperature
Hw,RT Water enthalpy at room temperature
k1 First-order rate constant of adsorption
k2 Second-order rate constant of adsorption
kf Freundlich’s constant kL Langmuir’s constant kT Temkin’s constant kTH Thomas’ constant m Mass Q Flow rate
qe Dye adsorbed at equilibrium (e)
Qinput Total energy requirements
qmáx Maximum dye uptake
Qnet Net energy generation
Qoutput Energy contained in the process products
qt Amount of dye adsorbed at a given time (t)
Qx Energy requirement of a given process step (x)
R Universal gas constant
R (%) Removal efficiency
T Temperature
t Time
Wtotal Total amount of adsorbate retained in the column
Z Bed height
ΔG Gibbs free energy
ΔH Enthalpy change
ΔS Entropy change
ΔT Temperature change
ρ Pearson’s correlation coefficient
Units cm Centimeter g Gram h Hour J Joule K Kelvin kg Kilogram L Liter m Meter
xxiii mg Miligram min Minute MJ Megajoule mL Mililiter mol Mol s Second ton Tonne °C Degree Celsius µg Microgram % Percentage
Chapter 1: General Introduction
1.1. Relevance of the study
Population growth and fast technological development have led to an increased consumerism which translates into a higher resource consumption and a consequent high waste production (Couto et al., 2016; Teixeira et al., 2014). There is a projected increase in the production of municipal solid wastes (MSW) of 2.2 billion tons by 2025 (Bolyard and Reinhart, 2016). In Portugal alone, around 4.75 million tons of MSW were produced in 2017 (Fernandes et al., 2018). The ever-growing waste production is becoming a serious social and environmental problem, triggering the need to develop an improved waste management strategy.
Waste management largely focuses on treatment and final disposal of waste streams from all sectors of society, but nowadays it also contributes greatly to energy provision and secondary resource recovery (Astrup et al., 2014). European Union (EU) guidelines and strategy for waste management, present in Directive 2008/98/EC, state that “the following waste hierarchy shall apply as a priority order in waste prevention, management legislation and policy: prevention, preparing for use, recycling, energy re-covery and disposal” (Lombardi et al., 2014). This hierarchy ranks valorization operations higher than disposal methods such as landfilling.
According to the Decree Law n. º 183/2009, that transposes Directive 1999/31/EC, landfilling must be brought to a minimum. Landfilling presents many environmental disadvantages, like the generation of highly contaminated liquid effluents and gaseous emissions. Furthermore, this practice also represents loss of resources and it has significant associated economical costs, depending on the type of waste. Currently there are three landfill typologies, namely, inert, non-hazardous and hazardous and the cost of depositing in each of the typologies is higher as the wastes are more reactive (hazardous) (Ministry of Environment, Regional Ordinance and Regional Development, 2009).
In spite of all the negative characteristics, sanitary landfilling is still recognized as the most common waste management strategy to deal with urban and industrial solid wastes throughout the globe (Abood
et al., 2014; Foo and Hameed, 2009; Rivas et al., 2006). Directive 1999/31/EC stated that the amount
of biodegradable material sent to landfill ought to be reduced to 35 % of the 1995 level by 2016. For the Member States that were landfilling more than 80 % of MSW in 1995 (which included Portugal) there was a four-year derogation period (Teixeira et al., 2014). By 2008 Portugal had a landfill deposition rate of 88 %, reducing to 53 % by 2013, 52 % by 2014, increasing to 57 % by 2017, as seen in Figure 1.1 (Marçal et al., 2014; Marçal and Teixeira, 2017).
2 Figure 1.1: Final destinations of MSW in 2017 (Marçal and Teixeira, 2017).
On the 2nd of December 2015, the European Commission approved an action package for circular
economy in which the Directive 2008/98/EC was amended. This revised legislative proposal entails a set of common goals for all EU countries until 2030 regarding wastes. It sets clear targets for reducing waste production and it also sets an ambitious and credible route to long-term management and recy-cling. To ensure its effective implementation, the waste reduction targets contained in the new proposal are accompanied by actual measures to overcome the obstacles in situ and the different situations in different Member States (European Union, 2015):
• Re-use and recycle 65 % of municipal waste by 2030;
• Increase re-use and recycling for packaging waste up to 75 % by 2030; • Binding goal for the limitation of waste landfilling to 10 % by 2030; • Prohibition of landfilling wastes subjected to selective collection; • Promotion of economic instruments to discourage landfill deposition;
• Harmonize and simplify the legal framework on by-products and end-of-waste status.
In Portugal, the Action Plan for Circular Economy (“Plano de Ação para a Economia Circular”) was discussed and approved by the Council of Ministers Resolution n.º190-A/2017, in November 2017 (Council of Ministers Presidency, 2017).
Re-use and recycling represent effective material recovery. For those waste streams that cannot be efficiently recycled, energy recovery presents itself as the evident solution in order to prevent excessive landfill volumes and save fossil fuel resources. Therefore, a single waste management practice cannot handle the complete range of waste types while simultaneously satisfying the European criteria of an integrated and sustainable management system (Arena and Di Gregorio, 2014; Teixeira et al., 2014).
The production of waste derived fuels such as Refuse Derived Fuel (RDF) or Solid Recovered Fuel (SRF), represents an efficient way to recover energy from wastes (Białowiec et al., 2017). Nevertheless, these fuels often present high heterogeneity which results in less positive physical and chemical prop-erties such as low calorific values, high moisture, ash and chlorine contents. These features can limit their application in thermochemical conversion processes (Edo et al., 2017). Fuels with high chlorine and ash contents are known to cause several operational issues and environmental impacts such as slag-ging and fouling phenomena, boiler corrosion (Silva et al., 2014) and cause problematic emissions such
9.80%
20.60%
12.20% 57.40%
3 as HCl and dioxins/difurans (PCDD/Fs) (Chyang et al., 2010). Moreover, this material can have a sig-nificant polymeric fraction that lowers its grindability and can cause problems regarding the feeding systems of boilers or gasifiers. All these factors correlate negatively with its proper use for energy pur-poses.
Torrefaction, carbonization and hydrothermal carbonization are thermal conversion technologies that may enhance some of the RDF fuel characteristics, by modification of its composition and heating value. These thermal processes have been applied to lignocellulosic materials resulting in homogeneous chars with lower moisture content, higher calorific values, lower O/C ratios, higher hydrophobicity and enhanced grindability when compared with the original feedstock (Chen et al., 2015b; da Silva et al., 2017; Hwang and Kawamoto, 2010; Manyà et al., 2015; Wang et al., 2018a). According to Vassilev et
al. (1999) the use of waste derived char as an alternative fuel can bring several advantages when
com-pared with raw waste or RDF, mainly because of its higher quality as a substitute in existing coal-fired power plants, or for its application in gasifiers for syngas production.
Different thermochemical pre-treatments have different operating conditions and process require-ments, resulting in the formation of a final product with different physical and chemical characteristics. It is very important to characterize the resulting chars, because their properties will be determinant for their application in the industry.
A careful selection of optimal treatment conditions may allow to upgrade RDF, yielding chars with higher heating value, lower moisture content, higher density and lower chlorine content for fuel appli-cations, such as gasification. Furthermore, the RDF chars may also be used as carbon adsorbents or as activated carbon precursors, applications for which fuel properties, such as ash content, are not as rele-vant.
Finally, even when the obtained RDF chars are not adequate for energetic or material valorization, thermochemical upgrading will promote an increase in density that is advantageous for the landfill so-lution, by reducing land use and environmental impacts.
1.2. Research goals
This work intends to give a contribution in implementing solutions for the fuel and material upgrad-ing of RDF, whilst studyupgrad-ing the potential applications of an upgraded product. More specifically, this PhD thesis assesses the potential of torrefaction, carbonization and hydrothermal carbonization, as pre-treatment steps for RDF, in order to obtain a char with enhanced fuel properties such as homogeneity, carbon content and high heating value. Characterization of the produced chars indicates which thermo-chemical technology yields chars with better fuel properties. Furthermore, to validate energy applica-tions of the RDF chars, the chars produced via torrefaction were used as feedstock in gasification. Ma-terial valorization was also studied by using RDF chars as low-cost adsorbents, and in order to give alternatives for the application of RDF chars.
1.3. Thesis outline
• Chapter 1 – General introduction
This chapter describes the relevance of the current thesis in its field of study, as well as the main objectives and the thesis outline.
4 • Chapter 2 – State-of-the-art
This chapter exposes the current issues of waste management, namely RDF production, RDF fuel properties and energy recovery from RDF through different thermal treatment technologies. This chapter also discloses the status of RDF production in Portugal and the need for RDF upgrading technologies. The following book chapter was based on this chapter:
Nobre C., Gonçalves M., Vilarinho C. 2019. A brief assessment on the application of torrefaction and carbonization for Refuse Derived Fuel upgrading. Lecture Notes in Electrical Engineering. 505:633– 640. doi:10.1007/978-3-319-91334-6_86.
• Chapter 3 - Upgrading industrial RDF through torrefaction an carbonization: Evaluation of RDF char fuel properties
Chapter 3 describes the application of the torrefaction and carbonization processes to industrial RDF samples. RDF samples were tested for torrefaction and carbonization varying the process parameters, namely temperature (200-400 ºC) and residence time (15-60 min). The RDF chars were characterized regarding their main physical-chemical properties: proximate and ultimate analysis, high heating value, chlorine content, mineral composition and leaching behavior. The following conference proceedings (oral communication) and paper were based on this chapter:
Nobre, C., Gonçalves, M., Vilarinho, C., Mendes, B. (2018). Upgrading of Refuse Derived Fuel through torrefaction: evaluation of RDF char fuel properties. Proceedings of ECOS 2018 - the 31st International
Conference on Efficiency, Cost, Optimization, Simulation and Environmental Impact of Energy Systems,
17-22 Junho, Guimarães, Portugal. ISBN: 978-972-99596-4-6.
Nobre C., Vilarinho C., Alves O., Mendes, B., Gonçalves M. 2019. Upgrading of refuse derived fuel through torrefaction and carbonization: Evaluation of RDF char fuel properties. Energy, 18. doi: 10.1016/j.energy.2019.05.105.
• Chapter 4 – Torrefaction and carbonization of RDF: Char characterization and evaluation of gaseous and liquid emissions
In Chapter 4, RDF torrefaction (300ºC for 30 minutes) and carbonization (400ºC for 30 minutes) were scaled-up in a pre-pilot scale pyrolysis furnace. These tests entailed the chemical and physical characterization of the produced RDF chars, as well as the evaluation and characterization of the liquid and gaseous (permanent gases and condensates) emissions associated with the thermal conversion pro-cesses. The following conference proceedings (oral communication) and paper were based on this chap-ter:
Longo, A., Nobre C., Gonçalves, M., Vilarinho, C., Araújo, J., Mendes, B. (2015). Upgrading of indus-trial RDF using torrefaction. 3rd International Conference: WASTES: Solutions, Treatments and
5 Nobre C., Alves O., Longo A., Vilarinho C., Gonçalves M. 2019. Torrefaction and carbonization of Refuse Derived Fuel: Char characterization and evaluation of gaseous and liquid emissions. Bioresource
Technology, 285 (121325). doi:https://doi.org/10.1016/j.biortech.2019.121325.
• Chapter 5 – Hydrothermal carbonization of RDF
In this chapter, the effect of process variables, such as temperature (250-300 ºC), RDF-to-water ratio (1:5 and 1:15) and reaction time (30 and 120 minutes), in hydrothermal carbonization (HTC) were stud-ied for an industrial RDF sample. HTC tests were conducted in batch mode. The hydrochars were char-acterized for their fuel properties and the process waters were also charchar-acterized in order to evaluated their possible applications or remediation techniques. The following conference proceedings (oral com-munication) was based on this chapter:
Nobre C., Alves O., Durão, L., Vilarinho C., Gonçalves, M. 2019. Hydrothermal carbonization of Re-fuse Derived Fuel. EUBCE 2019 – 27th European Biomass Conference & Exhibition, Lisbon, 27-30 May. doi: 10.5071/27thEUBCE2019-3CO.15.1
• Chapter 6 - Gasification of pine waste pellets with incorporation of RDF char
To validate the energetic valorization of the RDF chars, gasification was chosen as the thermochem-ical conversion process to convert the obtained chars into a gaseous fuel.
The RDF char was pelletized in different formulations with reference pine wastes. The pellets were characterized for their fuel properties and were gasified varying two very important parameters in gasi-fication: temperature and equivalence ratio. The yield and composition of the producer gas was assessed, as well as the organic composition of the formed tars. The following conference proceedings (oral com-munications) were based on this chapter:
Nobre, C., Longo, A., Gonçalves, M., Vilarinho, C., Mendes, B. (2016). Gasification of mixtures of lignocellulosic wastes and refuse derived fuel char. 2nd International Conference on Green Chemistry and Sustainable Engineering, pp.415, 20-22 July, Rome, Itália. ISBN: 978-84-944311-6-6.
Nobre, C., Gonçalves, M., Longo, A., Vilarinho, C., Mendes, B. (2018). Gasification of pellets produced from blends of biomass wastes and refuse derived fuel char. Proceedings of ECOS 2018 - the 31st
International Conference on Efficiency, Cost, Optimization, Simulation and Environmental Impact of Energy Systems, 17-22 June, Guimarães, Portugal. ISBN: 978-972-99596-4-6.
• Chapter 7 – Material valorization of Refuse Derived Fuel char – Use as low-cost adsorbent This chapter corresponds to the material application of RDF chars. This work consisted in batch and fixed column adsorption experiments for effluent remediation. These tests were performed with model contaminants such as methylene blue and chromium. The potential for enhancing the adsorption capac-ity of the RDF chars was also studied by testing different decontamination procedures. The following book chapters were based on this chapter:
Nobre C., Gonçalves M., Resende D., Vilarinho C., Mendes B. Removal of chromium and aluminum from aqueous solution using refuse derived char. 2016. Technological Innovation for Cyber-Physical
6
Systems IFIP Advances in Information and Communication Technology, AICT-470; 515-522.
doi:10.1007/978-3-319-31165-4_48.
Nobre C., Vilarinho, C., Gonçalves M. Refuse Derived Fuel char as a low-cost adsorbent for the cationic dye methylene blue. 2019. WASTES: Solutions, Treatments and Opportunities 3rd International Con-ference, Caparica, Portugal, 4-6 September (submitted).
• Chapter 8 – General conclusions
Chapter 8 includes the main conclusions that were drawn from this PhD work as well as suggestions for future work in the studied area of expertise.
Chapter 2: State-of-the-art
2.1. Introduction
Refuse Derived Fuel (RDF) is the broad designation for fuels obtained from waste not obeying spe-cific technical characteristics and is generally associated with low quality fuels (Nasrullah et al., 2015). This designation was first used by Dr. Jerome Collins, in 1973, to name the secondary fuel produced from processed municipal solid wastes (MSW) (Phillips, 1998). More recently, new regulation and accompanying standards have given rise to a new term, Solid Recovered Fuel (SRF) (Rada and Andreottola, 2012). To provide RDF of a classification based on specific technical criteria, the European Commission has drawn up a set of standards for this fuel and named it as SRF (European Union, 2015). According to the technical specification CEN/TS 15359:2006, SRF is a solid fuel prepared from non-hazardous waste to be used for energy recovery from incineration and co-incineration facilities. This solid fuel complies with the specifications required by the previously mentioned technical specification and it is processed, homogenized and has an improved quality that allows its trade between producers and consumers (Vieira et al., 2011).
These fuels can originate in several waste streams such as MSW, regular industrial waste (RIW), construction and demolition waste (CDW) or sludge produced from potable water supply and sanitation in treatment plants (Rada and Andreottola, 2012). Only fuels derived from non-hazardous wastes may be classified as RDF or SRF. CEN/TS 15359:2006 also states that solid biofuels and untreated urban wastes are excluded from the SRF definition (Dias et al., 2006).
Moreover, RDF and SRF are considered partly renewable because of their high biogenic content (Dunnu et al., 2010). SRF is classified as a residue with the code “19 12 10” from the European Waste List (EWL) (European Comission, 2014; Vieira et al., 2011). Some countries had a classification and specification system in place before the introduction of these European standards, as such, in these coun-tries, the term RDF and SRF are synonymous. The consequence is that only SRF can be classified as EWL 19 12 10, all the other fractions deriving from a Mechanical and Biological Treatment plant (MBT plant), albeit having suitable fuel properties, must be classified as EWL 19 12 12 (European Comission, 2014).
In the United Kingdom, both EWL 19 12 10 (Combustible waste – Refuse Derived Fuel) and EWL 19 12 12 are used for RDF and rejects from Materials Recycling Facilitiy (MRF) operations, but also for SRF. The exported RDF in Ireland is classified as EWL 20 03 01 (Mixed Municipal Waste), because most RDF producers state that they undertook the minimum level of treatment to allow their waste to be legally exported (Ciceri and Martignon, 2015).
The SRF classification system is based on different indicators, namely economic (lower calorific value), technical (chlorine content) and environmental (mercury content), emphasizing the importance of these three aspects in SRF production and use. This system is based on limit values for the three parameters, using the following data presentation:
• Lower heating value (LHV) - arithmetic average (as received); • Chlorine content - arithmetic average (dry basis);
8 • Mercury content – median and 80 percentile values (as received).
The highest of statistical values (median and 80 percentile) in a series of mercury data, determines its classification. Each parameter is divided into five classes and is associated with a scale of 1 to 5 for each parameter. The class code is a combination of three classifications, since the three parameters have equal importance. Table 2.1 shows the classification system for SRF/RDF (Dias et al., 2006).
Table 2.1: Classification system used for solid recovered fuels (Dias et al., 2006). Parameter Statistical
meas-ure Units Class 1 2 3 4 5 Lower Heating Value (LHV) Average MJ.kg -1 (ar) ≥ 25 ≥ 20 ≥ 15 ≥ 10 ≥ 3 Chlorine Content (Cl) Average % (db) ≤ 0.2 ≤ 0.6 ≤ 1.0 ≤ 1.5 ≤ 3 Mercury Content (Hg) Median mg.MJ-1 (ar) ≤ 0.02 ≤ 0.03 ≤ 0.08 ≤ 0.15 ≤ 0.50 80 percentile mg.MJ-1 (ar) ≤ 0.04 ≤ 0.06 ≤ 0.16 ≤ 0.30 ≤ 1.00
This classification is supported by the same technical specification mentioned above (which in Por-tugal translates to the Portuguese Standard NP 4486:2008).
The shift in definition, classification and specification parameters of RDF for the requirements of the final user, mostly represents an effort to improve the marketability of waste derived fuels (Di Lonardo
et al., 2016). Other standards regarding SRF are also available under CEN/TC 343 (Dias et al., 2006),
such as the estimation of the biogenic fraction of SRF through the determination of biomass content under the standard EN 15440:2006 (Séverin et al., 2010).
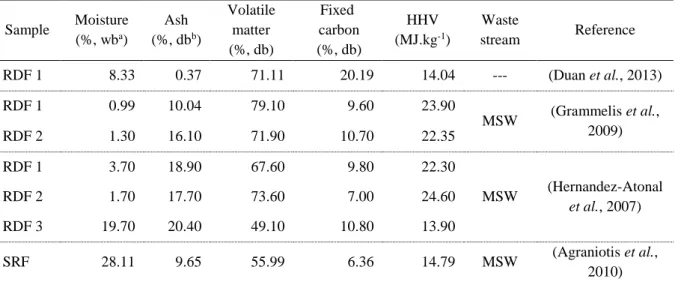
RDF characteristics vary greatly depending on their source and production line scheme and that is why it is important to evaluate the physical and chemical properties of this fuel and the performance of the thermal treatment that the fuel will undergo (Hernandez-Atonal et al., 2007). The distribution of proximate analysis parameters (moisture, ash, volatile matter and fixed carbon) will influence the per-formance of the burning bed and the heat distribution along the conversion system. Table 2.2 presents typical values for RDF fuel characterization.
Table 2.2: Proximate analysis results for different samples of RDF from different sources. Sample Moisture (%, wba) Ash (%, dbb) Volatile matter (%, db) Fixed carbon (%, db) HHV (MJ.kg-1) Waste stream Reference RDF 1 8.33 0.37 71.11 20.19 14.04 --- (Duan et al., 2013) RDF 1 0.99 10.04 79.10 9.60 23.90 MSW (Grammelis et al., 2009) RDF 2 1.30 16.10 71.90 10.70 22.35 RDF 1 3.70 18.90 67.60 9.80 22.30 MSW (Hernandez-Atonal et al., 2007) RDF 2 1.70 17.70 73.60 7.00 24.60 RDF 3 19.70 20.40 49.10 10.80 13.90 SRF 28.11 9.65 55.99 6.36 14.79 MSW (Agraniotis et al., 2010) a wb, wet basis; b db, dry basis.
9 SRF/RDF produced from MSW generally presents larger ranges in each analytical parameter due to its highly heterogeneous composition.
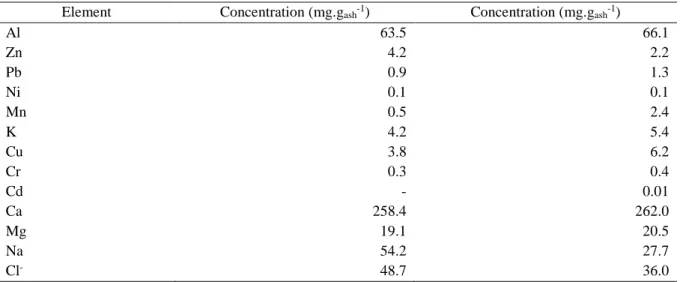
Another characteristic of RDF that impacts the chosen conversion method is its mineral composition. The mineralogical composition determines the predisposal of the fuel for ash fusibility, which leads to fouling and slagging phenomena. It represents one of the most problematic features of waste derived fuels, mainly because these ash related phenomena have a negative impact on the reactor efficiency. Table 2.3 shows the major elements present in two different RDF samples, from different sources. Table 2.3: Typical metal concentrations in the ash of RDF from different sources (adapted from Rocca et al., 2012 and Baciocchi et al., 2010).
Element Concentration (mg.gash-1) Concentration (mg.gash-1)
Al 63.5 66.1 Zn 4.2 2.2 Pb 0.9 1.3 Ni 0.1 0.1 Mn 0.5 2.4 K 4.2 5.4 Cu 3.8 6.2 Cr 0.3 0.4 Cd - 0.01 Ca 258.4 262.0 Mg 19.1 20.5 Na 54.2 27.7 Cl- 48.7 36.0
Unlike coal ashes, major elements found in waste derived fuel ashes are not of geological origin. They are mostly derived from refined products that constitute the fuel (Dunnu et al., 2010).
Current regulations are setting high quality standards for waste derived fuels, so that they can be readily accepted as substitutes or auxiliary fuels in most combustion systems with minor modifications (Caputo and Pelagagge, 2002).
Fuels produced from wastes are distinctly cheaper comparing with primary fuels (sometimes they are even offered with additional payment for the consumer) and this causes the willingness to use them in energy intensive branches of industry such as clinker production in the cement industry (Wasielewski
et al., 2011).
Waste derived fuels with the right specifications require technologically advanced production lines. The SRF/RDF production process consists in a sequence of organized unit processes aiming to separate the various components of a heterogeneous mixture, using different technologies. The process parame-ters differ from producer to producer, a consequence of the different strategies with regard to production of this fuel, depending on the degree of quality to be achieved. The line composition will also vary according with specific site conditions and the source of the raw material (Caputo and Pelagagge, 2002; Dias et al., 2006). Collection and treatment of the waste fraction with higher calorific value can be done in two different ways (Ekholm, 2005):
• Separation at the source: Through collection in different bags and containers or simple preparation in two instalments (moist and dry) in two bags of different colors, usually transparent, which are then optically separated on the RDF preparation installation;
• Separation in plants from mixed waste: Mechanical separation through physical processes like shred-ding, screening, magnetic separation, Eddy Current separation, wind separation, ballistic separa-tion, etc.
10 In Europe, mechanical treatment (MT) or mechanical biological treatment (MBT) are mixed waste plants that produce SRF/RDF. MBT technologies were developed around 1995 in Germany and Italy, and over the last 20 years, a considerable capacity of MBT has been installed in Europe. These plants are designed for material flow management. They use integrated mechanical processing and biological reactors to convert and separate residual waste into streams of suitable quality, like biostabilized mate-rial, dry recyclate or waste-derived fuels. Because of the biological treatments (composting or anaerobic digestion) that handle the organic and putrescible fractions, the MBT system is more suitable for MSW, (Velis et al., 2010).
In MT plants the various unit operations or sorting techniques, aim at separating unwanted compo-nents and conditioning the combustible matter in order to obtain an SRF/RDF of predetermined charac-teristics, following the desired quality standards (Nasrullah et al., 2014). Figure 2.1 shows examples of general procedures and unit operations that can take place in MBT and MT plants.
11 Figure 2.1: Example of process flow schematics for the production lines of MBT and MT plants (adapted from Cimpan and Wenzel, 2013; Cook et al., 2015; Pinto, 2009; Sarc and Lorber, 2013).
12 MT and MBT plants create opportunities to recover additional resources and increase the spectrum of possible energy recovery applications, including high efficiency industrial processes. Nevertheless, they also increase system complexity, they add inherent system losses and induce additional energy consumption (Cimpan and Wenzel, 2013). Mechanical separation of wastes reduces the concentration of hazardous substances contained in the waste through the concentration of these substances in other streams of the process, not leading up to fuel production (Rotter et al., 2004). The quality of the SRF/RDF is improved through this process due to an increase in the heating value by reducing moisture and ash content of the fuel.
The final stage of SRF/RDF production corresponds to packaging and storage. These final steps require extra safety measures because this fuel can go into spontaneous ignition causing explosions in the storage facilities and surroundings. In 2003 two people died in an explosion caused by the sponta-neous ignition of SRF/RDF stored in a cylindrical silo. Chemical oxidation is one of the mechanisms involved in the auto-ignition of SRF/RDF. The fuel is exposed to the air absorbing the oxygen and consequently forming peroxides (this can occur through light exposure, heat or micro-organisms) (Yasuhara et al., 2010).
SRF/RDF typologies can vary depending on their original source or on their shape (Figure 2.2). According to the latter, this fuel can be presented in the forms of:
• Fluff: Loose, low-density material, with dimensions from 10 to 100 mm and can be transported by air;
• Pellets: Produced through densification of the loose material, having dimensions < 25 mm (in diam-eter or equivalent). The pelletization process enhances the density of the fuel, giving it more energy per volume than regular fluff. It also improves the bulk density of the waste, thus improving its handling, transportation and storage (Marsh et al., 2007).
• Briquette: This typology corresponds to a block or cylinder produced by agglomeration of the fluff with dimensions from 40 to 200 mm.
Figure 2.2: RDF typologies: (a) Fluff SRF (Source: http://www.itrimpianti.com); (b) Pellet SRF (Source: http://www.suxe.co.uk); (c) Briquette SRF (Source: http://www.wxteneng.com).
According to the source, there are many typologies of SRF/RDF. They are generally applied when these fuels are produced from a very specific waste flow, like industrial wastes (PDF – plastic derived fuel or PPF – paper and plastic fuel, for example). Different typologies do not apply for SRF/RDF pro-duced from MSW (Dias et al., 2006).