International Master in Finance
Discount rates in PPP projects, survey
of literature and the Portuguese Case
Alexandre Marques dos Santos | 152412011
Supervisors: Professor Ricardo Reis and Professor Joaquim Sarmento
Dissertation submitted in partial fulfillment of requirements for the degree of MSc in Finance, at the Universidade Católica Portuguesa, September 2014
ii
Abstract
Title: Discount rates, survey of literature and the Portuguese Case Author: Alexandre Vieira Marques dos Santos
This dissertation has five main purposes. First, to gather literature on the discount rates used by public entities and governments to assess PPP projects. Second, to typify descriptively the models used to calculate these discount rates. The most used models are: the Social Time Preference rate (STPR), the Social Opportunity Cost of Capital (SOCC), a weighted average between STPR and SOCC, and the long-term government bond. Third, to compare the usage in different countries and to analyze implications of different usage in Portugal. In order to analyze these implications in Portugal, several discount rates are calculated using these previous methods. Then, these are used to discount the future payments regarding the 36 PPP projects operating in Portugal. The differences in the NPVs are analyzed. Amongst the major results, if one used the SOCC method there would have been a lighter burden to the State. Fifth, the Portuguese case in PPPs is carefully discussed. The debate on payments to PPPs and the discount rate issue is addressed. The fact that PPPs allow shifting financial responsibilities to the future, linked with the lack of a risk assessment to the contracts led to the enormous burden to the State. Since 2003, the Portuguese legal rate is fixed at 6.08%, based on the 10-year government bond, and by today there is no update. Therefore, this dissertation suggests a new rate. When discounting PPP payments, the risk-free rate adjusted for systematic risk should be used, whereas if the project is done entirely by the public sector we recommend the risk-free only.
iii Acknowledgments
I would like to start by thanking my supervisors, Professors Ricardo Reis and Joaquim Sarmento for all the guidance material, help and indispensable insights throughout all the period of this dissertation.
I also want to express my gratitude to Dr. Carlos Lopes Pereira from ERSAR for his availability and flexibility in helping me understanding better this subject. To Professor Manuela Ferreira Leite who was truly helpful in giving me her opinion and expertise in this topic.
Likewise, to all my Professors from Faculdade de Ciências da Universidade de Lisboa and Católica Lisbon School of Business and Economics who not only have accompanied me during my academic life and have enriched my knowledge, but also have contributed to my development as an individual.
To all my Friends who have believed in me, to those that always have encouraged me to give my best in everything I do. This endeavor would not have been possible without the constant emotional support of Joana Falcão who was present in every moment of my Master and was crucial during the development of this dissertation.
It would not be fair if I did not thank all my Family, but specially my Parents and Grandmother. Their belief in me is something that keeps me focused in achieving my life objectives and, for this and a lot more, I am eternal grateful.
iv Table of contents
1.Introduction ... 1
2.Literature Review ... 5
2.1.Brief Concept of PPP ... 5
2.2.Advantages and Disadvantages ... 8
2.3.Value for Money and Risk Allocation ... 10
2.4.Discount Rate ... 11
2.5.Discount Rates covered in the literature ... 15
2.5.1.Social Time Preference Rate (STPR) ... 15
2.5.2.Social Opportunity Cost of Capital (SOCC) ... 17
2.5.3.Weighted average between STPR and SOCC ... 19
2.5.4.Long-term government borrowing rate ... 19
2.6. Main Findings in the Literature ... 23
3.Methodology and data ... 26
3.1.Social Time Preference Rate (STPR) ... 26
3.1.1.Rate of time preference,”p” ... 27
3.1.2.The growth of per capita real consumption, 𝒈 ... 29
3.1.3.The elasticity of marginal utility of consumption, ... 29
3.2.Social Opportunity Cost of Capital, ‘SOCC’... 30
3.3.Weighted average between STPR and SOCC ... 33
3.4.Long-term government bond rate ... 33
3.4.1.Portuguese 10-year bond rate ... 33
3.4.2.German 10-year bond rate ... 34
4.Portuguese context in PPPs ... 35
5. Results ... 40
6. Conclusion ... 46
7.References ... 49
v List of Figures
Figure 1-Concession contract between public and private sectors and third parties. ... 7
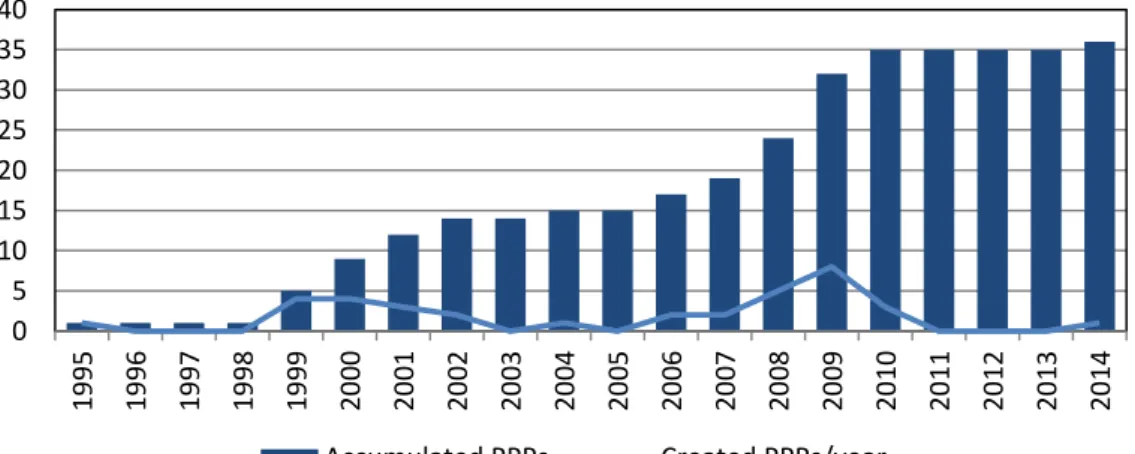
Figure 2-Number of PPPs operating in Portugal ... 35
Figure 3- Forecasted future net payments with PPPs 2012-2041... 35
Figure 4- Use of PPPs in Europe (capital expenditure as a % of GDP) ... 37
Figure 5-Pattern of the NPV of 36 PPPs payments between 2005 and 2013 using five different discount rate (in € million) ... 42
List of Tables Table 1- Government discount rates in eleven different countries (2014) ... 23
Table 2-Five different discount rates calculated using different approaches plus the legal rate. ... 40
Table 3- NPV of the 36 PPP future payments with five different discount rates between 2005 and 2013 (in € million) ... 41
Table 4-Discounted future net payments with PPPs as a % of Portugal GDP (in € millions) and difference between the current practice in the Government ... 44
List of Equations Equation 1: Social Time Preference Rate ... 27
Equation 2: Rate of time preference ... 27
Equation 3: Pure time preference rate ... 28
Equation 4: Consumption per capita at year t ... 29
Equation 5: Average growth at year t ... 29
Equation 6: The elasticity of marginal utility of consumption ... 30
Equation 7: CAPM ... 30
Equation 8: Hamada’s formula ... 31
Equation 9: CAPM after taxes ... 32
Equation 10: WACC ... 32
Equation 11: Weighted Average between STPR and SOCC ... 33
Equation 12: Daily Portuguese risk-free... 33
1
1. Introduction
For a long time private firms have been involved in public service delivering, but Public-Private Partnerships came to give a whole new meaning to the roles of the public and private sectors in the early 1990s. They are first dated from U.K. but are currently implemented all over the world.
Public-private partnerships (PPPs) are defined as “arrangements where the private sector supplies infrastructure assets and services that traditionally have been provided by the government. In addition to private execution and financing of public investment, PPPs have two other important characteristics: there is an emphasis on service provision, as well as investment, by the private sector; and significant risk is transferred from the government to the private sector. PPPs are involved in a wide range of social and economic infrastructure projects, but they are mainly used to build and operate hospitals, schools, prisons, roads, bridges and tunnels, light rail networks, air traffic control systems, and water and sanitation plants”. (IMF 2004:4 and 2006:1)
Since 1993 with Vasco da Gama Bridge, Portugal has been investing in these projects and by today has already implemented 36 PPPs in numerous sectors. The Portuguese Government is responsible for 3% of 1340 PPPs in Europe and further calculations by Sarmento and Reis (2012) conclude that Portugal is the leading country in using PPPs. Portugal has used PPPs to build an extensive highway network. Two waves were launched in the road sector: the first consists of seven SCUTS 1contracted between 1999 and 2001. These highways were originally funded by the Government using shadow tolls but, between October 2010 and April 2011, renegotiations were done to prevent most of the impact on public accounts and, from then on tolls were implemented. The second wave of road sector PPPs was launched between 2007 and 2009. With these investments, Portugal had 2,700km of highways back in 2012 placing it among the countries with the highest highway density in Europe (Cruz, 2011).
1 SCUT is short for the Portuguese “Sem Custos Para o Utilizador” (Without Costs for the User),
2
Moreover, there are already four hospitals implemented as PPPs: Braga, Cascais, Loures and Vila Franca de Xira as well as an emergency and security network based on digital trunking.
The biggest motivation to implement such contracts is to achieve Value for Money (VfM). This feature is the cost saving benefit of having two parties providing the public service and is reached by sharing the risks of the project. Although, there must be a proper allocation of the risks so that each risk is managed by the party that is best able to handle it. If there are substantially few risks allocated to the private sector, they would feel demotivated to perform the project while, on the other hand, too many risks would yield a higher risk premium for the private side and large payments would make it too costly for the State. In this case, VfM would not be achieved (Morallos and Amekudzi, 2008).
In order to test whether a PPP project achieves VfM, there is a tool that must be carried out: The Public Sector Comparator (PSC). This model uses estimates of risks, revenues and costs set into cash-flows and, using a public sector discount rate discounts them to an NPV. According to Morallos and Amekudzi (2008), this public sector discount rate has a great impact in the result and should be calculated properly.
What we propose to do in this paper is to review existing literature on discount rates and identify the most commonly used methods to calculate them. By following these methods, we apply the theories to Portugal’s case. These methods are: the Social Time Preference Rate (STPR); the Social Opportunity Cost of Capital (SOCC); The Weighted Average between STPR and SOCC; the Long-term Portuguese borrowing rate; the Long-term German borrowing rate associated with the Eurozone currency, which is considered to be less risky.
Using these methodologies, several discount rates will be calculated for Portugal between the years 2005 and 2013. Furthermore, using these discount rates, the NPV of the 36 PPPs operating in Portugal will be calculated for the same years. The purpose will be to descriptively analyze and compare the different NPVs, using the different discount rates, with the NPV using the Portuguese current discount rate also during the same time frame.
3
Our study concludes that if one uses the SOCC rate, there would have been a lighter burden to the Portuguese public accounts between 2005 and 2013. While it is undoubtedly better to pay less to the private sector, there are ethical implications of using a discount rate to save on public expense. As it is known, using a discount rate on future payments is an accounting operation and, a higher rate can be used only to report a smaller present value of the debt. However, the discount rate should represent the exact nature of a country’s risk and should not be used merely to save on public expense. This being said, it should be emphasized that contingent liabilities to PPP contracts are not reported as part of the public debt. So the incentive to inflate the rate to reduce the perception of the debt does not exist.
Moreover, the Portuguese context in PPPs is addressed. One of the major concerns regarding PPPs in Portugal is the weight that future payments represent to the public sector. As it was previously mentioned, a suitable risk allocation between the two parties is crucial to deliver VfM which did not happen in the shadow tolls roads in Portugal (hereafter designated by its local denomination “SCUTS”): an example where the public sector was facing the majority of risks. According to this dissertation’s calculations based on the 2013 State’s budget, gross future payments to road sector PPPs represent 11.3% of the size of the Portuguese economy. The fact that the country has entered in numerous contracts without performing any risk assessment led to this burden on the public debt.
Since 2003, a discount rate of 6.08% based on the 10-year Treasury bonds at that time has been ever since used by the public sector to discount these future impacts. Using this rate so extensively means that this rate represented the country’s default risk throughout the last 11 years, regardless of any change in economic and financial environment faced by the country and its government. There is some discussion about the fact that nothing was done to update or change the 6.08% official (even legal) discount rate during the recent financial crisis. In that period, interest rates associated with Portuguese bonds on the secondary market went up, with the added perceived default risk of the country. We suggest that the Government should have renegotiated with the private sector, offering a higher discount rate. This would have deleveraged the concessionaires from commercial banks and investors, as well as would have benefited the economy and would have reduced future burden of the government. Instead of this
4
fixed rate, it would be expected that this discount rate followed the path of the yield curve. This dissertation proposes an update for the discount rate. When discounting PPP payments, a long-term government bond adjusted for market risk should be used while in a public sector procurement it is suggested the use of the risk-free rate only.
The paper is organized as follows. In section 2, we gather literature to provide a brief definition of PPPs and their main advantages and disadvantages. This is followed by the literature on the concept of risk allocation and Value for Money (VfM) as well as a deep background on discount rates in PPPs and, the methods used by several governments to calculate them. In section 3, the methodology used to calculate the discount rates is presented. Section 4 outlines the PPP’s context in Portugal, particularly, the sectors where they are implemented; their evolution since their first implementation and criticisms about future payments. Results and a discount rate suggestion are presented and discussed in section 5. Section 6 summarizes the main conclusions.
5
2. Literature Review
2.1. Brief Concept of PPP
One important driver of one country’s economy is its infrastructures and the quality of service they provide. In most countries, there is a deficit of public service in what comes to infrastructures due to the difficulty of funding. Therefore, one problem that has arisen is known as the “infrastructure gap” characterized by the difference between the population needs and the resources governments have historically invested in meeting those needs (Deloitte Research Study-Closing the Infrastructure Gap, 2006).
Public-private partnerships (PPPs) are seen as one of the solutions for this issue. PPPs can be defined as “an agreement between the government and one or more private partners (which may include the operators and the financers) according to which the private partners deliver the service in such a manner that the service delivery objectives of the government are aligned with the profit objectives of the private partners and where the effectiveness of the alignment depends on a sufficient transfer of risk to the private partners. “(OECD, 2008) This said, it differs from a traditional public provision in the sense that the government signs a long-term contract with the private sector to supply a service to the public sector that the private consortium designs, builds, owns and runs the physical assets required for the delivery of the service and not by the government building or purchasing physical assets, retaining ownership and using public sector employees or a private contractor to deliver the required service (Grout, 2003). A key element is the bundling of the construction and operation of the asset. The private partner will receive either a stream of payments from the government, user charges imposed directly on the end users or even a combination of both (OECD 32nd annual meeting, 2011).
PPPs can be placed between traditional public procurement and fully private provision. Often the government sets the quality and quantity required, and allows the private sector to design and build the infrastructure. By doing this, the public entity is dealing with the risk of having a “faulty design” as well as improving the efficiency of
6
the service. In contrast to a traditional procurement, where the government buys the capital asset directly from the private party, here, it buys the stream of payments that are generated with the asset. This means that the operation & maintenance (O&M) of the capital asset as well as the delivery of the service are total responsibility of the private sector. However, not all the risks are allocated to the private party, usually, the risk is allocated to the party that can manage it better.
In PPPs, all the costs during the investment stage are assumed by the private sector which enables the government to avoid the investment’s impacts on the budget and national debt. This is considered one of the main advantages of PPPs. During the investment stage there are no cash outflows and payments are made to the private party during the operational stage only, covering O&M, debt service and corporate taxes. In addition, they provide shareholders a return (Sarmento and Renneboog, 2014).
The concession contract between the public and private sector combines construction, financing and operation and is limited in time. Despite not having all the conditions covered in the contract, the contract is complex and covers a wide range of issues such as conditions of design, construction, financing, O&M, public and users’ payments, and also the residual value or the final transfer of the asset from the private to the public sector. Moreover, a series of detailed contracts with third parties are comprised in the PPP: a construction contract with the construction company, a financing contract with the syndicated banks, outsourcing contracts for O&M, insurance contracts to cover risks and a shareholder’s agreement that defines the long-term relations with the PPP owners. Although the public sector is not formally present in these contracts, it is still crucial for the success of the infrastructure that the government monitors the process (Hart, 2003; Sarmento and Renneboog, 2014).
According to Moralos and Amekudzi (2008) there are several phases in a PPP procurement process: 1) an initial feasibility assessment determining if the project is economically viable and whether it should be pursued as a PPP; 2) the bidding process; 3) the construction phase; 4) the operation phase.
This type of agreement is based on the creation, by the private sector, of a single entity called Special Purpose Vehicle (SPV) merely for the purpose of the contract (figure 1).
7
Source: Grimsey & Lewis (2002)
A consortium is necessary since there is no company that has the in-house know-how necessary to fund, design, build and operate the service (Carrillo et al., 2006). This private entity is financed through a method of raising long-term debt for major projects called Project Finance (Yescombe, 2007).
The Special Purpose Vehicle gets its larger portion of the financing through banks (lenders) where it gets around 70%-90% of debt and the rest is provided by shareholders’ equity. The simple objective of this private company is the generation of cash-flows for the project and for the investors (Ye, 2009). These future cash-flows are the only guarantee of the financing by the banks, thus, the risk that is allocated to the private side must be reasonable (Blanc-Brude and Strange, 2007).
Government Advisers
Public Sector Funding Advisors
Operating Company (SPV) SPV Advisors Equity Funding Construct/Manufact ure “Hard” Operation Design Services Installer DebtFunding Building Contractor Equipment Provider Facility Manager Catering Service Support
8 2.2. Advantages and Disadvantages
In the literature, we can find seven main advantages and seven main disadvantages, regarding PPPs. The advantages are: 1) the “off-balance sheet”; 2) the possibility of building an infrastructure; 3) Value for Money (VfM); 4) Joining competences; 5) Risk Allocation; 6) Single contract; 7) Focus more on Strategy than on Operational tasks. However, these advantages have their drawbacks and may be considered as disadvantages. Having said this, the disadvantages are: 1) the “off-balance sheet”; 2) the possibility of building an infrastructure; 3) Value for Money (VfM); 4) Risk Allocation; 5) Single contract; 6) Focus more on Strategy than on Operational tasks ; 7) the private cost of financing.
To begin with, the advantage that is mostly described in the literature (Grimsey & Lewis, 2005; Sarmento and Renneboog, 2014; Yescombe, 2007) is the “off-balance sheet” accounting of this transaction, also called as the “budgetary benefit”. Public expenditure is not affected by PPPs, thus, there is no impact on the public debt during the investment stage. This concept is briefly explained in (Yescombe, 2007): “A PPP allows the capital cost of a public sector facility to be spread out over its life, rather than requiring it to be charged immediately against the public budget. This cost is then either paid by users instead of paying taxes or, charged to the public sector budget over the life of the PPP contract, in either case through payment of service fees.” However, future payments from the public party to the private consortium will be accounted for in the government’s budget. On the other hand, one of the major concerns regarding PPPs refers to this concept of “budgetary benefit”. This temptation to avoid budget constraints may lead to a debt overhang (the debt level is so high that the government cannot ask for more debt) (Sarmento and Renneboog, 2014).
Secondly, according to Grout (2005) this type of contract makes it possible to build an infrastructure that otherwise would not be built due to budget restrictions as well as helps to reduce the infrastructure gap problem. Nevertheless, it can also be seen as a disadvantage because as there is no budget restriction, governments are less likely to be careful in their choice of projects (Heald and Georgiou, 2011)
Another advantage is the Value for Money (see next section) which brings the idea that the same quantity and quality can be provided at a lower overall cost.
9
However, Value for Money is complex to measure and has led to an exhaustive debate on whether PPPs actually achieve it (Grimsey, 2007; Moralos and Amekudzi, 2008).
It is also worth mentioning that PPP projects bring private competences to the public project. By doing this, the public sector is certain that the private sector will bring more efficiency to it. The expertise and experience of the private sector encourages innovation which results not only in reduced costs, shorter delivery times, and improvement in the functional design, construction processes but also better facility management and operational processes. By using its innovative skills, the private partner can manage complex financial arrangement more efficiently, whereas the public sector is able to control policies and regulations. As a result, the combination of both provides a higher value for the project (Harris, 2004).
Fifth, sharing all the risks throughout the life of the contract is another advantage of PPPs but one difference from the public provision where the government bears all the risks. Risk allocation assumes that risk should be transferred to the party that manages it better leading to reduced cost associated with risk (Deloitte Research Study-Closing the Infrastructure Gap, 2006). On the other hand, the valuation of risk transfer is not that straightforward and leads to some subjectivity (Shaoul, 2005). The lack of experience showed by the public sector aggravates this situation (Ball et al., 2007; Pollit, 2002).
Sixth, a PPP is seen as a single contract between the public and one private company therefore it represents simplicity, whereas, on the other hand, traditional procurement consists on multiple contracts. Nonetheless, this contract is still incomplete which often leads to future renegotiations (Engel et al., 2006). In addition, there is asymmetry of information between the private and public sector as a single contract allows the private sector to have more information. Moreover, it may lead to an ‘opportunistic behavior’ on the part of the private party (Guasch, 2003; Chong et al., 2006b) which happens when a contracting party strategically uses the contract’s imperfections to gain a higher proportion of the value generated by the contract at the expense of the contracting partner (Chong, Huet, and Saussier, 2006a).
10
Furthermore, (Bovaird, 2004) states that the public sector can focus more on strategy and less on operational tasks when it initiates a PPP. Yet, as PPP contracts are long-term (usually 30 years) and government policies change over time, strategic planning becomes unpredictable (Heald, 2003; Sarmento and Renneboog, 2014).
The last drawback is that the private consortium has a higher cost of financing than the public because lenders to the government are not taking any significant risk, whereas lending money to a PPP project is certainly riskier (Yescombe, 2007, p.18). However, this is not unanimous among the literature and has created a huge debate that will be explained later in the discount rate section.
2.3. Value for Money and Risk Allocation
According to the National Audit Office, value for money (VfM) is defined as “the optimum combination of whole life cost and quality (or fitness for purpose) to meet the user’s requirement.”2
The OECD 32nd annual meeting (2011) claims that “a key argument for PPPs is that through harnessing the private sector’s expertise in combining the design and operation of an asset – applying a whole of life view – the service can be provided in a more efficient manner, i.e. providing more “value for money” compared to traditional forms of procurement and production.” (See Appendix- Exhibit I)
To achieve VfM, there has to be a proper allocation of the risks between the public sector and the private sector because, on one side transferring too little risks to the private sector would make the project inefficient. On the other hand, if the private sector bears more risks than it can handle it would result in a high-risk project, and larger payments would make it too costly to pursue as a PPP. If this happens, VfM would not be achieved (Moralos and Amekudzi, 2008). However, achieving this can become a very hard job, as Grimsey and Lewis (2002) refer the emphasis on risk transfer can be misrepresentative as value for money requires fair allocation of risk between the public and private sector partners, and there may be a natural struggle
11
between the public sector’s need to demonstrate the value for money versus the private sector’s need for robust revenue streams to support the financing arrangements.
There are many reasons why governments undertake PPPs but achieving VfM is the main reason why a PPP project should be carried out (Grimsey and Lewis 2005, p.346). The authors also support that the core test to estimate value for money is the Public sector comparator (PSC). This model is “based on estimates of full costs, revenues and risks, set out in cash flow terms, discounted at a public sector rate to an NPV.” It is then compared with the discounted value of payments, incorporating risks and costs retained, under the PSC model. Fundamentally, what should be tested is whether a PPP achieves a lower overall NPV of costs than if carried out entirely by the public sector. Certainly, the discount rate has a great impact on the project’s VfM hence the conclusion of whether to pursue a PPP or not. (Moralos and Amedzuki, 2008)
2.4. Discount Rate
Following the reasoning above, the discount rate plays a major role on discounting the cost cash flows of public provision and PPP projects. Hirshleifer (1964, 1966) and Sandmo and Drèze (1971) claim that when assessing a VfM test it should be used one single rate for both procurement methods (PSC and PPP). Arrow and Lind (1990) argued that this rate should be the risk-free rate. As it is going to be discussed later, many governments follow the policy of using the same rate for evaluating public and private projects. On the other hand, Grout (2003) argues the opposite: “when using one single rate, the VfM test is biased.” Hence, the discussion of whether to use a higher discount rate to assess a public provision when compared to a PPP is of a high concern (Grout, 2003). The main reason given by the literature is that the government can pool risks. The public sector can borrow at lower rates than the private sector which comes from the fact that they have a lower probability of bankruptcy (Arrow and Lind, 1970; Samuelson, 1964). However, several authors3 claim that this argument is fallacious because it relates to the default rate and not to the differences in risk between public and private projects.
12
According to Grout (2003), failure to recognize that the discount rates must be different may lead to high reliance on public procurement and prejudice the private sector. Continuing his explanation, to value a public sector provision a discount rate is needed to discount the cost cash flows which represent the cost that the government has to build the infrastructure. Oppositely, this cost cash flow is a revenue stream to the private entity and needs to be valued from the revenue side. Grout (2003) continues his reasoning claiming that “with a PPP, this revenue stream is not the equivalent cost of building the facility. It is the cash flow associated with the flow of benefits valued at the price in the contract.” The problem is that the cash flows that are discounted by the public sector tend to be cost cash flows whereas any private contribution to the provision of services, when viewed by the government, tends to have some elements of revenue or net revenues built in. In addition, there is every reason to suppose that the risk characteristics are different. The author concludes that, even in a world of imperfect markets it is still reasonable to use a lower discount rate on the public sector. As a result of this argument, it is inappropriate to use the same discount rate in a VfM analysis because it prejudices the private sector supply and leads to extensive reliance on public procurement.
Despite this, there is still a strong debate regarding this subject. Also, there is no agreement on the approach used to calculate the governments’ discount rate (Shugart, 2008).
For the VfM test, the key question is whether the discount rate should be based on a social discount rate (SDR) or rates coming from the financial markets (FMR). If one uses a SDR, the problem lies on how to estimate it, while if using a FMR, the question that should be addressed is whether to use a “risk-free” rate or the yield on the corporation’s debt or even both (Contreras, No date). The SDR can be seen as a measure of the importance of the welfare of future generations in comparison with the welfare of present generations. This shows the importance of the discount rate estimation as it can alter the utility for future populations. As Contreras (No date) clarifies, using a high discount rate shows that society does not want to invest a great amount of capital in projects that may improve the life quality of future generations. Some welfare economists use market interest rates on their NPV assessments. But, there are arguments that have been used against the use of market rates as social discount rates, such as market imperfections and taxes (Drèze and Stern, 1990). For these
13
authors, since market rates only incorporate current utility preferences, governments should go far beyond market interest rates.
When it comes to SDR, there are two alternatives: the Social Time Preference rate (STPR) and the Social Opportunity Cost of Capital (SOCC). The first rate reflects the rate at which society is willing to pay for receiving something now rather than in the future, while the other is the marginal cost of capital used in a public project. These two approaches are the ones which are more often referred in the literature (Harberger, 1972; Lind, 1982; Roumboutsos, 2010).
Young (2002) explains that first, it is important to understand why the approach to the discount rate is not so simple. Imagine, for instance, a perfect capital market where there is only one market interest rate, the same information for all investors and there are no aspects that are not covered by the market. Following these assumptions, the market clears at a rate where the time preference for consumption equals the opportunity cost of capital. However, due to market imperfections these two rates cannot be equal leading to the inevitable question of which rate to use.
In order to understand the difficulty in selecting the “correct” method the following example will explain it clearly.
Considering the example of (Roumboutsos, 2010) that people save more money when the return is higher, line SS illustrates the capital offered for investment, this is, the preference between current and future consumption. Line II illustrates the demand for investment capital as a function of the cost of capital. When there are no distortions, the market will balance for a rate (r), for which, . On the other hand, distortions will point to different rates, leading to the uncertainty of the most appropriate method to use (see Appendix- Exhibit II).
The difference between these two approaches lies on how they transfer resources between people living at different points in time. Contreras (No date) argues that the method of choice consists of classifying the resources according to whether they come from consumption or investment. In case they come from investment, this component should be converted into consumption-equivalent units by using the shadow price of capital. In addition, the resulting consumption- equivalent should be discounted at the STPR.
14
In his working paper, (Evans, 2006) emphasizes that different approaches to calculate the public sector discount rate lead to different discount rates across European countries. In 2002, the French government used a rate of 8%4 solely based on the marginal product of capital (SOCC) whereas Germany based its rate on recent values of the real long-term government bond rate which was 3%5. Subsequently, while it may be debated that the STPR is theoretically superior to the long-term government bond rate as a choice of social discount rate (HM Treasury, 1997 p.83-84; Spackman, 2004 p.488-489) the struggle to obtaining reliable parameter estimates makes the market bond rate a possible choice on realistic grounds. This line of argument can be used by those who agree with current German and Portuguese practice.
One appealing feature of social discounting based on the long-term government bond rate is that for the Eurozone countries the same bond rate applies. Additionally, with these countries observing a common low inflation target, the ex-ante real bond rates should be much the same. Moreover, when discounting benefits and costs, it has been debated whether the Portuguese public sector should use the long-term Portuguese bond rate or the German one since these two countries share the same currency. Since 2003, the Portuguese government has been using a discount rate (after allowing for inflation) based on the 10-year government bond rate of 6.08%6 for discounting the future payments regarding PPPs. The problem is that, at that time it may have been a correct rate however accordingly to the rating of the country and the volatility of the market since then, there should have existed an update for it. This paper will address this particular question in section 4.
4 Set in 1985 at 8% real based on Commissariat Général à la stratégie et à la prospective Dec 2003 5
Since 2004: based on Evans (2006)
15 2.5. Discount Rates covered in the literature
2.5.1. Social Time Preference Rate (STPR)
Most likely, one of the main exponents in this rate, Feldstein (1964) states that the social discount rate “must reflect public policy and social ethics, as well as judgment about future economic conditions” and his view “would be to allow administrative determination of the STPR with whatever weight to the welfare of future generations these democratic administrators would allow.”
According to Grimsey and Lewis (2005), the discount rate used to discount the stream of benefits and costs should be based on the “Social Time Preference Rate” which has two components:
1. The basic “Social Time Preference Rate” (STPR). This represents the rate at which society is willing to pay for receiving something now rather than in the future. Calculations7 suggest that in most developed economies this is around 3.5%–4.0% in real terms (i.e. before allowing for price inflation).
2. Some allowance for other factors, mostly to ensure that the public entity does not assess the benefit of projects without taking into account the risk to which it exposes taxpayers along the process (for example, the potential to incur additional costs if things follow the wrong way).
The Conference on “Discount Rates for the Evaluation of Public Private Partnerships” defines “Social Time Preference” as the time preference of population, as a whole, for marginal income or consumption.
Ramsey (1928) set out the famous equation:
Where = pure time preference, per cent per year;
= income elasticity of the marginal utility of income (with sign reversed); = rate of growth of per capita real consumption (income), per cent per year.
7 HM Treasury (2003)
16
Similarly, HM Treasury (2003) uses a STPR but then, has some variations from Grimsey and Lewis (2005). This STPR is the sum of three components: 1) “pure time preference” rate; 2) a “catastrophe risk” rate; 3) and a third component that takes into account the idea that as per capita income increases, people will care less about additional income, and this increases their preference for money today relative to money in the future.
They calculate the “pure time preference” rate plus the “catastrophe risk” rate to be 1.5% and the third component at 2%, meaning that the STPR is 3.5%, which is the real discount rate used to compare the PSC with the PPP project.
An issue arises when considering projects with very long-term effects, the so-called intergenerational impacts, because these projects have impact on future generations. The STPR is a reflection of subjective time preferences and one expects that different individuals have different time preferences as well as it differs across different time horizons (Contreras, No date). As Grimsey and Lewis (2002) claimed, the issue is uncertainty. Weitzman (1998), Sozou (1998) and Azfar (1999) showed how the uncertainty problem regarding the interest rate could be addressed by time-declining discount rates (DDRs). Weitzman (1998) argues in favor of “a social rate of return that is not only lower than the private rate of return, but that is expected to decline systematically over time”.
Uncertainty about the future can be dependent on many factors, such as: the rate of economic growth, the amount of capital that will be accumulated, the degree of marginal utility of income of distant generations, and/or the state of the environment, among others (OXERA, 2002; Contreras, No date; Spackman, 2004). Moreover, there is empirical evidence that individuals normally discount their future utility at declining rates of interest.8
When considering long-term projects, with a maturity of more than 30 years, UK proposes a declining discount rate. Before 2003, U.K. used a discount rate of 6% based on a weighted average between STPR and the SOCC (Evans, 2006). It may seem intuitive to use a risk-free discount rate, even if just because it is certainly difficult to predict these three components of the STPR and, as far as Heald (2003) is concern, there are far more implications to PPPs than a simple reduction in the discount rate from 6% to 3.5%.
8 See Henderson and Bateman (1995)
17
More recently, Evans and Sezer (2004) and Evans (2006) have argued for a standard benchmark European discount rate of around 3% to 4% based on the SRTP. This rate is slightly lower than the 5% rate recommended by the European Commission (2002) and, as such, its use should result in a more generous distribution of budget funds to longer-term projects. Likewise, Lopez (2008) calculated SDRs for nine Latin American countries9 based on the SRTP. He stressed the fact that, depending on the growth opportunities of the country, these DRs can vary from about 3% to 4% in a future low growth scenario and to 5% to 7% in a high growth scenario.
Despite all of this, some authors believe that the opportunity cost of capital should be used when the alternative is for funds to be invested in the private sector.
2.5.2. Social Opportunity Cost of Capital (SOCC)
The financial economics literature takes the view that the social discount rate should measure the social opportunity cost of capital, which depends on the level of systematic risk of each project. Basically, this rate is the pre-tax rate of return yielded on private investment with similar risk profile as the public sector. The “Social opportunity cost” discount rate is measured by the commercial rate of return that would be yielded on private investment. This rate reduces the net present value of the best alternative private use of funds to zero meaning that it mainly reflects in financial market terms. Basically, the government should take into account what “similar” projects would provide in returns if undertaken by the private sector.
If the public party uses this discount rate and only invests in positive NPV projects, then public projects would not displace higher value private sector projects (Young, 2002).
Young (2002) argues that this approach is the most suitable if the government is thinking about investments that could also be undertaken by the private party, for instance, if the public sector “is investing in state owned enterprises and service delivery crown entities.” Moreover, the SOCC rate is also the most appropriate method
18
to use when undertaking cost recovery of an already existing activity because it is concerned with the investment decision being made rather than the service being provided.
According to Young (2002), there are mainly three methods to calculate the SOCC rate: 1) CAPM (Capital Asset Pricing Model); 2) APT (Arbitrage Pricing Theory); 3) Fama-French’s multi-factor model. The use of CAPM model reflects an opportunity cost of capital approach, which is used by Canada and New Zealand.10 Moreover, this method is used to calculate the expected return on equity for the public sector and should be then used in a weighted average cost of capital (WACC) formula to take into account the assumed debt and equity structure in the public sector.
Lally (2000, p.47) argues “However, parameter estimation problems appear to be considerably less for the CAPM than for the APT, multi-factor models (such as Fama-French) and the dividend growth model. These considerations do not favor any alternative to the CAPM, and this is consistent with the CAPM’s dominance in practice.”
According to the New Zealand Treasury (2008), the usual approach is to estimate the return from alternative investments in the private sector which is a good proxy for the Crown’s cost of capital. This cost of capital, as it was previously mentioned, is the return foregone by investing on one private project rather than in an alternative one in the public sector. One alternative outside the public sector, as the New Zealand Treasury explains, can be the financial market because the companies who make up this market are companies who search for the best investments in the economy and, in fact, the government does invest in the financial market. However, there are critics to this discount rate stating that financial markets are not perfect due to externalities and taxation. But, these two externalities can be taken into account. Externalities can be taken into account explicitly in the individual cash flows. Taxation reduces the amount of capital to be invested compared to a situation with zero tax. They explain that, using a pre-tax rate of return is equivalent to tax public investments. As a consequence, these market imperfections are insufficient to change the discount rate.
When it comes to Netherlands, the Ministry of Finance supports that the discount rate should be very close to the weighted average cost of capital (WACC) for both the PPP and the PSC (PPP Knowledge Centre, 2002a and 2002b). When
19
comparing public investment with subsequent benefits in kind, the US OMB11 uses a SOCC rate of 7%.
2.5.3. Weighted average between STPR and SOCC
It is often discussed that a private commercial (SOCC) rate of return should be used for government discounting or even a weighted-average of this rate with the STPR (Spackman, 2004; Spackman, 2008). According to Spackman (2004), it is proposed a weighted average of the two approaches described above, i.e., where is the share of resources or cost displacing private investment and (1 a) equals the proportion of resources or costs displacing current consumption. As previously mentioned, the U.K. treasury used a discount rate of 6% before 2003, based on this approach.
2.5.4. Long-term government borrowing rate
As Contreras (no date) defends, the VfM test does not evaluate market failures and consequently, market information should be used instead of the social discount rates.
In some countries, the long-term borrowing rate is seen as a proxy for the discount rate on the grounds that the government uses additional borrowing to fund incremental expenditure. The use of the government borrowing rate as the discount rate is mainly used by the US (Spackman, 2004). When it comes to AAA rating economies, this rate tends to be approximated to the STPR and below a risk-adjusted discount rate.
There are basically two approaches to adjusting for risk (Contreras, no date). One approach for calculating the discount rate is to use a public sector’s “risk-free” and add a risk margin to reflect project risk. An alternative method is to value risk in the
20
cash flows so that a risk free discount rate is applied to cash flows that have been adjusted for risk. Essentially, in terms of the conventional discounting formula, in the first approach risk is allowed for in the denominator, whereas in the other treatment a risk adjustment is made in the numerator.
Despite having some equivalence between the two methods, it is easy to understand how the process of putting theory into practice could result in different outputs. If the risk-adjusted interest rate is used, then it must reflect systematic risk rather than idiosyncratic project risk, since the latter can be diversified in a way that no individual bears substantial risk (Brealey and Myers, 2003; Grimsey and Lewis, 2005). According to Heald (2003), the idea of using a “risk-free” discount rate has an intuitive appeal, since adjusting the cash-flows for risk seems particularly difficult to carry through. The issue is not risk, but uncertainty according to Grimsey and Lewis (2002).
Moreover, Contreras (no date) explains that governments traditionally do not plan for systematic risks or uncertainty, and as a result, in the case of public sector procurement, the calculations only contain quantifications for project-specific risk. The public sector can be able to ignore uncertainty across its whole portfolio, while bidders for a PPP project cannot.
In Australia, more specifically in the city of Victoria (Shugart, 2008; Partnerships Victoria, 2001), it was followed the same approach as in U.K. but it was also revised in 2003. Although, they suggested a different route on the reasoning that the discount rate methodology used to calculate the PSC should be consistent with the one that the government uses to assess bids. This is recommended to be a rate indicative of the project risk, such that the discount rate is a function of the projects’ risks and as follows, needs to be specific to each project. In perfect capital markets, this would mean that, as long as there is sufficient competition to drive every component of the deal to maximum efficiency, the proper discount rate would be the rate of return implicit in the winning bid, concluding that would not be necessary to calculate a specific discount rate for analysis (Grimsey and Lewis: Discount Debates, 2004; Grimsey and Lewis, 2005). (Shugart, 2008) goes further on Partnerships Victoria. They start with a risk-free rate and then adjust it for risk by using the Capital Asset Pricing Model (CAPM). The risk-free rate used corresponds to the yield to maturity (ytm) of a 10-year Commonwealth Bond and back in 2003 was 3%. More recently, this value has risen to about 3.5%. The market risk premium is taken to be 6%. The risk adjustment based on CAPM takes into
21
account three “risk bands” according to type of project, with asset betas of 0.3, 0.5, and 0.9 yielding risk premiums of 1.8%, 3% and 5.4%. Water, transport and energy projects are considered to be at the medium “risk band”. Following this, their discount rate should be 6.5% (=3.5%+0.5 x 6%).
This rate above is going to be used for net cash flows of the underlying project before financing. Partnerships Victoria sees two further considerations in determining the rates to be used for the PSC-PPP comparison:
1. It is costs that are being considered (negative cash flows).
2. Risks should be seen from the perspective of the public sector. For the PPP project, these are not the underlying risks of the project but the risks that are intentionally or unintentionally borne by the public sector – mostly through the payments that the government makes to the private consortium.
Partnerships Victoria state that the PSC cost flows should always be discounted using the risk-free rate whereas the PPP outflows (seen from the public sector perspective) should be discounted using the risk-free rate plus a risk premium that is proportional to the systematic risk that has been transferred to the private sector. They make it clear that these discount rates are meaningful only when comparing the two projects: “…using the risk-free rate for the PSC will not necessarily give the present value of the true costs to the government of that option. It is not the right rate to use in a stand-alone analysis of the PSC project.”
Since 2006, Australia’s Commonwealth Finance Ministry has established several approaches for different situations.12
According to Central PPP Policy Unit (2006), the discount rate used when comparing a PPP project with the PSC in Ireland “should reflect the relative value of the cash flows from the State Authority’s perspective.” For them “the discount rate is based on the risk-free cost of debt to the public sector – the yield on the appropriate long term Government Bond.” Central Guidance in Ireland states that this rate should be used in discounting all cash flows and if any adjustment for risk is to be made, it should be made to the cash flows and not to the discount rate. This same approach is used by
22
South Africa’s Government in which they propose that one should begin by using the yield of a government bond (risk-free rate) with a remaining maturity similar to the duration of the project. In addition, they take the same opinion as Ireland in the sense that risk should be accounted for in the cash flows and not in the discount rate. However, when “it is not possible to accurately reflect the effect of all risks in the cash flows of the project a risk premium could be added”. It should also be emphasized that this rate must be used for both the PSC and the PPP model, thus, South Africa’s Government has the opinion that there should always be used one single discount rate.
2.
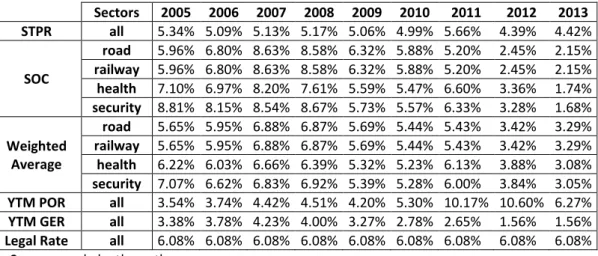
6. Main Findings in the LiteratureThis table summarizes all the diversity in the discount rate used to discount public benefits and costs, referred in the literature review.
Table 1- Government discount rates in eleven different countries (2014)
Country Central Guidance Discount Rate
Australia
Commomwealth Finance Ministry issues “Handbook of CBA, Jan 2006”
In 2001, Partnerships Victoria used a rate of 6,5% for water, transport and energy projects (PPP projects), based on a risk-free rate which was adjusted for risk using CAPM values. For the PSC-PPP comparison, they used the risk-free rate for the PSC cost flows.
In 2006, SOCC rate for CBA analysis was settled at 10% and STPR of 3% (if only consumption is taken into account but rarely used).
Canada
Treasury Board Secretariat issues “Benefit Cost Analysis Guide: 2007”
8% real rate based on SOCC.
France
Commissariat Général à la stratégie et à la prospective issued a report : « Cost Benefit Assessment of Public Investments : Dec 2003 »
4,5% based on CAPM, propose a risk-free rate declining to 1,5% after 2070 and a risk premium of 2% increasing to 3% after 2070.
24 Ireland
Guidelines for the Provision of Infrastructures and Capital Investments through PPPs: Procedures for the
Assessment, Approval, Audit and Procurement of Projects-July 2006
Based on the risk-free cost of debt to the public sector.
Netherlands PPP Knowledge Centre
(2002a and 2002b) Discount rate based on private’s sector weighted average cost of capital. New Zealand New Zealand Treasury: New
Zealand Primer (2008)
Currently, this discount rate is also based on the SOCC method. There are four different rates of 6%, 8%, 8% and 9.5% for different projects (buildings, default, infrastructure and technology).
Portugal Based on “Despacho n.º 13
208/2003 (2.ª série).” Since 2003, discount rate is based on 10 year government bond adjusted for inflation (6.08%)
U.K. HM Treasury (2003) Before 2003, Treasury used a weighted average between STPR and SOCC. Currently, a rate of 3.5% is used, based on STPR. Declining discount rates after 30 years.
US
Office of Management and Budget: Circular N.º A-94 Revised (Appendix C on Cost-effectiveness revised Jan 2006)
7% based on SOCC. This rate is used to compare public investment with subsequent benefits. For cost-effectiveness analysis, lease-purchase analysis, internal government investment and asset sales analysis, the discount rate is the treasury’s borrowing rate.
South Africa PPP Manual-National
Treasury 2004
Yield of a government bond with a remaining maturity similar to the duration of the project. Treasury does not prescribe a rate to use for the discount rate.
It is evident that there is no universal method when calculating the discount rate for the public sector, as every country, based on different assumptions, has its own policy and discount rate approach.
The Portuguese Government has first given use to PPPs in 1993 with the construction of the Vasco da Gama Bridge, investing an amount of 867 million euros (€), and by now has already created 36 public-private partnerships.
Based on the different methodologies used by other countries, such as those referred in the literature, several discount rates will be calculated and for each established discount rate the NPV of these PPP contracts will be analyzed between the year 2005 and 2013 as well as a comparison with and the NPV using the current Portuguese discount rate. This assessment, not only will be made from year to year (horizontal basis) but also from discount rate to discount rate (vertical basis).
Certainly, different methodologies have different assumptions therefore the output shows different discount rates. Furthermore, this paper will show the main concerns that are linked to the current practice of the Portuguese government. What we propose next is to consider a methodology or the inputs that seem fair in order to calculate the discount rate when assessing these PPPs’ contracts.
26
3. Methodology and data
As mentioned before, one of the purposes of this paper is to compare and analyze the NPV of the Portuguese Government net payments, between 2005 and 2013, regarding the 36 PPP contracts operating in Portugal, using the most known methods referred in the literature, with the NPV using the current discount rate practice of the Portuguese public sector. The methods which were previously discussed are: 1) Social Time Preference Rate; 2) Social Opportunity Cost of Capital; 3) Weighted average of the previous two; 4) Long-term government borrowing rate.
In this section, the calculations behind each approach, that will then define the discount rate to discount the PPP payments, will be explained in detail
The data used was based on estimated future payments to the PPPs that were taken from the State budget reports from 2005 until 2013. Other relevant data was used but it varies between approaches so it would be mentioned in the specific subsection.
3.1. Social Time Preference Rate (STPR)
The methodology followed in this subsection was based on Evans & Sezer (2004) study where the authors calculate social discount rates (SDR’s) for six major economies using the Ramsey formula. Additionally, the UK Treasury’s guidance on appraisal and evaluation in Central Government (HM Treasury, 2003) currently uses this method since 2003. This model has its origin in models of individual savings behavior, in which individuals maximize utility (welfare) over time (OXERA, 2002).
In this dissertation, this same approach was followed and applied to the Portuguese case.
27
Based on the Ramsey formula (Ramsey, 1928), the Social Time Preference Rate can be calculated as follows:
Equation 1: Social Time Preference Rate
𝒈
Where,
p=pure time discount rate
e= absolute value of the elasticity of marginal utility of consumption (income) g=projected long-run growth of per capita real consumption (income)
In order to reach the STPR, each one of these three components needs to be calculated.
3.1.1. Rate of time preference,”p”
Pearce and Ulph (1999) have further decomposed this parameter into:
Equation 2: Rate of time preference
Where d is the rate at which society is discounted independently of any risks to life, known as the rate of pure time preference; and L is the rate of chances in life chances. This pure time discount rate (p) can be seen as the rate at which individuals discount future utility (Evans, 2006).
The first parameter reflects individuals’ preference for consumption now, rather than at a later period, with an unchanging level of consumption per capita over time. Several economists agree to give d a value of zero, however this would imply that current generations should reduce their levels of consumption drastically, and in some cases, to subsistence levels (Contreras, no date). Literature agrees on a range between 0% - 0.5% for this component of the STPR, thus, a value of 0.25% seems reasonable to
28
use. There is no easy way to know whether d is going up or down across time (OXERA, 2002).
The rate of chances in life chances, also referred as “catastrophe risk”, shows the likelihood that there will be some event so tragic that all returns from projects are eliminated, or at least unpredictably altered. Pearce and Ulph (1999) stress out that the correct understanding of L is related to whole generations, more specifically, the probability of survival to the next period.
When we have an inter-temporal utility function specified over a period of time, it is rational to expect that individuals discount their future utilities on the basis of their survival probability over that time period. Basically, each individual would discount its future utility by the probability of not being alive at that date (Kula, 2004). Catastrophe risk (L) can then be calculated as the average death risk of one individual of the Portuguese population in each one of the years 2005 to 2013. Therefore, in order to determine L, data concerning the number of Portuguese population and the number of deaths were used, between 1970 and 2013, taken out from the OECD website.
Finally, the pure time discount rate was calculated from 2005 to 2013 by the formula:
Equation 3: Pure time preference rate
∑
29
3.1.2. The growth of per capita real consumption,
𝒈
Observations of very long-term runs of per-capita consumption data give better estimation results because it helps reducing problems of using shorter runs of past data (Pearce and Ulph, 1999; OXERA, 2002). Consequently, when estimating g, data concerning private consumption was also taken between 1970 and 2013 from OECD website. Then, to get the average growth of per capita real consumption, consumption per capita was computed for these years simply by using:
Equation 4: Consumption per capita at year t
When calculating the average growth of consumption per capita between 2005 and 2013, the next formula was followed:
Equation 5: Average growth at year t
∑
3.1.3. The elasticity of marginal utility of consumption,
In this subsection, the derivation of this parameter will be explained according to Evans and Sezer (2004). The measurement of this component is based on social values through personal income tax structures and the formal derivation of e takes into account two strong assumptions:
1. Equal absolute sacrifice of satisfaction; and 2. Iso-elastic utility functions.
30
As can be seen from the Appendix, the tax-based value of e is determined by a ratio of logged variables involving effective marginal and average tax rates.
Equation 6: The elasticity of marginal utility of consumption
𝒈 ( ) Where,
t= effective marginal tax rate of income tax T= total income tax liabilities
Y= pre-tax income T/Y= average tax rate
The effective marginal tax rate for Portugal was taken from ec.europa database13 for the years 2005 until 2013. The average tax rate, including both income tax rates and employees’ social security contributions, referred to as “all-in tax rates”, were taken from OECD database also for the years 2005 until 2013.
3.2. Social Opportunity Cost of Capital, ‘SOCC’
This method was based on a paper from Young (2002)that does a very good job in explaining the opportunity cost of capital. There are three different methods that can be used to calculate the SOCC discount rate, however, the one that provides the best estimates is CAPM. The equation can be defined as:
Equation 7: CAPM
13
31
Where is the required return on project i, is the rate of return one can expect on a completely riskless asset in Portugal, is the levered beta, and is the equity market risk premium.
CAPM Assumptions
Three assumptions were required in order to use the CAPM model, namely,
(i) The 10-year Portuguese risk-free rate for the years 2005 until 201314;
(ii) The equity market risk premium (EMRP);
(iii) The equity beta specific to each PPP sector.
Regarding the first assumption, the 10-year government bond rate was taken from Bloomberg Terminal starting from 1999 until the most recent data to give an accurate estimate of the risk-free. Then, each risk-free interest rate was calculated for the years 2005 until 2013 using a simple average of each year.
Likewise, each equity market risk premium (EMRP) for each year was taken from Damodaran database15 as well as the unlevered beta for each industry sector and for each year. Each sector (transport, health, emergency and security) has a specific beta depending on the level of systematic risk it represents. It was assumed that the 22 road contracts and the 2 railway contracts provide the same systematic risk, therefore, they were considered to have the same beta. This unlevered beta for each sector can be converted to equity beta by using the next formula:
Equation 8: Hamada’s formula
[ ( ) ]
Where stands for unlevered beta, was assumed to be the public debt as a percentage of GDP, and T represents the corporate tax rate.16
14
According to the model the appropriate government bond rate is a long-term one. In this situation, the Portuguese 10-year bond rate is the most appropriate rate since it is the longest bond available (Young, 2002)
15
http://people.stern.nyu.edu/adamodar/
32
Furthermore, the cost of equity ( for each PPP sector, between 2005 and 2013, was calculated using the CAPM equation. However, when taking into account that the government does not pay corporate income tax, the formula becomes the following:
Equation 9: CAPM after taxes
[ ( ) ]
Where is the after-tax risk-free rate and ( ) is the after-tax market risk premium.
The appropriate rate of return on debt, the public sector’s cost of debt ( , used in the WACC equation is simply a long-term government bond rate with a debt
premium17 and the alternative use of those funds.
Based on the study provided by Young (2002), the SOCC method states that the discount rate is given by the WACC18 equation, which uses the cost of debt and the cost of equity of each PPP sector calculated by the CAPM formula:
Equation 10: WACC
Where stands for the public sector’s cost of debt, T for corporate tax rate, for cost of equity, represents the weight public debt has on the Portuguese GDP and the corresponding equity structure.
As a final result, each sector will have its own discount rate which will also change from year to year. This is consistent with the CAPM model because it considers the systematic risk of each sector.
17
Assumed 1%