UNIVERSIDADE DE LISBOA
FACULDADE DE CIÊNCIAS
DEPARTAMENTO DE FÍSICA
Study of the Effect of Magnetic Field on PET/MR Systems:
GATE Monte Carlo Simulations
André Rodrigues Diogo
Mestrado Integrado em Engenharia Biomédica e Biofísica
Perfil em Radiações em Diagnóstico e Terapia
Dissertação orientada por:
Prof. Dr. Stefaan Vandenberghe
__________________________________________________________________________________
Acknowledgements
__________________________________________________________________________________
I would like to start by thanking Prof. Stefaan Vandenberghe for giving me the opportunity to be a part of this amazing project and welcoming into the Medical Imaging and Signal Processing research group from Ghent University. I also want to thank the Erasmus+ Program for the opportunity and funding I got for this internship. Thank you to Prof. Nuno Matela for the counselling and having encouraged me to choose Ghent as the place for my thesis.
I want to express all my gratitude towards my mentor throughout this journey, Paulo Caribé. Thank you for always being there to answer my questions, for all the support and guidance and encouraging words, for always believing in me, and, most important, for the friendship.
Thank you also to everyone at Medisip for being so welcoming and nice, since day one. The year would not have been the same without all of you!
Thank you to Marta, Catarina and Tomás, my best buddies, who were always ready to hear me complain about anything and have supported me continuously throughout the last few months, even when we were thousands of kilometers apart.
Thank you to my parents and my sister for always being there, for always encouraging and pushing me, motivating me through these months away from everyone and everything I knew. Nothing would have been possible without your support. To my aunt, grandma and grandparents and all the family who provided me with enough chocolate to give diabetes to at least 50 children.
__________________________________________________________________________________
Abstract
__________________________________________________________________________________ The latest developments in PET technology have allowed for its integration with MR scanners as a superior alternative to PET/CT imaging, especially useful in instances such as detection of low-grade tumours and prostate cancer resurgence. However, the magnetic field inherent to the MR introduces some challenges and uncertainty regarding the scanners’ performance. Furthermore, novel radiopharmaceuticals that feature a wide range of radioisotopes with different properties have been introduced in the market and are being used more and more in clinical contexts. Thus, it is relevant to study how PET/MR systems perform when using such radioisotopes, and the impact the magnetic field has on the performance, as a way to better understand these scanners and optimize clinical practices. Recently, total-body PET scanners that entirely cover the patients, or large portions of the body, have also been introduced.
In this dissertation, NEMA sensitivity and count rate statistics tests are performed on a realistic model of the GE Signa PET/MR scanner through GATE Monte Carlo simulations, using the prescribed
18F, as well as using other radioisotopes such as 11C, 13N, 15O, 68Ga and 82Rb, which feature positron
energies from 633 keV do 3.3 MeV. The same studies are performed on a conceptual 1.04 m long PET scanner to study the potential performance of such a scanner. Also, a study of the positron range of the same radioisotopes in tissues of varying density was done in order to estimate the impact of the magnetic field. On the GE Signa PET/MR, the sensitivity test results are in line with published values and show a clear dependence on the positron branching ratio, with the pure β+ emitters having the highest
sensitivity values, 21.50 cps/kBq for 13N in the presence of a 3 T MR field. The magnetic field increases
sensitivity up to 5% for the higher energy radioisotopes, due to constraints on positron range preventing positron from escaping the phantom tube. The move to TB-PET shows a tremendous increase of up to 7 times the sensitivity, peaking at 177.87 cps/kBq for 13N. Regarding the NECR test, the simulation
results on the GE Signa PET/MR are confirmed by the published values regarding 18F, with the other
pure β+ emitters showing comparable peak NECR values. However, 68Ga and 82Rb have much lower
peak NECR values, due to the 3.0% and 14.2% additional prompt-gamma emission, which contaminate the acquisition and contribute to detector busyness, effectively lowering NECR.
Studies on positron range show strong dependence on the tissue density. The 3 T magnetic field introduces significant constraints on positron range in the transversal plane which can mean up to 4 times smaller range in the x and y directions when compared with the z direction, the direction of the MR field, which shows differences only in terms of density distribution but not absolute values.
The results obtained in this dissertation point out the need to re-evaluate the different image reconstruction algorithms for PET/MR imaging, given the discrepancies between the transversal and axial ranges under a magnetic field, as well as the adaptation of the NEMA performance measurements protocols for scanners with long axial fields of view, and, to some extent, to be performed with different radioisotopes. However, there are some limitations to the conclusions drawn from the work presented, such as the fact that the method used to estimate NECR and the related measures can underestimate them due to uncertainty regarding dead time set-up.
The work developed in this thesis and the achieved outcomes have real world applications in more than one area. Learning how scanners perform under difference circumstances, i.e. using different
radioisotopes, can help clinics better prepare their schedules according to predicted scanning times, optimize activity quantities injected into patients, and overall improve the patient throughput. Furthermore, possible applications in reconstruction algorithms that may improve the quality of the produced imaged and help to diagnose and/or better identify multiple diseases, leading to general improvements in public health through screening programs and early diagnosis.
Keywords: PET/MR; total-body PET; NEMA performance; sensitivity; NECR; positron range; Monte Carlo simulations; GATE
__________________________________________________________________________________
Resumo
__________________________________________________________________________________ Tomografia por emissão de positrões (PET, na sigla em inglês) é uma técnica de imagem de medicina nuclear que tem por base a emissão de positrões e a sua consequente aniquilação com as suas anti-partículas, electrões. Ao acoplar radioisótopos emissores de positrões a moléculas orgânicas, é possível seguir e quantificar diversos processos metabólicos que ocorrem no corpo, fazendo da PET uma técnica de imagem funcional. Sendo uma técnica de imagem funcional, com informação anatómica quase inexistente, a PET é frequentemente aliada a outras técnicas que ofereçam essa informação. Desde o aparecimento de scanners integrados PET/CT no início do século, estes sistemas tornaram-se extremamente populares. No entanto, sistemas integrados PET/MR surgiram no mercado nos últimos anos e têm vindo a ganhar popularidade devido às suas vantagens sobre PET/CT, tais como um contraste entre tecidos moles bastante superior e a eliminação da dose de radiação inerente à CT.
A presença do campo magnético proveniente da MR introduz alguns desafios na porção PET dos sistemas integrados, nomeadamente no impacto do campo no comportamento dos radioisótopos, alterando a trajetória dos positrões emitidos para uma trajetória em hélice como resultado da força de Lorentz. Além disso, os testes NEMA de caracterização do desempenho de scanners PET/MR são apenas realizados com 18F. Dados os avanços em radiofarmacêutica, torna-se relevante e importante o
estudo do desempenho destes scanners quando utilizados diferentes radioisótopos, nomeadamente a realização de testes NEMA.
Com o objetivo de estudar e quantificar tanto o efeito do campo magnético no alcance dos positrões e na performance de scanners integrados PET/MR, como as diferenças na utilização de diferentes radioisótopos, foi construído um modelo realista do scanner GE Signa no qual podem ser realizadas simulações Monte Carlo dos testes NEMA de sensibilidade e NECR usando o toolkit GATE. Foram ainda desenvolvidos os scripts analíticos em Python, ROOT e MATLAB para análise dos resultados dos diferentes testes. A validação das simulações foi feita através da comparação com valores publicados, medidos experimentalmente num scanner GE Signa. Os mesmos testes foram aplicados a um sistema PET de corpo inteiro, com extensão axial de 104 cm, de modo a estudar o potencial desempenho de um sistema com estas características. Além disso, foi ainda estudado o efeito do campo magnético no alcance dos positrões em diferentes tecidos.
O teste de sensibilidade mede a capacidade de um scanner em registar coincidências, sendo medida em contagens por segundo para um determinado nível de atividade (cps/kBq). A simulação deste teste requer a construção do seu respetivo fantoma, que envolve 5 camadas cilíndricas de alumínio com espessura constante, bem como a análise de dados prescrita pela NEMA. Para as simulações realizadas no GE Signa PET/MR sem campo magnético, no caso dos emissores β+ puros 11C, 13N e 15O, os
resultados obtidos foram de 20.53, 20.65 e 20.31 cps/kBq, respetivamente, sendo comparáveis com o de 18F, 20.75 cps/kBq. 68Ga oferece também resultados semelhantes aos teóricos, 18.10 cps/kBq. Todos
estes resultados estão de acordo com o esperado, dado que a fração de emissão de positrões é o fator mais significativo da sensibilidade. Quanto ao 82Rb, os valores obtidos são significativamente mais
baixos que os previstos. Esta diferença pode ser explicada pela alta energia e longo alcance dos positrões provenientes deste decaimento, que têm alta probabilidade de não perderem a sua energia na primeira camada de alumínio, influenciando negativamente a análise de resultados, subestimando o valor real de sensibilidade. Aquando da aplicação do campo magnético de 3 T, as diferenças registadas em relação
aos valores medidos e publicados são mínimas, e os valores simulados são até 5% maiores do que sem a presença do campo magnético, sendo que esta diferença aumenta à medida que aumenta a energia dos positrões. As mesmas conclusões são retiradas das simulações realizadas com o TB-PET. No entanto, os valores neste são significativamente mais elevados, sendo entre 5 a 7 vezes maiores do que os resultados obtidos no GE Signa, chegando a um máximo de 174.27 cps/kBq, já que, no TB-PET, a fonte é completamente coberta pelo scanner enquanto que apenas certa de 1/3 da fonte é coberta pelo GE Signa, deixando grande parte da atividade fora do scanner.
O teste de NECR e estatísticas de contagem tem o objetivo de medir fontes altamente energéticas e reconhecer radiação dispersa, tal como radiação gama adicional. NECR é uma medida que está localmente relacionada com SNR, com a dose de atividade que é necessário administrar aos pacientes para obter imagens, e ainda com a duração dos exames. Usando o fantoma de dispersão (scatter
phantom), e analisando os dados através de sinogramas, é possível obter três taxas de contagem:
coincidências verdadeiras, dispersas e aleatórias, através das quais se calcula o valor do pico de NECR e o nível de atividade a que este ocorre. No GE Signa PET/MR, em a presença do campo magnético, os isótopos 11C, 13N e 15O demonstram resultados de pico de NECR de 206.77, 201.72 e 196.08 kcps,
próximos do valor obtido para 18F, 209.32 kcps, como seria de esperar tendo em conta as semelhanças
das propriedades de decaimento. No 68Ga e 82Rb, estes valores são significativamente mais baixos,
185.70 e 136.93 kcps, respetivamente, sendo notável a clara influência dos fotões gama imediatos nos dois isótopos, com maior expressão no 82Rb. O registo destes fotões contribui significativamente não só
para o aumento do número de coincidências aleatórias registadas, como também para os efeitos do tempo morto do detetor, que leva a uma deterioração da capacidade do detetor de registar os fotões provenientes da aniquilação dos positrões e, consequentemente, registo de coincidências verdadeiras. Os resultados do mesmo teste aplicando um campo de magnético de 3 T, o pico de NECR para todos os isótopos teve um aumento até 8%, mais significativo para os isótopos que emitem positrões com mais alta energia, sendo que no caso do 82Rb, este pico chegou aos 173.50 kcps. Relativamente ao TB-PET, os aumentos
de pico de NECR registaram-se na ordem das 7 a 8 vezes maiores que os valores obtidos no GE Signa. Neste scanner com 104 cm de comprimento, o pico de NECR chega aos 1624.54 kcps aquando da aplicação do campo magnético, efetuando o teste com 18F. Ainda seguindo a tendência registada
anteriormente, 68Ga e 82Rb apresentam resultados muito inferiores aos emissores β+ puros. Neste scanner,
é notável ainda uma maior discrepância entre os diferentes isótopos.
O facto de as diferenças entre a aplicação ou não do campo magnético serem da mesma magnitude nos dois scanners pode sugerir que os efeitos são específicos aos protocolos NEMA e ao teste aplicado, e não se traduzem necessariamente para o contexto clínico e aquisições com pacientes. No entanto, estabelece-se uma relação com os constrangimentos impostos ao alcance dos positrões em ambos os testes. Por um lado, os constrangimentos ao alcance dos positrões no plano transversal à direção do campo magnético são notáveis pelo aumento do número de coincidências registadas nos primeiros cilindros de atenuação de alumínio, efetivamente aumentando o valor final calculado para a sensibilidade, particularmente para isótopos de alta energia. Por outro, os mesmos constrangimentos causam um aumento do número de coincidências detetadas próximas da fonte de radioatividade, o que, no processo de análise de dados, contribui significativamente para o aumento do número de coincidências verdadeiras e, consequentemente, NECR.
O estudo do alcance dos positrões dos diferentes isótopos revela uma redução significativa do alcance tridimensional aquando da aplicação do campo magnético. Esta redução é sentida apenas no plano transversal (direções x e y), sendo que o alcance axial (direção z) se mantém em termos de valores absolutos. A distribuição de densidade dos pontos de aniquilação, ou do alcance axial, no entanto, apresenta-se alongada, devido aos constrangimentos no plano transversal. Além disso, é ainda notável uma forte dependência destes efeitos tanto na energia dos positrões como na densidade do tecido, sendo
que o alcance transversal pode ser até 4 vezes menor que o axial para altas energias, em tecidos pouco densos.
Assim, conclui-se que o uso de diferentes isótopos tem um impacto significativo na performance de sistemas integrados PET/MR, com o campo magnético inerente à RM introduzindo diferenças no comportamento dos isótopos, especificamente constrangimentos no alcance dos positrões no plano transversal. Além de otimização de planos de aquisição de imagens em contexto clínico, os resultados obtidos nesta dissertação podem ser futuramente aplicados em software de reconstrução de imagem, tendo em conta as limitações referidas.
Palavras-chave: PET/MR; GE Signa; testes NEMA; sensibilidade; NECR; alcance dos positrões; simulações Monte Carlo; GATE
__________________________________________________________________________________
Table of Contents
__________________________________________________________________________________ Acknowledgements ... i Abstract ... ii Resumo ... ivTable of Contents ... vii
List of Figures ... ix
List of Tables... xii
List of Abbreviations... xiv
1 Introduction ... 1
2 Biomedical Imaging Systems ... 3
2.1 Positron Emission Tomography (PET) ... 3
2.1.1 Principles of PET Imaging ... 3
2.1.2 Radioisotopes ... 6
2.1.3 Scintillation Detectors ... 8
2.1.4 Interaction of Particles and Matter ... 9
2.2 Magnetic Resonance Imaging (MRI) ... 12
2.3 PET/MR Hybrid systems ... 15
2.3.1 Effect of the Magnetic Field on Positron Range ... 16
2.3.2 Total-Body PET/MR ... 18
3 NEMA Performance Measurements of Positron Emission Tomographs ... 20
3.1 Sensitivity ... 20
3.1 Scatter Fraction, Count Losses, and Randoms Measurement ... 21
3.2 Spatial Resolution ... 21
3.3 Image Quality ... 22
4 GATE Monte Carlo Simulations ... 23
4.1 GATE ... 23
4.1.1 Geometry and Materials ... 24
4.1.2 Physics... 25
4.1.3 Digitizer... 25
5 Methods ... 27 5.1 Scanner Geometry ... 27 5.1.1 GE Signa PET/MR ... 27 5.1.2 Total-Body PET ... 28 5.2 Sensitivity Measurements ... 30 5.2.1 Simulation Set-Up ... 30
5.2.2 Post-processing in ROOT and Excel... 31
5.3 Count Rate Statistics Measurements ... 32
5.3.1 Simulation Set-Up ... 32
5.3.2 Post-processing in ROOT and MATLAB ... 33
5.4 Positron Range ... 38 5.4.1 Simulation Set-Up ... 38 5.4.2 Analysis ... 38 6 Results ... 39 6.1 GE Signa PET/MR ... 39 6.1.1 Sensitivity Measurements ... 39
6.1.2 Count Rate Statistics ... 40
6.2 Total-Body PET/MR ... 41
6.2.1 Sensitivity Measurements ... 41
6.2.2 Count Rate Statistics ... 43
6.3 Positron Range ... 44 7 Discussion ... 47 8 Conclusion ... 50 Thesis Outcomes ... 51 References ... 52 Appendix ... 57
__________________________________________________________________________________
List of Figures
__________________________________________________________________________________
Figure 2.1: Positron-electron annihilation with subsequent emission of 511 keV photons. The positron (e+) travels some distance before interacting with an electron and being annihilated. [20] ... 3
Figure 2.2: Types of coincidences detected in PET imaging. (A) True coincidences. (B) Scattered coincidence. (C) Random coincidence. [21] ... 4
Figure 2.3: Representation of the formation of tomographic imaging sinogram. (A) The position of the source in the scanner. (B) Sinogram of the source, where displacement can be easily understood by the selected LORs and their respective points in the sinogram, represented in blue. [22] ... 5
Figure 2.4: Sinogram in PET acquisitions. (A) Profile of the scanner with 16 detector modules and a LOR. (B) Representation of the LOR in the angle-displacement plane. ... 5
Figure 2.5: Decay scheme of 18F (left); Decay scheme of 68Ga (right). 𝜀 represents transitions by electron capture, 𝛾 represents prompt-gamma emission. Adapted from [31]. ... 6
Figure 2.6: Decay scheme of 11C (left). Decay scheme of 13N (right). 𝜀 represents transitions by
electron capture. Adapted from [31]. ... 7 Figure 2.7: Decay scheme of 15O. (right); Simplified decay scheme of 82Rb (left). 𝜀 represents
transitions by electron capture, 𝛾 represents prompt-gamma emission. Adapted from [31]. ... 8 Figure 2.8: Scheme of the amplification of the light photon into an electronically readable output in a photomultiplier. ... 9
Figure 2.9: Representation of the Rutherford experiment. 1 and 2 represent large deflection angles, and 3 represents a backscattered particle. [40] ... 9
Figure 2.10: Representation of bremsstrahlung. When it is the deflected, the particle loses energy in the form of X-rays (EX), slowing down. ... 10
Figure 2.11: Possible photon interactions with matter. (a) Pair production. (b) Compton scattering. (C) Photoelectric effect. In the case of Compton scattering, the energy of the scattered photon (𝛾’) is smaller than the original photon (𝛾). Adapted from [43]. ... 11
Figure 2.12: Dominance of effects according to photon energy and atomic number of the material. Rayleigh scattering is not represented as it is not significant for PET imaging. [48] ... 12
Figure 2.13: Free atoms with intrinsic spins in random directions (left). Atoms precessing at the Larmor frequency 𝜔 around the magnetic field's (B0) direction (right). Adapted from [49]. ... 13
Figure 2.14: Tipping over of the net magnetization (𝜇)caused by the application of and RF pulse. [50] ... 13
Figure 2.15: Graphical representation of T1 and T2 relaxation. T1 and T2 are constants measured for 90º RF pulses. [51] ... 14
Figure 2.16: Principle of slice selection through the application of a linear magnetic field gradient and a small bandwidth of the RF pulses. [52] ... 14
Figure 2.17: PET detectors coupled via fiber optics. [56] ... 16
Figure 2.18: Helical path of positrons subject to a magnetic field. [61]... 17
Figure 2.19: PET/MR images of a point source (left) and brain phantom (right) filled with different emitters at different magnetic field strengths. [14] ... 17
Figure 2.20: Shine through artefacts on PET/MR images at 20º (top) and 35º (bottom) angles. [15] ... 18
Figure 3.1: Left: Plastic tube (center) with surrounding aluminum cylinders. Right: Phantom holder. [67] ... 21
Figure 3.2: Scatter phantom. [67] ... 21
Figure 3.3: Spatial resolution phantom holder (left); Location of sources (right). [67] ... 22
Figure 3.4: body phantom (left); phantom setup on the scanner bed (right). ... 22
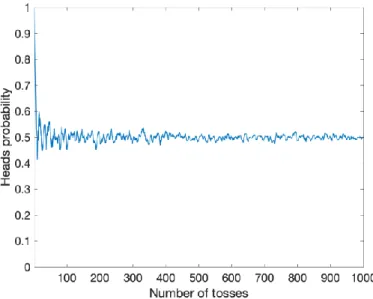
Figure 4.1: Probability of outcome being "Heads" when a coin is tossed a number of times. The greater the number of tosses (experiments), the closer the probability gets to 0.5. ... 23
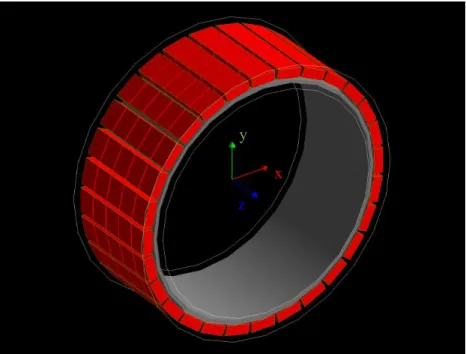
Figure 4.2: CylindricalPET in GATE. Pink: scanner cylinder; Yellow: rsector; Blue: module; Green: Submodule; Red: Crystal. Layer level not shown. [72] ... 24
Figure 4.3: Illustration of the coincidence window principle. The event recorded in Detector 2, although considered a coincidence, can still be true, random or scattered event... 25
Figure 5.1: Modelled GE Signa PET/MR geometry. CylindricalPET outline in white; rsector outlined in green; detector block and crystal represented in red; 12 attenuation layers represented in gray. For scale, the axis length is 10 cm is all directions. ... 28
Figure 5.2: Modelled TB-PET geometry. CylindricalPET outline in white; rsector outlined in green; plastic layer represented in green; PCB outlined in yellow; monolithic crystals represented in red. For scale, the axis length is 10cm in all directions. ... 29
Figure 5.3: Scheme of NEMA sensitivity phantoms modelled in GATE (right); Photography of real NEMA Sensitivity phantom (left). ... 30
Figure 5.4: Portion of the C++ script responsible for the sorting out between true, scattered and random coincidences. Complete script is found in Appendix 1... 31
Figure 5.5: Extrapolation of the attenuation-free sensitivity value via exponential regression for simulations at the center of the FOV (blue) and with a 10 cm radial offset (orange). ... 32
Figure 5.6: Scheme of the NEMA Scatter phantom labeled with dimensions used for its modelling in GATE. ... 32
Figure 5.7: Portion of code that extracts ROOT's sinogram data. This line of code is looped over each entry in the “Coincidences” tree. The complete script can be found in Appendix 2. ... 33
Figure 5.8: Sinogram of coincidences as extracted from ROOT. The dark line on the image represents the line source and is curved due to its positioning being 45 mm below the center of the FOV. ... 34
Figure 5.9: Sinogram after applying Gaussian filter and setting all pixels farther than 12 cm from the center of the FOV to zero ... 35
Figure 5.10: Sinogram after alignment according to the maximum values for each projection angle. ... 35
Figure 5.11: Sum projections of the sinograms. The peak on the total coincidences projection (left) originate from the line source - as expected, most coincidences come from there. ... 36
Figure 5.12: 40 mm wide strip of the total coincidence's sum projection. ... 36 Figure 5.13: Graphical representation of NEMA procedure for calculation of background (random and scatter) counts, represented in the image in grey. ... 37
Figure 6.1: Axial sensitivity profile of the GE Signa PET/MR using 18F. The histogram only
extends as far as the length of the scanner. ... 40 Figure 6.2: Axial sensitivity profile of the GE Signa PET/MR using 82Rb. In addition to a lower
peak, the histogram extends all throughout the source, with coincidences noticeably situated outside of the scanner bore... 40
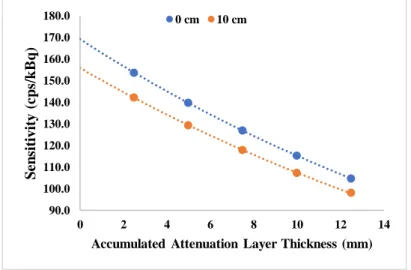
Figure 6.3: Sensitivity data plotted against the accumulated attenuation layer thickness and exponential regression of data from 18F and 82Rb, without the presence of a MR field. Fitted equation
and coefficient of determination for both radioisotopes are presented for simulations at the center of the FOV (0 cm, blue) and for 10 cm radially off center (10 cm, orange). ... 40
Figure 6.4: Axial sensitivity profile of the TB-PET for a 70 cm long phantom, using 18F. As the
source is completely covered by the scanner bore, coincidences are detected all throughout the source and the histogram cuts off where the source ends... 42
Figure 6.5: Axial sensitivity profile of the TB-PET for a 100 cm long phantom, using 18F. As the
source is completely covered by the scanner bore, coincidences are detected all throughout the source and the histogram cuts off where the source ends. The sensitivity decreases as the distance from the center of the scanner increases. ... 42
Figure 6.6: Axial sensitivity profile of the TB-PET for a 120 cm long phantom, using 18F.
Coincidences are detected all throughout the AFOV. The sensitivity decreases as the distance from the center of the scanner increases. ... 43
Figure 6.7: Transversal (top) and longitudinal (bottom) distributions of a point source in lung tissue with and without a 3 T magnetic field along the z direction... 46
__________________________________________________________________________________
List of Tables
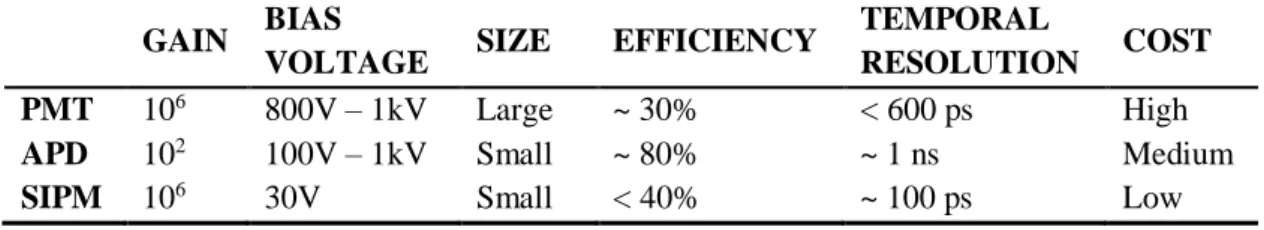
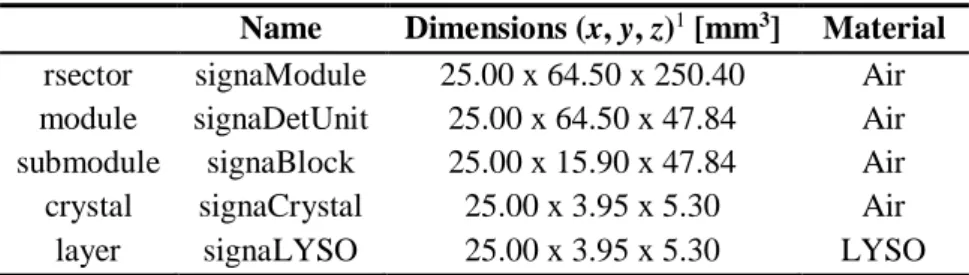
__________________________________________________________________________________ Table 2.1: Comparison of different types of photodetectors used in PET/MR systems. ... 16 Table 5.1: GE Signa PET/MR geometry hierarchy, dimensions and materials... 27 Table 5.2: TB PET/MR geometry hierarchy, dimensions and materials. ... 28 Table 5.3: Composition of the LYSO materials used for the GE Signa and TB-PET GATE models. ... 29 Table 5.4: Composition of the printed circuit board used in the TB-PET geometry, which has a density of 1.85 g/cm3... 29
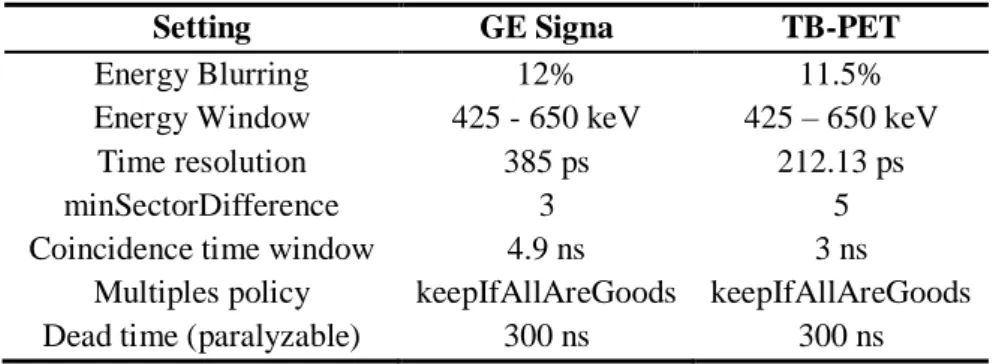
Table 5.5: Digitizer settings for the GE Signa PET/MR and the TB-PET scanner. ... Error! Bookmark not defined.
Table 5.6: Activity levels of each radioisotope for NEMA Sensitivity simulations. ... 30 Table 5.7: Phantom materials for the study of positron range. ... 38 Table 6.1: Simulated results for the GE Signa PET/MR with and without the presence of a magnetic field. The theoretical values are based on the sensitivity value of 22.5 cps/kBq for 18F, provided
by GE Healthcare, [81] taking into account each radioisotope’s total positron branching ratio. ... 39 Table 6.2: Results of the simulated count rate statistics test for the GE Signa PET/MR without a MR field. ... 41
Table 6.3: Simulated results for the count rate statistics tests for the GE Signa PET/MR in the presence of a 3 T MR field. ... 41
Table 6.4: Simulated sensitivity in the TB-PET to an 18F source for different phantom lengths
while maintaining the activity concentration in the tube source, with and without the presence of the 3 T MR field. ... 42
Table 6.5: Simulated TB-PET sensitivity for different radioisotopes with and without the presence of a 3 T MR field, using a 70 cm long phantom. ... 43
Table 6.6: Simulated results of the count rate statistics test for TB-PET without a magnetic field (0 T), using phantoms of 70 cm, 100 cm, 120 cm, and 140 cm lengths. ... 43
Table 6.7: Simulated results of the count rate statistics test for TB-PET with a magnetic field (3 T), using phantoms of 70 cm, 100 cm, 120 cm, and 140 cm lengths... 44
Table 6.8: Simulated results of the count rate statistics test for TB-PET without a magnetic field (0 T), using a 70 cm length phantom. ... Error! Bookmark not defined.
Table 6.9: Simulated results of the count rate statistics test for TB-PET with a magnetic field (3 T), using a 70 cm length phantom. ... 44
Table 6.10: Mean 3D positron range in different tissues, for different radioisotopes with and without the presence of a 3 T magnetic field. ... 45
Table 6.11: Mean tranversal (x or y directions) range in different tissues, for different radioisotopes with and without the presence of a 3 T magnetic field. ... 45
Table 6.12: Mean axial (z direction) range in different tissues, for different radioisotopes with and without the presence of a 3 T magnetic field. ... Error! Bookmark not defined.
__________________________________________________________________________________
List of Abbreviations
__________________________________________________________________________________
AFOV Axial Field of View
cps Counts per second
CT Computed Tomography
FBP Filtered Back Projection
FOV Field of View
FWHM Full Width at Half Maximum FWTM Full Width at Tenth Maximum
GATE Geant4 Application for Tomographic Emission
keV Kilo-electronvolt
LOR Line of Response
LYSO Lutetium Yttrium Orthosilicate
MeV Mega-electronvolt
MRI Magnetic Resonance Imaging
NECR Noise Equivalent Count Rate
PET Positron Emission Tomography
PMT Photomultiplier Tube
SNR Signal-to-noise Ration
SPECT Single-photon Emission Computed Tomography
TOF Time of Flight
________________________________________________________________________________
1 Introduction
__________________________________________________________________________________
Over the last century, scientific research has paved the way to the invention and application in medicine of Positron Emission Tomography (PET). Since Dirac’s prediction of the positron back in 1929, [1] developments in quantum physics, electronics and biochemistry [2] led the group of Michael Phelps and Michel Ter-Pogossian to build the first prototype of a PET system, called Positron Emission Transaxial Tomograph (PETT), [3] based on Kuhl and Edwards’ concept of image reconstruction of source distributions. [4] With the introduction of radiopharmaceuticals in the 1970s, particularly the development of 18F-fluorodeoxyglucose (FDG), [5], [6] the technology claimed the attention of the
medical community, which allowed for the study of specific metabolic pathways, making PET a functional imaging technique using widely in clinical routine.
Since those days, PET systems have seen an incremental upgrade in their performance and designs, as well as the development of better, more sophisticated models of image reconstruction, among other improvements. Radiopharmaceuticals have also been intensively studied, there being dozens of commercially available variations nowadays. Although it has many applications, this technology is mainly used in cancer diagnosis and staging, as the abnormal cellular growth and intense metabolic needs lead to high uptakes of glucose – which is easily labeled with radioisotopes.
In the last two decades, efforts in advancing the PET technology further have been focused on combining this functional technique with other anatomical techniques, such as computed tomography (CT) and magnetic resonance imaging (MRI). PET/CT was introduced in the late 1990s and has since become extremely popular amongst the medical community. [7] There are many advantages to combining PET scanners with MRI instead of CT. For instance, MRI offers a superior soft tissue contrast when compared to CT, as well a broader range of sequences specific to different body structures, which can have a big impact on diagnosis. Furthermore, radiation dose received by the patient is significantly reduced due to the elimination of the CT, and there is an improvement of PET image quality (resolution, contrast) in the transaxial direction when the exam is performed under strong static magnetic fields, due to the constraint to the positron range. [8] Since the proposal of this effect, in 1986, several studies have been carried out in order to find out how the magnetic field impacts positron range on multiple radiotracers, both experiments and computer simulations. [9]–[16] Despite the advantages, there were many challenges to the integration of MRI with PET systems, such as the PET detector technology, and PET/CT remains the standard for clinical practice, while PET/MR is more commonly used for research. Also, unlike the CT, the MR doesn’t provide attenuation coefficients that are fundamental for radiotherapy planning.
Recently, the development of PET scanners took a new turn with the appearance the EXPLORER PET, a PET scanner with an axial field of view (AFOV) of 2 meters. [17], [18] This state-of-the-art scanner comes as a solution to the vast amounts of information left out of conventional scanners, which have AFOVs of only 20 to 25cm.
Through Monte Carlo simulations, this dissertation aims to study how the magnetic field inherent to MRI impacts positron range of a wide variety of commercially available radioisotopes, the changes in performance of the PET portion of hybrid PET/MR scanners, and, finally, study and estimate performance of a conceptual total-body PET/MR system, based on the total-body PET system currently
being developed at MEDISIP research group, which aims to be the European version of the EXPLORER.
In Chapter 2 of this dissertation, an overview of PET and MR imaging principles are presented, divided into three sections. The advantages, disadvantages and challenges of PET/MR imaging and fully integrated systems are also discussed. In Chapter 3, the NEMA protocols for evaluation of PET/MR systems’ performance are described. Chapter 4 comprises an introduction of Monte Carlo simulations and GATE, the software used in this dissertation to perform all the simulations needed. In Chapter 5, the methods for building scanner geometries, test set-up and data analysis are described. In Chapter 6, the results obtained from all the simulations are presented, and in Chapter 7 they are analyzed and discussed, and limitations of the work are mentioned. In Chapter 8, the overall conclusions of this dissertation are presented, and future work is discussed. Finally, in Chapter 9, the outcomes from this work are listed.
__________________________________________________________________________________
2 Biomedical Imaging Systems
__________________________________________________________________________________ This chapter comprises an introduction to the imaging systems relevant to this dissertation, positron emission tomography (PET) and magnetic resonance imaging (MRI). Regarding PET imaging, several aspects, such as basic physics, commonly used radioisotopes and instrumentation, will be discussed. On MR imaging, the basic physics will be discussed. Finally, the challenges, advantages and disadvantages of the integration of both modalities on integrated PET/MR systems are described.
2.1 Positron Emission Tomography (PET)
PET is a nuclear imaging technique extremely useful in the measurement and imaging of metabolic activity inside the body. It requires radiotracers containing positron-emitting radioisotopes, such as the ones mentioned below, in Section 2.1.2. Although it can be used multiple fields, such as cardiology and neurology, clinically, this technique is mainly used in oncology, for cancer diagnosis, therapy follow-up, and staging. It has proven a very useful technique in pharmacokinectics to trace biodistribution of new drugs in pre-clinical stages.
2.1.1 Principles of PET Imaging
As the name of the technique suggests, PET relies on the emission of positrons by radioisotopes. Positron emission (𝛽+ decay) is a type of radioactive decay that occurs when there is a destabilizing
surplus of positive charge and energy in the nucleus. In order to become more stable, a proton is converted into a neutron, while simultaneously releasing a positron and a neutrino Equation (2.1). [19]
𝑝 → 𝑛 + 𝑒++ 𝜈 (2.1)
After the positron is emitted, it will interact with the matter around it, more specifically with the electrons present in it. When a positron collides with an electron, they will annihilate each other, emitting a pair of gamma photons of 511 keV energy each (mec2 = 511 keV), travelling in opposite directions
(180 degrees) until they reach the detector crystals (Figure 2.1). As electrons are abundant in tissues, PET imaging relies on the assurance that the annihilation will take place within a few millimeters from the emission site, allowing for the localization of lesions or process under study. This is dependent on the energy of the positron, which varies from radioisotope to radioisotope.
Figure 2.1: Positron-electron annihilation with subsequent emission of 511 keV photons. The positron (e+) travels some
When two photons are caught in the detectors within a certain time window, they are associated with each other and form a coincidence. Each coincidence has its own line of response (LOR), a straight line that connects the two detector blocks, along which the coincidence will have taken place. Although a good approximation in most cases, the localization of the exact site of emission is affected by the emission angle of the photons. The 180º degree mentioned before is an ideal case. In reality, when the linear momentum of both the positron and the electron are not null, there is a slight change in this emission angle (non-collinearity), which will then lead to an incorrectly placed LOR and a misplacement of the annihilation. In addition to non-collinearity, the photons often suffer scattering due to the interaction with the surrounding tissues, completely changing direction. In practical terms, it is not possible to distinguish between coincidences coming from scattered photons of from non-collinear annihilations and in the scope of this work are simply referred to as scattered coincidences. Furthermore, detectors may register hits from simultaneous annihilations from different emissions, or even be absorbed by them via photoelectric effect (discussed below), which will lead to the detection of random coincidences. The different types of detected PET coincidences are represented in Figure 2.2.
Figure 2.2: Types of coincidences detected in PET imaging. (A) True coincidences. (B) Scattered coincidence. (C) Random
coincidence. [21]
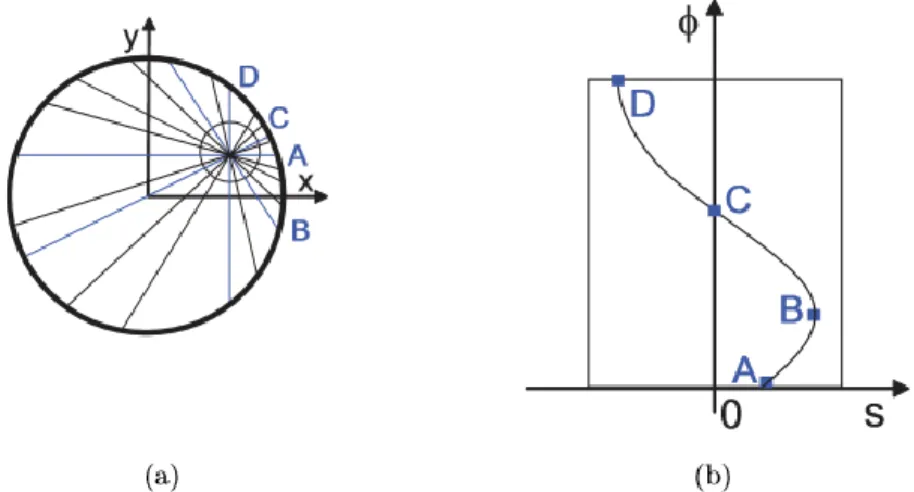
Each LOR is defined by two properties: the angle between itself and the horizon, and the perpendicular distance to the center of the scanner, referred to as displacement. When plotting each LOR’s two characteristics in a two-dimensional plane, each coincidence is simply a point. The visual representation of every coincidence (thus, every LOR) is a sinogram – the most traditional way of data representation in tomographic imaging. Typically, sinograms take the shape of vertical sine functions, as shown in Figure 2.3.
Figure 2.3: Representation of the formation of tomographic imaging sinogram. (A) The position of the source in the scanner.
(B) Sinogram of the source, where displacement can be easily understood by the selected LORs and their respective points in the sinogram, represented in blue. [22]
In the case of PET systems, instead of calculating the displacement and angle to the horizon of each LOR, a simpler approach is illustrated in Figure 2.4. As each LOR is associated with 2 detector blocks, striking a line diagonally across the plane for each of the detectors, will yield an intersection that corresponds to the point in the angle-displacement plane representing the coincidence.
Figure 2.4: Sinogram in PET acquisitions. (A) Profile of the scanner with 16 detector modules and a LOR. (B)
Representation of the LOR in the angle-displacement plane.
The data contained in sinograms is used to reconstruct PET images. Multiple image reconstruction algorithms have been developed and were categorized as either analytical or iterative. Analytical algorithms are faster, linear and deterministic. Filtered back-projection (FBP) is the most commonly used analytical method of PET image reconstruction. It is of quite simple and straightforward implementation. The main drawbacks come from the assumption that data is noise-free and don’t take into account other degrading factors, such as positron range and noncollinearity. [23]
Iterative methods are more complex methods that rely on statistical estimations of noise and physical effects to estimate images. They are more complex and require more computational power than analytical methods. Instead of a direct solution, the reconstruction improves with each iteration, following certain criteria, until a desired image is reached. Several iterative methods have been developed. The most noteworthy are Maximum Likelihood Expectation Maximization (ML-EM), and its Ordered Subsets Expectation Maximization (OSEM). Main drawback of MLEM is its slow
convergence, while for OSEM is the fact that convergence to the ML solution is not guaranteed. In both cases, the noise is increased with each iteration and requires the images to be smoothed afterwards. [24] No image reconstruction was performed in the scope of this project and the details of the algorithms will not be discussed.
2.1.2 Radioisotopes
PET imaging is based on the annihilation of positron emitted by radionuclides. Although there are hundreds of radionuclides, only a select few of them are positron emitters, with varying properties such as energy or decay mode. Most positron emitter radioisotopes are cyclotron-produced. Before being suitable for the use in medicine, radioisotopes must be attached to an organic molecule or compound to form a radiopharmaceutical, or radiotracer, so that the radioisotopes can be carried to the target place of the examination, through metabolism of the organic molecule. The study of radiotracers is out of the scope of this study, which focus solely on radioisotopes.
The most commonly used radioisotope in PET imaging is fluorine-18 (18F), which has been
discovered and intensely studied over half a century ago. [25], [26] Its properties such as half-life, decay scheme and decay energy make it an extremely useful radioisotope for PET imaging, having applications in oncology, neurology, cardiology, and in imaging of organs and structures such as liver or bones (scintigraphy). Due to its low positron energy and short travel distance before annihilation, 18F provides
one of the best performances in PET system. 18F has an half-life of 109.7 minutes and decays into stable 18O via β+ emission with a probability of over 96% with an energy of 0.633 MeV (Figure 2.5). The
average estimated positron range for this radioisotope ranges from 0.56 mm in water/soft tissue to 2.23 mm in the lung [12]. The production of 18F is done with either cyclotrons or linear particle accelerators
through bombardment of pure or 18O-enriched water. [27]
Another well-known but less used radioisotope in PET imaging is Gallium-68 (68Ga). It has a
more complex decay than 18F, having multiple and more energetic positron emission branches, with the
total ratio being 88.88% and maximum energy being 1.899 MeV, although a shorter half-life of 67.7 minutes. There are also transitions to an excited state that will promptly, or within a few picoseconds, emit gamma photons, with a combined probability of 3% (prompt gammas) (Figure 2.5). The 68Ga
positron range is estimated to be 2.62 mm in water and 9.94 mm in the lungs. [12] Although a former go-to radioisotope for cancer staging, specially of neuroendocrine tumors, its use nowadays is essentially related to infectious processes and chronic infections. [28] It’s also much cheaper to produce and operate as it does not require a cyclotron, making it relevant from an economical point of view. 68Ga is obtained
from its parent radioisotope, Germanium-68, via Ge-68/Ga-68 Generators. However, current generator technology is not optimal for medical purposes. It offers low concentrations of 68Ga and high probability
of contamination with 68Ge and metal ion impurities, [29], [30] which can prevent radiotracer labelling.
Figure 2.5: Decay scheme of 18F (left); Decay scheme of 68Ga (right). 𝜀 represents transitions by electron capture, 𝛾
Carbon-11 (11C) has been shown to be useful in PET imaging of prostate cancer, and other
low-grade tumors, as an alternative to 18F, [32] due to the latter’s nonspecificity and the hypometabolic
behavior of some tumors. It decays via positron emission with a branching ratio of 99.75% and an energy of 0.960 MeV, with a short half-life of just 20.4 minutes (Figure 2.6). [32] The short half-life has limited this radioisotope’s use in clinical settings. It is produced in cyclotrons from its parent radioisotope, nitrogen-14. [27] The mean positron range has been measured to be 1.03 mm in soft tissue and 3.98 mm in the lung. [12]
Nitrogen-13 (13N) is one of the earliest discovered positron emitters, being discovered by Joliot
and Curie, part of a research effort that awarded them the Nobel prize in Chemistry in 1935. 13N is a
short-lived radioisotope with a half-life of 9.97 minutes, a clear drawback for widespread use. It’s considered to be a pure positron emitter as the branching ratio for the emission is almost 100% (Figure 2.6). It has relatively high positron emission energy of 1.198 MeV and a mean positron range of 5.4 mm in water. Generally produced in multi-giga-becquerel cyclotrons via the 16O(p,𝛼)-13N reaction, it is of
quite limited use in clinical imaging. [33] Still, it is especially relevant in the cardiological field, particularly quantification of myocardial and coronary blood flow. [34], [35]
Figure 2.6: Decay scheme of 11C (left). Decay scheme of 13N (right). 𝜀 represents transitions by electron capture. Adapted
from [31].
Oxygen-15 (15O) is an radioisotope with a very short half-life of just 2.1 minutes that is originated
from 16O in cyclotrons. Such a small half-life and the only means of production being via cyclotron
meant great limitations for its usability, which led early researchers to dismiss it as a radiotracer for PET imaging. With the necessary resources, 15O proved to be very useful for the diagnosis and study of
cardiovascular diseases (e.g. coronary artery disease), as well as brain imaging (in vivo regional measurement of blood flow and volume). The positron branching ratio of 99,89% and the transition energy of 1.735 MeV (Figure 2.7) give the positrons originated from this radioisotope a mean range of 2.44 mm in soft tissue and 9.26 mm in the lungs. [12]
Rubidium-82 (82Rb) is a very high energy radioisotope nowadays commonly used for myocardial
perfusion imaging and diagnosis of myocardial ischemia or coronary artery disease. It’s decay scheme (simplified in Figure 2.7) is a very complex one, with dozens of possible transitions between states. About 12 of them are β+, of which the highest energy comes at 3.381 MeV with a branching ratio of
81,81%. In total, the positron emission probability is over 95%. [31] Additionally, there is a prompt-gamma emission with a combined ratio of 14.16%. [36] The positron range has been estimated to be 5.21 mm in water and 19.80 mm in the lung. [12] Although the production of 82Rb is relatively simple
and fast (in 10 minutes it is possible to produce enough quantity for 10-15 exams), done through Rb-82/Sr-82 generators, it has a very high cost which might not be sustainable in all hospitals or research centers. [37]
a )
Figure 2.7: Decay scheme of 15O. (right); Simplified decay scheme of 82Rb (left). 𝜀 represents transitions by electron capture,
𝛾 represents prompt-gamma emission. Adapted from [31].
The need for cyclotron-based production of radioisotopes is a very limiting factor of PET imaging. Many times, radioisotopes are bought from third-party suppliers which already have methods of transportation with the necessary security measures in place. Still, transportation times and efficiency might prove very difficult or even impossible to more remote locations, especially for radioisotopes with very short half-lives. Fast transport by helicopter or plane is sometimes necessary (or preferable) but is not always available and its costs are unsustainable for many hospitals, universities and research centers. Although air transportation is the fastest way, there are still two stages of ground couriers (production site to origin airport, destination airport to PET facility), as well as security measures at the airport which can take up to two hours. For instance, for a 2h flight, the total shipping time will be over 5h, depending on the distance to the respective airports, which represents many half-lives of the radioisotopes (over 3 half-lives for 18F) and implies the production of several times the needed activity, driving up the costs
greatly. Even in cases where all these conditions are met, there is still a need for extensive planning and patient preparation, in order to avoid the cancellation of exams and wasting of money, time, and overall resources. [38]
Furthermore, due to the radioactivity, the transport needs to be regulated and controlled as to not expose bystanders to high levels of radiation and radioisotopes need to be transported in safe containers, by trained professionals who know how to properly handle and care for sensitive, perishable, hazardous materials.
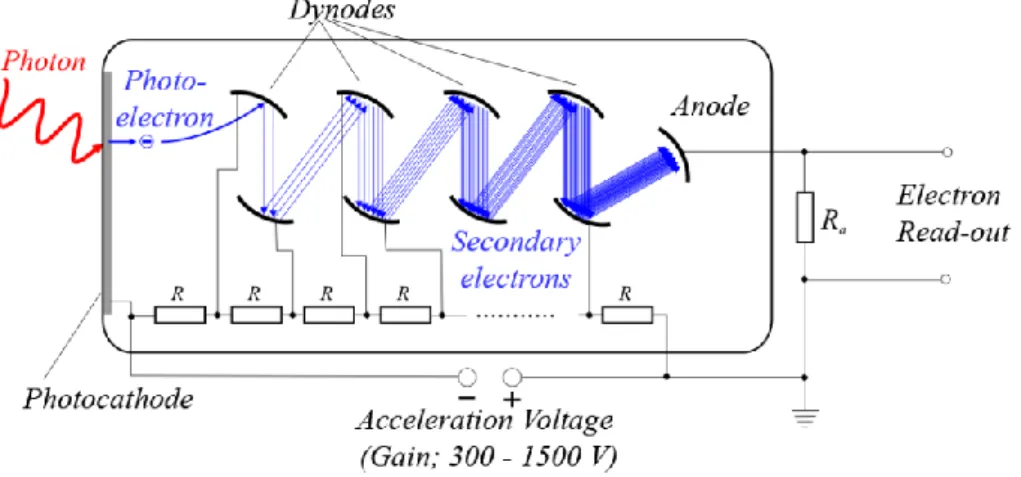
2.1.3 Scintillation Detectors
PET imaging traditionally uses scintillating material coupled to photomultiplier tubes (PMT) for the detection of gamma photons emitted by the positron annihilation. This process comprises conversion of the 511 keV photons into visible light through interaction with the material, which can be divided in three main steps. At first instance, the photon interacts via Compton scattering or photoelectric absorption, creating a free electron in the material. As this electron travels through the material, it excites other electrons, losing its own energy. When the excited electrons lose their energy and go back to the ground state, they emit visible light photons (in some cases, ultraviolet photons are also emitted), which will be caught by the photocathodes of the PMTs. [39]
The efficiency of the crystals depends on the material’s properties. A high light yield should be ensured, which is generally done by taking into account the material’s effective atomic number (Zeff),
density and refraction index close to that of glass, to minimize losses between the crystal and the detector. Moreover, short rise and decay times are preferable as to improve the temporal resolution of the detectors. Lutetium Yttrium Oxyorthosilicate (LYSO) is one of the most used materials in PET systems, alongside Bismute Germanate (BGO) and Sodium Iodide (NaI).
c )
The use of PMTs is important in PET for the amplification of the light signal originated in the scintillator into an electronically readable signal. As the photons emitted by the crystal hit the PMT’s photocathode, electrons are released and go through a series of dynodes where they will be multiplied via secondary emission until they reach the anode, where the signal is read-out. This process is illustrated in Figure 2.8. PMTs offer excellent gain and a high signal-to-noise ratio (SNR)
Over the last few years, other types of detectors for PET imaging have been tested and used commercially. Avalanche photodiodes (APD) and silicon photomultipliers (SiPM) are the two most popular alternatives to PMTs, both offering their respective advantages and drawbacks. This will be explored further ahead in this work.
Figure 2.8: Scheme of the amplification of the light photon into an electronically readable output in a photomultiplier.
2.1.4 Interaction of Particles and Matter
When emitted by radionuclides, positrons are subject to a series of possible interactions with the atoms of the surrounding matter, annihilation being just one of them.
Elastic scattering, or Rutherford scattering, refers to the process where charged particles, such as positrons, are deflected by an atom’s electromagnetic field created by the Coulomb potential, without any loss of energy. The positrons can be largely deflected or even backscattered while the atom remains unaffected. These interactions were first described by Rutherford, in an experiment represented in Figure 2.9.
Figure 2.9: Representation of the Rutherford experiment. 1 and 2 represent large deflection angles, and 3 represents a
backscattered particle. [40]
2 1
An inelastic scatter process takes place when the charged particle loses energy while interacting with the matter. This is the case in ionization and excitation of the atoms, by transfer of energy from the charged particles to the bound electrons, which will move further away from the nucleus to more energetic orbitals (excitation) or be ejected from it (ionization) if the energy of the particle is high enough. The transfer of energy determines the collision stopping power of particles. [41]
Bremsstrahlung, from the German “braking radiation”, is a type of radiation originated when charged particles are abruptly slowed down and deflected by a close-by electrical field from an atom. Through conservation of energy, the loss in kinetic energy by the particle is converted into a photon, in this case an X-ray (Figure 2.10). Because there is loss of energy, this effect is relevant to the stopping power, specifically it’s radiative term.
Stopping power includes both the terms described above, collision and radiative stopping powers, also commonly referred to as hard and soft collision stopping power. Although it depends on many factors, such as the properties of the stopping medium and particle energy, [42] broadly speaking, it can be written that: (𝑑𝐸𝑑𝑙 ) 𝑟𝑎𝑑 (𝑑𝐸𝑑𝑙 ) 𝑐𝑜𝑙 ∝ 𝐸𝑍 (2.2)
Figure 2.10: Representation of bremsstrahlung. When it is the deflected, the particle loses energy in the form of X-rays (EX),
slowing down.
As matter and its anti-matter cannot exist simultaneously, and positrons are the anti-particles of electrons, they cannot coexist. The laws of physics allow for a very limited number of possibilities for the outcome of a collision between these two particles. The creation of a pair of 511 keV gamma photons is the most probable result, given the conservation of linear and angular momentum, energy and electric charge. Generally, it is assumed that the photons are emitted in exactly opposite directions (180º). As described before (Figure 2.1) this is the fundamental principle for PET imaging. However, when the net linear momentum of the pair is not null, the angle of emission is slightly altered.
After annihilation, photons are also susceptible to multiple kinds of interactions before reaching the detector, and even inside the detector, such as pair production, Compton and Rayleigh scattering, and absorption via the photoelectric effect. These interactions were represented in Figure 2.11.
Figure 2.11: Possible photon interactions with matter. (a) Pair production. (b) Compton scattering. (C) Photoelectric effect.
In the case of Compton scattering, the energy of the scattered photon (𝛾’) is smaller than the original photon (𝛾). Adapted from [43].
Pair production is a process where a pair of electron/positron is created from the interaction of a photon with an electromagnetic field (Figure 2.11(a)). Thus, due to the need of an external field and the conservation of momentum and energy, this process can only take place when in the presence of a third-party – usually an atomic nucleus. [44] Following Einstein’s formula, this process can only take place when the energy of the photon is bigger than that of the electron-positron pair. As the positron is the electron’s anti-particle, they have the same mass and thus the energy of the pair will be 2𝑚𝑒𝑐2= 1.022
MeV. Pair production becomes especially relevant at high energies and in the presence of heavy nuclei, as its probability, or cross-section, is dependent on the energy of the photons and the atom’s atomic number, according to Equation 2.3. [43]
𝜎𝑝𝑎𝑖𝑟 ∝ 𝑍2ln(𝐸
𝛾) (2.3)
A variation of this process is internal pair production, where the electromagnetic field inherent to the nucleus, with an excess energy higher than 1.022 MeV, induces the ejection of an electron-positron pair without the intervention of an external photon. [45]
Compton scattering, also commonly referred to as inelastic scattering, comprises alteration of the energy, direction and wavelength of a photon that interacts with a weakly bound electron from the outer orbitals of atoms (Figure 2.11(b)). The decrease in energy, which is transferred from the photon to the electron, called recoil electron, results in an increase in the photon’s wavelength as described by the Compton formula, derived by Compton in 1992:
∆𝜆 = 𝜆′− 𝜆 = ℎ
𝑚𝑒𝑐(1 − cos θ) (2.4)
As such, the energy of the scattered photon depends on the scattering angle (θ) [46]. At high energies, the scatter angle tends to zero, meaning the scattered photon will barely be deviated from its original path and will behave like there was no scattering. Compton scatter does not depend on any property of the absorbing material. [47]
Rayleigh scattering, or coherent scattering, is only relevant for low energy photons (<< 50 keV) and is a type of elastic collision, meaning the scattered photon has the same energy as the incident photon. This interaction occurs between photon and atoms in their entirety, as opposed to interaction with electrons. Rayleigh scattering shows a strong dependence on the photon’s wavelength:
𝜎𝑅𝑎𝑦𝑙𝑒𝑖𝑔ℎ ∝ 1
Rayleigh scattering is never the dominant process in interaction of photons with matter and is of little to no importance in nuclear medicine and, particularly, PET imaging.
The photoelectric effect is a type of interaction described by the total absorption of a photon’s energy by an atom. When the energy of the photon (E0) is equal to the binding energy of the electron
shell (KB), a photoelectron is ejected. When the energy of the photon is higher, the surplus is converted
into kinetic energy of the photoelectron (Kpe).
𝐸𝑝𝑒= 𝐸0− 𝐾𝐵 (2.6)
The ejection of the electron creates a vacant spot in the orbital which will be filled by an outer orbital electron. When the outer electron moves from one orbital to the other, there is an emission of characteristic X-rays, also referred to as Auger electrons, with an energy of only a few keV that corresponds to the difference of energy between the orbitals. [47] Contrary to Compton scatter, the photoelectric effect shows dependence on the material, as well as on the energy of the photon:
𝜎𝑃𝐸 ∝𝑍2
𝐸𝛾3 (2.7)
The dominance of each type of interaction is dependent on both the atomic number of the interacting material and the energy of the photon, as shown in Figure 2.12.
Figure 2.12: Dominance of effects according to photon energy and atomic number of the material. Rayleigh scattering is not
represented as it is not significant for PET imaging. [48]
2.2 Magnetic Resonance Imaging (MRI)
Magnetic Resonance Imaging (MRI) is one of the most advanced, complex and versatile imaging techniques there is nowadays. It allows for both metabolic and anatomic information of the body, with great soft tissue sensitivity and contrast, without the use of ionizing radiation. In addition, it is a 3D technique that allows for the simultaneous imaging of multiple planes of the body, eliminating the need for translation of the patient inside the scanner.
MRI is based on the phenomenon of nuclear magnetic resonance (NMR). When an atom’s nucleus is composed of an odd number of protons or neutrons, it will exhibit a property known as spin, which, for simplicity, can be thought of as the rotation of the nucleus. As it is positively charged, the rotation will induce a small magnetic field around itself. Left undisturbed, the tissue’s nuclei will be oriented in random directions, cancelling out any collective magnetic effect. However, when subject to a stronger, external magnetic field, B0, the axis around which the nucleus rotates will tend to align with the direction
of B0, never fully reaching it and continuously precessing around that axis, in a parallel or anti-parallel
direction, with a frequency 𝜔 called the Larmor frequency ( Figure 2.13).
Figure 2.13: Free atoms with intrinsic spins in random directions (left). Atoms precessing at the Larmor frequency 𝜔 around
the magnetic field's (B0) direction (right). Adapted from [49].
The Larmor frequency is dependent on the strength of the magnetic field, as well as other nuclear properties that are condensed into the gyromagnetic ratio, 𝛾. As the energy of the parallel direction is slightly lower than the anti-parallel, it will be favoured, and a non-null magnetic effect (bulk magnetization) arises in the direction of the magnetic field. Because the spins are out of phase with it each other, the bulk magnetization will have no transversal components and will be aligned with the B0
axis. By applying radiofrequency (RF) pulses, which are alternating magnetic fields with frequency equal to the Larmor frequency, the magnetization is forced to tip over and a transversal component is induced (Figure 2.14), and the spins will be in phase. Stopping the RF pulse will cause the spins, and thus magnetization, to return to its initial direction, in what is called Relaxation. Relaxation comprises two independent mechanisms: spin-spin and spin-lattice interactions. [50]
Figure 2.14: Tipping over of the net magnetization (𝜇⃗)caused by the application of and RF pulse. [50]
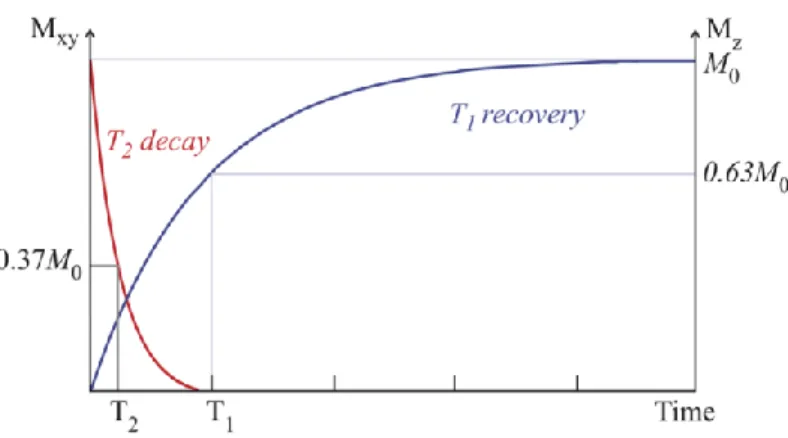
Spin-lattice interactions result in the recovery of Mz after the application of the RF pulse through
the realignment of the spins with B0, by exchanging energy with the surrounding tissue. Mathematically,
this recovery is modelled by an exponential curve and its growth constant being T1 (spin-lattice
relaxation time), the time it takes for Mz to recover 63% of its initial value (Figure 2.15). [50]
Spin-spin interactions are the de-phasing of spins after the RF pulse is stopped and result in a decrease in the transversal component of the magnetization (Mxy) as it returns to the original state. This
is described by an exponential curve with a time constant T2 (spin-spin relaxation time), which
represents the time it takes for Mxy to reach 37% of its original magnitude (Figure 2.15) and depends on
Figure 2.15: Graphical representation of T1 and T2 relaxation. T1 and T2 are constants measured for 90º RF pulses. [51]
To allow for the imaging of the detected signals, special encoding is still needed in order to precisely locate where the signals are coming from. This process is done in three parts: slice selection, frequency encoding and phase encoding.
A slice is selected by introducing a linear gradient in the magnetic field in the axial direction (Figure 2.16). As mentioned before, the frequency of the spin is proportional to the strength of the magnetic field. In the presence of a gradient, spins in different location are subject to different strengths, and the RF pulses with the Larmor frequency corresponding to those strengths will only induce magnetization in a specific part of the patient’s body, selecting a slice and locating the origin of the signal in the axial direction, giving it a z coordinate, Gz.
Figure 2.16: Principle of slice selection through the application of a linear magnetic field gradient and a small bandwidth of
the RF pulses. [52]
To further locate the spins, the same principle is applied in the y and x directions, with a phase
encoding gradient and a frequency encoding gradient, respectively, all at different times. The three
successive gradients then yield all the necessary coordinates (Gx, Gy, Gz) to precisely locate the spins.
This information is then stored along with the time in a 4D spatial frequency domain called the k-space. [53], [54] By applying an inverse Fourier transform to this domain, the MR image is formed.
There is a large number of sequences that offer different contrasts between tissues, with different applications and purposes. Different sequences are achieved by selecting different RF pulse duration, intensity and shape, as well as the interval between them. The combination of this selection leads to very different image properties and different contrasts. MR image reconstruction and sequences are a matter that falls out of the scope of this dissertation and will not be discussed further.
2.3 PET/MR Hybrid systems
There are many approaches to multimodal imaging, involving different processes (simultaneous or sequential) and, of course, different techniques. The combination of different techniques provides many advantages, one of the biggest ones being that it joins physiological information with anatomical information, allowing for a better understanding of the human body and many kinds of diseases (cardiological, oncological, etc). PET/CT is nowadays one of the most popular multimodal imaging techniques, with thousands of systems installed worldwide. However, over the last few years, PET/MR has been gaining more and more popularity.
The idea of creating a fully integrated whole-body PET-MR hybrid system was proposed in the 1990s. [55] Since the insurgence of this concept, several studies have been conducted in order to make the differences between both systems compatible, both hardware- and software-wise. [56] In recent years, this kind of system has become commercially available, [57], [58] giving way to many studies regarding the potential of this multimodal technique.
The development of integrated PET/CT systems was quite straightforward, simply involving mounting stand-alone systems in a common gantry as there are no major incompatibilities. However, the process for PET/MRI was quite more troublesome and complex. The presence of the magnetic field, the size of both systems, the PET’s need for linear attenuation coefficients, which are obtained directly from CT scans but not MRI, full integration with the same FOV, among others, are technical challenges that had to be overcome in order to build integrated PET/MR systems.
Traditional PET detectors are usually made of inorganic scintillation crystals, lutetium
oxyorthosilicate (LSO) or LYSO being the most used, coupled to photomultiplier tubes (PMTs). The
magnetic field causes the electrons to deviate from their original path, causing tremendous loss in gain and rendering PMTs essentially useless in magnetic field of several mT. [59] Therefore, the main challenge was to find a way to have both systems operate simultaneously or at least in close proximity, like PET/CT scanners, which operate in-line, with the patient going through the CT before being in the FOV of the PET scanner. The crystals themselves are largely unaffected by the magnetic field and have also been shown to have little to no impact in MRI images [60] and so, the challenge relies mainly on replacing PMTs or changing the way they are coupled to the detectors. Besides the magnetic field issue, the size of the detectors would also have to be significantly decreased, to allow them to be placed inside the MRI bore without reducing the diameter so much that a patient could not fit inside. With the photodetectors being placed inside the MRI, the electronics associated with them will also have to be inside and thus, the circuit layouts, choice of components and good RF shielding have to be carefully chosen in order to avoid multiple kinds of interference and artifacts between both systems.
In early stages, the focus was mainly on separating the detector crystals from the PMTs and coupling them via fiber optics, placing all the PMTs in a magnetic field free environment. This solution was very impractical and raised many problems, such as the handling of such a large quantity of fiber optics and poor energy and timing resolutions. (Figure 2.17)