Bachelor of Science in Biomedical Engineering
Prediction of postoperative atrial fibrillation
using the electrocardiogram: A proof of concept
Dissertation submitted in partial fulfillment of the requirements for the degree of
Master of Science in Biomedical Engineering
Adviser: Dr Peter H Charlton, Research Associate, King’s College London
Co-adviser: Dr Pedro Vieira, Assistant Professor,
Faculdade de Ciências e Tecnologia, Universidade Nova de Lisboa
Examination Committee
Chairperson: Dr Célia Maria Reis Henriques, Assistant Professor at FCT-NOVA Raporteur: Dr Carla Maria Quintão Pereira, Assistant Professor at FCT-NOVA
proof of concept
Copyright © Diogo Bernardo Jacinto Tecelão, Faculty of Sciences and Technology, NOVA University Lisbon.
The Faculty of Sciences and Technology and the NOVA University Lisbon have the right, perpetual and without geographical boundaries, to file and publish this dissertation through printed copies reproduced on paper or on digital form, or by any other means known or that may be invented, and to disseminate through scientific repositories and admit its copying and distribution for non-commercial, educational or research purposes, as long as credit is given to the author and editor.
This document was created using the (pdf)LATEX processor, based in the “novathesis” template[1], developed at the Dep. Informática of FCT-NOVA [2]. [1] https://github.com/joaomlourenco/novathesis [2] http://www.di.fct.unl.pt
I would like to acknowledge and thank the following important people who have sup-ported me throughout this work.
Firstly, I would like to express my sincere gratitude to my supervisor Dr Peter Charlton. Peter has been an inspiration and a role model, having always helped, advised, and encouraged me unconditionally. The teachings and friendship Peter has provided me makes all this journey and thesis worth it. Secondly, I would like to thank Dr Pedro Vieira, whom I look up to, and whose support and advices were important.
I am also thankful to my close family who have always supported me. Without their encouragement and faith in me, I would never get this far. I would like to thank all my friends, who made all this journey worth and a lot more fun. A special thank you to: Filipe Valadas, who has greatly supported and inspired me (may thepatadas and occlumency
never end); André Pita, for all his friendship and prophylactic thoughts; and Ana Maria, for all her love and support.
Finally, I would like to thank Professor Rui Cardoso, my cousin Nuno, and Professor Antonieta Freire for all their help during my scholar journey. Without them I would not get this far.
Hospital patients recovering from major cardiac surgery are at high risk of postoperative atrial fibrillation (POAF), an arrhythmia which can be life-threatening. With the develop-ment of a tool to predict POAF early enough, the developdevelop-ment of the arrhythmia could be potentially prevented using prophylactic treatments, thus reducing risks and hospital costs. To date, no reliable method suitable for autonomous clinical integration has been proposed yet.
This thesis presents a study on the prediction of POAF using the electrocardiogram. A novel P-wave quality assessment tool to automatically identify high-quality P-waves was designed, and its clinical utility was assessed. Prediction of paroxysmal atrial fibrillation (AF) was performed by implementing and improving a selection of previously proposed methods. This allowed to perform a systematic comparison of those methods, and to test if their combination improved prediction of AF. Finally, prediction of POAF was tested in a clinically relevant scenario. This included studying the 48 hours preceding POAF, and automatically excluding noise-corrupted P-waves using the quality assessment tool.
The P-wave quality assessment tool identified high-quality P-waves with high sensitiv-ity (0.93) and good specificsensitiv-ity (0.84). In addition, this tool improved the abilsensitiv-ity to predict AF, since it improved the precision of P-wave measurements. The best predictors of AF and POAF were measurements of the variability in P-wave time- and morphological fea-tures. Paroxysmal AF could be predicted with high specificity (0.93) and good sensitivity (0.82) when several predictors were combined. Furthermore, POAF could be predicted 48 hours before its onset with good sensitivity (0.74) and specificity (0.70). This leaves time for prophylactic treatments to be administered and possibly prevent POAF. Despite being promising, further work is required for these techniques to be useful in the clinical setting.
Pacientes a recuperar de cirurgia cardíaca estão em alto risco de desenvolver fibrilação auricular pós-operativa (FAPO), uma arritmia potencialmente fatal. O desenvolvimento de uma ferramenta para prever a FAPO permitiria evitar a arritmia através de tratamentos profiláticos, reduzindo assim os riscos e custos hospitalares associados. Até ao momento não existe nenhuma técnica fidedigna capaz de integração autónoma no meio clínico.
Esta tese apresenta um estudo sobre a previsão da FAPO através do eletrocardiograma. Foi criada uma ferramenta inovadora que permite a identificação automática de ondas-P de alta qualidade, e a sua utilidade foi testada no contexto clínico. A previsão da fibrilação auricular (FA) paroxística foi realizada através da implementação e melhoria de uma seleção de métodos propostos na literatura. Isto permitiu a realização de uma comparação sistemática entre esses métodos, e testar se a sua combinação melhora a previsão da FA. Finalmente, a previsão da FAPO foi realizada num cenário clinicamente relevante: estudando as 48 horas anteriores ao começo da arritmia, e excluindo automaticamente ondas-P corrompidas por artefactos através da ferramenta de avaliação de qualidade.
A ferramenta de avaliação de qualidade das ondas-P identificou ondas-P de alta quali-dade com alta sensibiliquali-dade (0,93) e boa especificiquali-dade (0,84). Além disso, esta ferramenta melhorou a capacidade de prever a FA, através do aumento da precisão das medições reti-radas das ondas-P. Os melhores previsores da AF e FAPO foram medidas de variabilidade dos intervalos e morfologia da onda-P. A FA paroxística foi prevista com alta especifici-dade (0,93) e boa sensibiliespecifici-dade (0,82) através da combinação de vários métodos. A FAPO foi prevista com 48 horas de antecedência com boa sensibilidade (0,74) e especificidade (0,70). Esta antecedência permite que os tratamentos profiláticos sejam administrados e possivelmente evitem a FAPO. Apesar dos resultados promissores, trabalho futuro é necessário para que estas técnicas sejam úteis na prática clínica.
This thesis includes work that will be reported in different publications.
Currently, the work presented in Chapter 4 will be presented in the 5th International Electronic Conference on Sensors and Applications (ECSA-5). This will be published as a conference paper, entitled "Automated P-wave quality assessment for wearable sensors".
List of Figures xxi
List of Tables xxiii
Acronyms xxv
1 Introduction 1
1.1 Thesis Goals . . . 2
1.2 Thesis Outline . . . 3
2 Clinical Background 5 2.1 The cardiovascular system . . . 5
2.1.1 The electrocardiogram . . . 6
2.2 Atrial Fibrillation . . . 6
2.2.1 Epidemiology . . . 7
2.2.2 Mechanisms . . . 7
2.2.3 Risk factors . . . 8
2.3 Postoperative Atrial Fibrillation . . . 9
2.3.1 Epidemiology . . . 10
2.3.2 Mechanisms . . . 10
2.3.3 Risk factors . . . 11
2.3.4 Prevention . . . 12
2.3.5 Treatment . . . 13
3 Prediction of Postoperative Atrial Fibrillation: State of the Art 15 3.1 Preoperative AF risk stratification . . . 15
3.2 Prediction of atrial fibrillation . . . 18
3.2.1 Feature extraction . . . 18
3.2.2 Metric calculation . . . 19
3.2.3 Model estimation . . . 19
3.3 Conclusion . . . 19
4 P-wave Quality Index 23 4.1 Introduction . . . 23
4.2 Methods . . . 24
4.2.1 Data description . . . 24
4.2.2 P-wave Quality Index algorithm . . . 25
4.2.3 P-wave Quality Index performance and utility assessment . . . 28
4.3 Results . . . 30
4.3.1 Decision stage 1: Removal of completely noisy P-waves . . . 30
4.3.2 Decision stage 2: Removal of distorted P-waves . . . 31
4.3.3 P-wave Quality Index performance and utility assessment . . . 32
4.4 Discussion . . . 36
4.4.1 Limitations and Future Work . . . 38
4.5 Final Remarks . . . 39
5 Prediction of Paroxysmal Atrial Fibrillation: Computers in Cardiology 2001 Challenge 41 5.1 Introduction . . . 41
5.2 Methods and materials . . . 42
5.2.1 Study population . . . 42
5.2.2 Signal preprocessing and delineation . . . 43
5.2.3 Feature extraction . . . 47
5.2.4 Metric calculation . . . 51
5.2.5 Statistical analysis . . . 56
5.2.6 Performance assessment . . . 57
5.3 Results . . . 57
5.3.1 Simple statistical metrics . . . 57
5.3.2 Linear Variability . . . 57
5.3.3 Non-linear Variability . . . 57
5.3.4 P-wave amplitude dispersion . . . 59
5.3.5 Heart rate variability . . . 59
5.3.6 Performance assessment . . . 59
5.4 Discussion . . . 61
5.4.1 P-wave time analysis . . . 63
5.4.2 P-wave morphology analysis . . . 64
5.4.3 Heart rate variability . . . 65
5.4.4 Limitations and Future Work . . . 65
5.5 Final Remarks . . . 66
6 Prediction of Postoperative Atrial Fibrillation 67 6.1 Introduction . . . 67
6.2 Methods and materials . . . 68
6.2.1 Study population . . . 68
6.2.3 Feature extraction and metric calculation . . . 70
6.2.4 Statistical analysis and performance assessment . . . 71
6.3 Results . . . 71
6.3.1 Inclusion of data . . . 71
6.3.2 Prediction of postoperative atrial fibrillation . . . 72
6.4 Discussion . . . 80
6.4.1 Prediction of postoperative atrial fibrillation . . . 82
6.4.2 P-wave variability in the postoperative setting . . . 82
6.4.3 Heart rate variability . . . 83
6.4.4 Data inclusion . . . 83
6.4.5 Limitations and future work . . . 84
6.5 Final Remarks . . . 85
7 Conclusion 87 7.1 Summary of thesis achievements . . . 87
7.2 Future work . . . 90
7.2.1 Reliability of P-wave measurements . . . 90
7.2.2 Prediction of atrial fibrillation . . . 91
7.3 Application in clinical practice . . . 93
Bibliography 95 A Appendix A: Comparison of P-wave delineators 111 A.1 Introduction . . . 111
A.2 Methods . . . 112
A.2.1 Comparisons with manual annotations . . . 112
A.2.2 Visual inspection of P-wave delineations . . . 113
A.3 Results . . . 113
2.1 Representation of the electrical acitivity of the heart during sinus rhythm, and
corresponding electrocardiogram. . . 6
2.2 Electrical conduction during sinus rhythm and atrial fibrillation. . . 8
2.3 Mechanisms responsible for atrial fibrillation maintenance. . . 9
2.4 Pathogenesis of postoperative atrial fibrillation. . . 11
3.1 The three stages of the techniques that perform beat-to-beat analyses of the electrocardiogram for atrial fibrillation prediction. . . 18
3.2 Illustration of the three stages of atrial fibrillation prediction algorithms. . . 18
3.3 Example of representative electrocardiogram signals corresponding to healthy sujects and patients susceptible to paroxysmal atrial fibrillation. . . 21
4.1 The three different classes of P-wave quality. . . 25
4.2 The three steps of the P-wave quality index algorithm. . . 26
4.3 The importance of proper P-wave alignment for P-wave template creation. . 27
4.4 P-wave morphology variation over time due to physiological variations. . . . 29
4.5 Decision tree from the first decision stage of the P-wave quality index tool. . 32
4.6 Area under the curve in function of the number of P-waves grouped to create a P-wave template. . . 33
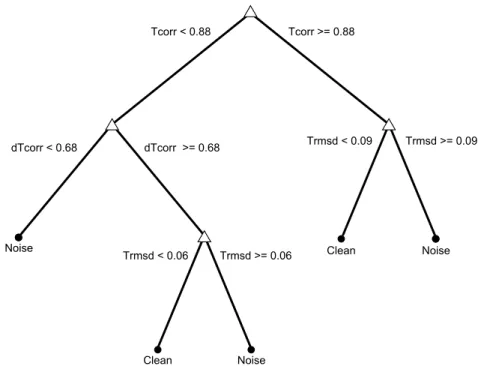
4.7 Decision tree from the second decision stage of the P-wave quality index tool. 33 4.8 Differences in mean absolute error between P-wave mean duration calculated when using all the P-waves and when using those obtained with the final P-wave quality index tool. . . 35
4.9 Individual performance to classify overall P-wave quality (low qualityvs. high quality). . . 37
5.1 Transformations of the electrocardiogram signal obtained using the Pan & Thompkins algorithm and the phasor transform. . . 44
5.2 Representation of the P-wave detection and delineation process. . . 46
5.3 Examples of P-waves and associated correlation coefficient index and warping index. . . 49
5.5 Illustration of metrics extracted from the variability series: slope of linear fitting and median. . . 53 5.6 Illustration of the calculation of the central tendency measurement metric. . 54 5.7 Illustration of the calculation of the amplitude dispersion index metric. . . . 55 5.8 Illustrative example of P-wave euclidean distance variability time course from
a typical patient far away from the onset of paroxysmal atrial fibrillation and from a typical patient close to the arrhythmia onset. . . 59 5.9 Illustrative example of difference plots from a typical healthy subject and a
patient who developed paroxysmal atrial fibrillation. . . 61 5.10 Decision tree built to compare healthy subjects to patients which developed
paroxysmal atrial fibrillation. . . 61 5.11 Decision tree built to distinguish between patients with paroxysmal atrial
fibrillation that are far and close to the arrhythmia onset. . . 62
6.1 Timestamps relative to the onset of postoperative fibrillation in which one-hour recordings were extracted. . . 69 6.2 Template-matching for electrocardiogram signal quality assessment. . . 70 6.3 Number of records per time-stamp used in the analysis for controls and
pa-tients who developed postoperative atrial fibrillation. . . 72 6.4 Decision tree used to predict postoperative atrial fibrillation. . . 79 6.5 Sensitivity and specificity obtained when trying to predict postoperative atrial
fibrillation. . . 80 6.6 Example of representative electrocardiogram signals corresponding to a
pa-tient 30 hours before the onset of postoperative atrial fibrillation and a control. 81 A.1 Representative example of the calculation of the delineation location error. . 113
3.1 Risk models for the prediction of incident atrial fibrillation after cardiac surgery. 16 3.2 Preoperative electrocardiogram-based methods for prediction of postoperative
atrial fibrillation. . . 17 3.3 Studies that have performed beat-to-beat analyses of the electrocardiogram
for predicting several types of atrial fibrillation, which would be suitable for use in continuous postoperative monitoring. . . 20
4.1 P-wave quality assessment features, and corresponding area under the curve for both decision-making stages. . . 31 4.2 Classification performance of decision-making stages 1 and 2 from the P-wave
quality index tool. . . 31 4.3 Classification performance (high qualityvs. low quality P-waves) of each
ver-sion of the P-wave quality index tool. . . 32 4.4 Utility of each version of the P-wave quality index tool assessed with mean
absolute error comparisons between P-wave features obtained using all the available P-waves and those labelled as high quality by each version of the P-wave quality index tool. . . 34 4.5 Utility of each version of the P-wave quality index tool assessed using analyses
to predict paroxysmal atrial fibrillation. . . 35 4.6 Comparison between individual P-wave quality classes (class Avs. Class B
and Class A vs. Class C P-waves), and comparison of overall classification
performance (class Avs. classes B and C) between controls and patients who
developed atrial fibrillation. . . 36
5.1 Selection of features extracted from the electrocardiogram signal. . . 48 5.2 Implemented methods, and corresponding computed metrics. . . 52 5.3 Significant results obtained using simple statistical metrics and heart rate
variability metrics (Healthyvs. PAF patients) . . . . 58 5.4 Significant results obtained using linear variability metrics (Healthyvs. PAF
patients and PAF farvs. PAF close) . . . . 58 5.5 Significant results obtained using non-linear variability metrics (Healthyvs.
5.6 Classification results obtained when comparing Healthyvs. PAF patients and
PAF farvs. PAF close. . . . 60
6.1 Clinical characteristics of the subjects that were included in the analysis. . . 72 6.2 Significant results obtained when using simple statistical metrics to predict
postoperative atrial fibrillation. . . 73 6.3 Significant results obtained when using linear variability metrics to predict
postoperative atrial fibrillation. . . 75 6.4 Significant results obtained when using non-linear variability metrics to
pre-dict postoperative atrial fibrillation. . . 76 6.5 Significant results obtained when using heart rate variability metrics to predict
postoperative atrial fibrillation. . . 78 6.6 Classification results obtained when predicting postoperative at the several
tested timestamps. . . 78
A.1 Comparison of the delineation performance of the phasor transform and wavedet algorithms, measured with the location error. . . 114
ABP Arterial Blood Pressure. ADI Amplitude Dispersion Index. AF Atrial Fibrillation.
AFPDB Atrial Fibrillation Prediction Database. AUC Area Under the Curve.
AV Atrioventricular.
bpm beats per minute.
CABG Coronary Artery Bypass Grafting. CCI Correlation Coefficient Index. CinC Computers in Cardiology. CTM Central Tendency Measurement.
DTW Dynamic Time Warping.
ECG Electrocardiogram.
ESC European Society of Cardiology.
FFT Fast Fourier Transform.
HR Heart Rate.
HRV Heart Rate Variability.
ICU Intensive Care Unit.
IV Intravenous.
LE Location Error. LoA Limits of Agreement.
MAE Mean Absolute Error.
MIMIC-III Medical Information Mart for Intensive Care III.
NPV Negative Predictive Value.
PAF Paroxysmal Atrial Fibrillation. POAF Postoperative Atrial Fibrillation.
PPG Photoplethysmogram.
PPV Positive Predictive Value. PQI P-wave Quality Index.
PT Phasor Transform.
PV Pulmonary Veins.
QTDB QT Database.
RMS Root Mean Square.
ROC Receiver Operating Characteristic.
SA Sinoatrial.
SD Standard Deviation.
SNR Signal-to-noise ratio. SQI Signal Quality Index.
WF Warping Function.
C
h
a
p
t
1
I n t r o d u c t i o n
Atrial fibrillation (AF) is the most common cardiac arrhythmia in clinical practice, and a well-recognized complication of cardiac surgery [1]. Patients recovering from major cardiac surgery are at high-risk of developing postoperative AF (POAF), with an incidence of 11% - 62%, depending on the type of surgery [2–7]. Importantly, the frequency of this arrhythmia appears to be increasing, most likely due to the increasing age of patients undergoing cardiac surgery [8].
Even though AF is self-limiting in nature, this arrhythmia is associated with increased risk of stroke and hemodynamic compromise, mortality, increased length of hospital stay, and health care costs [9–11]. In the long term, patients who develop POAF have a twofold increase in cardiovascular mortality [12], and a substantial increase in the risk of future AF and ischemic stroke, compared to patients who remain in sinus rhythm after surgery [13–15].
Prophylactic treatment has been shown to be effective in the prevention of POAF [16– 20]. However, it is not routinely used because indiscriminate use of prophylactic agents does not outweigh the risks of side effects [21, 22] and has added costs [22]. Therefore, if a tool could be developed to predict the onset of POAF early enough, then the development of the arrhythmia could potentially be prevented using prophylactic treatments, thus reducing risks and hospital costs.
This issue has been approached both pre- and postoperatively, achieving encouraging yet insufficient results. The P-wave from the electrocardiogram (ECG) has been widely studied since it reflects atrial depolarization. Preoperative risk stratification has used AF risk factors, with or without ECG measurements, to identify patients at risk of develop-ing AF [23]. Even though these studies have identified important factors that predispose individuals to the arrhythmia, their clinical application is limited by their moderate per-formance. More recently, long-term continuous monitoring has led to the identification
of subtle P-wave alterations that were found to predict AF at least 2 hours before its onset with high accuracy [24–27].
Although considerable progress has been achieved in the prediction of AF, no reliable method suitable for autonomous clinical integration has been proposed yet. Several ad-ditional steps are required to implement such systems in clinical practice. The first step concerns the improvement of predictive methods and evaluation in clinically relevant scenarios. This includes the prediction of POAF sufficiently long before its onset when prophylactic treatment is beneficial and the inclusion of heart rhythms other than sinus rhythm, which are commonly found in the postoperative setting. Secondly, such predic-tion techniques need to be adapted for unsupervised use during continuous monitoring, where ECG data is susceptible to artefacts that lead to inaccurate measurements.
1.1
Thesis Goals
This thesis aimed to address several of the steps required before techniques to predict POAF can be implemented in the clinical setting. The hypothesis of this project is that:
ECG signals can be analysed to predict the onset of POAF with sufficient warning time to allow prophylactic treatment to be administered.
Several goals were identified in order to achieve the overall aim as follows:
• Design a P-wave quality assessment tool, and assess its performance and clinical utility. This tool will automatically assess P-wave quality. Performance assessment will include the ability to distinguish between high and low quality data. The clinical utility of the tool will be assessed by testing if the developed tool improves the precision of several P-wave feature measurements and prediction of AF.
• To identify, implement and improve previously proposed methods for predict-ing AF uspredict-ing the ECG signal, and assess their performance uspredict-ing a database containing records from healthy subjects and patients before the onset of AF. Performance assessment will include the ability to distinguish between controls and subjects who subsequently develop AF, and to predict the imminent onset of the arrhythmia in subjects who develop AF.
• Assess the performance of the previously implemented methods to predict POAF on a real world clinical database. Prediction of POAF will be performed in a clini-cally relevant scenario: 48 hours before the arrhythmia and without supervision.
The novelties of this study are that it is the first to predict POAF during a clinically realistic scenario, and that it is the first investigating the 48 hours prior to the onset of the arrhythmia. Furthermore, this study is the first to perform a systematic comparison of previously proposed methods, and test if they can be used in combination to improve
prediction of AF. Finally, a novel P-wave quality assessment tool is presented, which allows the AF prediction to be conducted without supervision.
1.2
Thesis Outline
The thesis is structured as follows. Chapter 2 presents the clinical background, including the cardiovascular system, the ECG signal, and an overview of both AF and POAF. In Chapter 3 the state of the art on the prediction of AF is presented, including preoperative AF risk stratification and postoperative prediction of POAF. In chapter 4 a novel P-wave quality assessment tool is presented, and its performance and clinical utility are assessed. Chapter 5 presents a study on the ability of several proposed methods for predicting paroxysmal AF. Chapter 6 presents a study of the performance of these methods when predicting POAF in a clinically relevant scenario. Finally, Chapter 7 presents a summary of the achievements of this thesis and directions for future work.
C
h
a
p
t
2
C l i n i c a l Ba c k g r o u n d
In this chapter the clinical background to this thesis is presented. Firstly, the cardio-vascular system is presented, including a physiological monitoring technique: the elec-trocardiogram (ECG). This is followed by an overview of atrial fibrillation (AF) and postoperative atrial fibrillation (POAF), including their epidemiology, mechanisms, risk factors and the current treatment methodologies.
2.1
The cardiovascular system
The heart consists of four muscular chambers. The left and right ventricles are the main pumping chambers, whilst the less muscular left and right atria deliver blood to their respective ventricles. Four major valves in the healthy heart direct blood flow in a for-ward direction and prevent backfor-ward leakage. The atrioventricular valves (tricuspid and mitral) separate the atria and ventricles, whereas the semilunar valves (pulmonary and aortic) separate the ventricles from the great arteries [28]. From a functional point of view, the deoxygenated blood is delivered to the heart through the inferior and superior venae cavae, and enters the right atrium. Flow continues through the tricuspid valve into the right ventricle. Contraction of the right ventricle pumps the blood across the pulmonary valve to the pulmonary artery and lungs, where carbon dioxide is released and oxygen is absorbed. The oxygen-rich arterial blood returns to the heart through the pulmonary veins to the left atrium and then passes through the mitral valve into the left ventricle. Contraction of the left ventricle propels the arterial blood through the aortic valve into the aorta, from where it is distributed to all other tissues across the body [28].
Cardiac contraction relies on the organized flow of electrical impulses through the heart’s impulse-conducting system. The normal heartbeat begins at the sinoatrial (SA) node, located at the junction of the right atrium and the superior vena cava (Figure
2.1). The wave of depolarization spreads rapidly through the right and left atria and then reaches the atrioventricular (AV) node, where it encounters an expected delay (of approximately 0.1 seconds). This pause in conduction is beneficial in the sense that allows the atria time to contract and fully empty their contents and serves as a “gatekeeper” of conduction from atria to ventricles, limiting the rate of ventricular stimulation during atrial arrhythmias [28]. After traversing the AV node, the impulse then travels rapidly through the bundle of His and into the right and left bundle branches. Those, in turn, divide into the Purkinje fibres, which radiate toward the myocardial fibres, stimulating them to depolarize and contract, pumping the blood through the respective valves [28].
2.1.1 The electrocardiogram
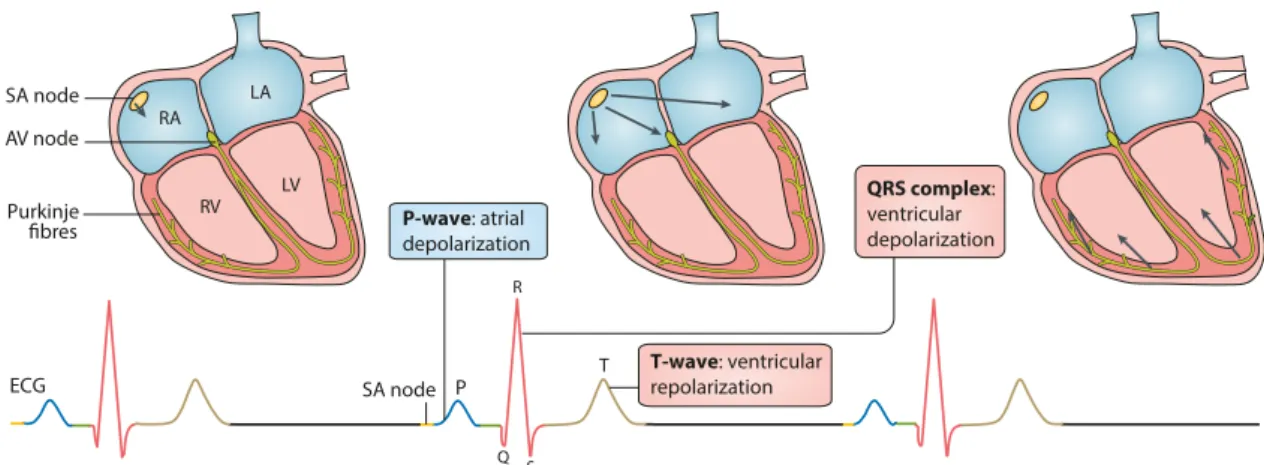
The aforementioned electrical activity of the heart results in small currents within the body and potential differences on the surface of the skin, which can be measured using skin electrodes. Each healthy heartbeat is represented on the ECG by three major deflec-tions that record the sequence of electrical propagation. The P-wave represents the atrial depolarization, and is followed by a period of baseline resulting from the conduction de-lay at the AV node (PR interval). The second and more pronounced deflection on the ECG is the QRS complex, which represents the ventricular depolarization. After a brief delay during baseline, the T-wave surges representing ventricular repolarization (Figure 2.1). Occasionally, an additional small deflection named the U-wave follows, representing late phases of ventricular repolarization [28].
ECG P QRS complex: ventricular depolarization T RA LA LV RV SA node SA node Purkinje fibres AV node P-wave: atrial depolarization T-wave: ventricular repolarization Q R S
Figure 2.1: Representation of the electrical activity of the heart during sinus rhythm (top), and corresponding electrocardiogram (ECG; bottom). Adapted from Lipet al. [11].
2.2
Atrial Fibrillation
AF is a supraventricular arrhythmia with an atrial discharge rate so fast (350 to 600 discharges per minute) that distinct P waves are not discernible on the ECG [28], resulting in low-amplitude baseline oscillations [29]. As many of the atrial impulses encounter
refractory tissue at the AV node, allowing only some of the depolarization to be conducted to the ventricles in a very irregular fashion, the result is an “irregularly irregular” rhythm (Figure 2.2). The average ventricular rate in untreated AF is approximately 140 to 160 beats per minute (bpm) [28].
This disorder is the most common cardiac rhythm disorder, with an increasing global prevalence and incidence [1]. The most serious complications of AF include stroke, sys-temic thromboembolism, heart failure, and dementia, contributing to increased mortality and morbidity, and entailing high costs for families and society. The current economic burden of AF in Europe is substantial, with widespread implications for the planning of national health care systems [30], as the rate of hospitalization and treatment costs are increasing in epidemic proportions [31].
2.2.1 Epidemiology
AF is the most common arrhythmia found in clinical practice, affecting approximately 4.5 million in the European Union and 2.2 million in North America. Furthermore, AF is responsible for nearly 33% of arrhythmia-related hospitalizations [28]. There are almost five million new cases of AF every year, with the number of affected individuals expected to increase continuously in an exponential fashion [11, 32, 33]. The cause of this global increase might be due to an ageing population, since age is the strongest risk factor for developing AF. Furthermore, improvements in how conditions associated with AF are managed might also contribute to the increased AF rates, as survival of these conditions can be associated with cardiac damage, which also predisposes to AF [11].
AF is linked to numerous serious complications: a four- to five-fold increased risk of stroke [11, 34, 35], a three-fold increased risk of heart failure, and a nearly two-fold increased risk of all-cause mortality [36]. Strokes related to AF are associated with greater mortality, disability, with longer hospital stays, and lower rates of discharge to a patient’s own home, compared with strokes that are not associated with AF [37]. Patients with AF generally experience increased morbidity and more admissions to hospital than those who do not have the arrhythmia. Increasing evidence also suggests an association between AF and an increased risk of ‘premature’ dementia [11].
2.2.2 Mechanisms
The central feature of AF is very rapid and irregular atrial activity. This generally requires a trigger to be initiated, which is typically a focal spontaneous firing. These triggers most commonly arise as rapid firing foci in sleeves of atrial muscle that extend into the pul-monary veins (PV), although it can also emerge from non-PV foci [11]. In paroxysmal AF (i.e., sudden, unpredictable episodes), AF is often initiated by these rapid discharges from the PV, reflected in premature atrial complexes [38–41]. The mechanism maintaining the arrhythmia often arises in what is commonly referred to as vulnerable substrate. This substrate might be associated with the several risk factors, such as genetic predisposition,
(a) Sinus rhythm (b) Atrial fibrillation
ECG Normal beat
Atrial fibrillation onset
Figure 2.2: Electrical conduction during sinus rhythm and atrial fibrillation. Schematic diagrams of cardiac mechanisms (top of each panel) and electrocardiograms (ECGs; bot-tom of each panel) in (a) normal sinus rhythm and (b) atrial fibrillation. Adapted from Lipet al. [11].
cardiac remodelling caused by heart disease, and/or altered regulation by neurohormonal factors such as autonomic imbalance and overactive thyroid function.
Each of the following three principal mechanisms can maintain the chaotic rhythm that comprises AF [11] (Figure 2.3):
1. One or more rapidly firing atrial ectopic foci may be present, with irregular conduc-tion towards the rest of the atria, producing irregular fibrillary-like activity.
2. One or a small number of primary re-entry circuits (or rotors) may produce rapid local activation, with fibrillary conduction causing AF.
3. Multiple functional re-entry waves with irregular patterns and no consistent acti-vation pattern, maintaining the disordered AF rhythm.
In fact, slowed conduction velocity together with decreased cell refractory periods are believed to provoke and maintain AF, as such abnormalities result in a non-uniform and anisotropic atrial conduction which plays a major role in the initiation of re-entry.
The electromechanical consequences of AF have serious clinical implications. The absence of effective atrial contraction increases the risk of blood coagulation and throm-bosis. Furthermore, the rapid and irregular ventricular rate generated by the arrhythmia reduces the efficiency of ventricular contraction, affecting hemodynamics and, ultimately, causing heart failure [11, 42].
2.2.3 Risk factors
Most risk factors are consistently associated with an increased risk of developing AF across all ethnic groups [11], even though ethnicity itself is reported to affect the inci-dence of the arrhythmia [43, 44]. AF is more common in elderly male individuals with cardiovascular abnormalities, such as hypertension, ischemic heart disease, or forms of
structural heart disease. Obesity and obstructive sleep apnea, although related, have been found to independently increase the risk for AF. The most common temporary causes are excessive alcohol consumption, open heart or thoracic surgery (POAF), myocardial infarc-tion, pericarditis, myocarditis, and pulmonary embolism. The most common correctable cause if hyperthyroidism [28].
(a) Rapidly discharging focus (b) Primary rotor(s) (c) Multiple functional re-entry waves/rotors Pulmonary veins SA node Purkinje AV node
Figure 2.3: Mechanisms responsible for atrial fibrillation maintenance. Ectopic electrical impulses that propagate throughout the atrial myocardium in a disordered way can be maintained through a variety of mechanisms: (a) a rapidly discharging atrial focus, (b) primary re-entrant rotor(s), (c) multiple functional re-entry circuits. AF, atrial fibrillation; AV, atrioventricular; LA, left atrium; LV, left ventricle; PV, pulmonary vein; RA, right atrium; SA, sinoatrial. Adapted from Lipet al [11].
2.3
Postoperative Atrial Fibrillation
POAF is the most frequent complication of cardiac surgery [9], with a prevalence depen-dent on the type and technique of surgery, patient characteristics, method of arrhythmia surveillance, and definition of the arrhythmia [20]. Importantly, the incidence of POAF is increasing, most likely due to the increasing number of elderly subjected to cardiac surgery. Similarly to other types of AF, it affects patient well-being, by increasing the risks of stroke, hemodynamic compromise, and mortality [13, 14]. Furthermore, it increases the hospital length of stay, and incurs additional treatment costs [9].
2.3.1 Epidemiology
The incidence of POAF ranges from 11% to 62%, with the highest rate after combined coronary artery bypass grafting (CABG) and valve surgery [7, 45]. POAF may also occur in up to 40% in patients undergoing CABG surgery [4–6], 35% to 40% after valvular surgery [4, 5, 46], and 11% to 24% after cardiac transplantation [4, 5]. Initial onset of AF occurs most commonly on postoperative days two or three [6], and the majority of episodes occur within the first six days following cardiac surgery [10]. The incidence in patients undergoing non-cardiothoracic surgery varies between 0.3% and 30%, depending greatly on the specific surgical procedure [47–50].
POAF is associated with increased incidence of other postoperative complications, stroke being the most recognized, with a threefold risk increase [4, 51]. There is evi-dence of association between POAF and myocardial infarction, congestive heart failure, ventricular arrhythmias, renal insufficiency, hypotension, pulmonary edema, pneumonia, mediastinitis or deep sternal wound infection, sepsis, and harvest site infection. (It is important to note that these associations do not necessarily indicate a causal relationship between POAF and the mentioned complications, as it may just be an epiphenomenon [8]). Patients who develop POAF are also associated with the need for a permanent pacemaker, inotropic medications, prolonged ventilation, readmission to the ICU, and consequent increased hospital length of stay [51]. The impact of POAF on hospital resources is sig-nificant, with an extra cost of care of approximately $10,000 (8,700€) per patient in the United States [3]. In the long term, patients with an episode of POAF have a twofold increase in cardiovascular mortality [12], and a substantial increase in the risk of future AF and ischemic stroke, compared to patients who remain in sinus rhythm after surgery [13–15].
2.3.2 Mechanisms
The electrophysiological mechanisms underlying AF after cardiac surgery are not fully understood. However, it is believed that patients who develop POAF may already have preexisting atrial substrate for this arrhythmia before surgery [8], such as atrial fibrosis or dilation, with surgery being the trigger for AF. In patients undergoing cardiothoracic surgery this trigger can be related to the intraoperative trauma, manipulation of the heart, local inflammation (with or without pericarditis), elevated atrial pressure due to postoperative ventricular stunning, and the rapid return of atrial temperature after cardioplegia [45, 52]. In all-type surgical patients, AF can also be related to specific factors, such as direct cardiac stimulation from the perioperative use of catecholamines or reflex sympathetic activity from volume loss, anemia, fever, hypo- or hyperglycemia, and electrolyte disturbances [45]. There is also evidence that inflammation, both systemic and local, may play a role in the pathogenesis of POAF [52]. These surgical factors may therefore trigger POAF in susceptible patients through dispersion of atrial refractoriness [53], non-uniform atrial conduction [54], or increased premature atrial complexes [39]
(Figure 2.4).
2.3.3 Risk factors
Documented risk factors for the development of POAF can be divided into preoperative, perioperative and postoperative. In addition to common AF risk factors such as increased age and cardiovascular disease, other preoperative factors such as prior history of AF and hypothyroidism have been associated with the postoperative arrhythmia. Intraoperative variables include type of surgery, aortic cross-clamp time, the early return of atrial elec-trical activity after cardioplegia, atrial ischemia, systemic and pericardial inflammation, systemic hypothermia, and electrolytic imbalances, such as hypokalemia and hypomag-nesemia. Postoperative conditions associated with POAF include respiratory compromise, which can be due to postoperative pneumonia, and hypotension.
Preopera�ve factors: - Advanced age - Hypertension - Diabetes - Obesity - Prior history of AF - Le� atrial enlargement - Diastolic dysfunction - Le� ventricular hypertrophy - Gene�c predisposi�on
Intraopera�ve factors:
- Surgery type
- Aor�c cross-clamp �me - Systemic hypothermia - Acute volume changes - Atrial ischemia Postopera�ve factors: - Respiratory compromise - Volume overload - Hypotension - Red cell transfusion
Triggers:
- Atrial premature contrac�ons - Imbalance of autonomic nervous system - Electrolyte imbalance (hypomagnesemia, hypokalaemia) - Inflamma�on - Oxida�ve stress
Atrial structural substrate
Atrial electrophysiological substrate
Postopera�ve Atrial Fibrilla�on
Dispersion of atrial refreactoriness and non-uniform atrial conduction
Figure 2.4: Pathogenesis of postoperative atrial fibrillation. It is believed that patients who develop POAF may already have preexisting atrial substrate that, together with intra- and post-operative factors, may trigger POAF through dispersion of atrial refrac-toriness, non-uniform atrial conduction, or increased premature complexes. Adapted from Echahidiet al [9].
2.3.4 Prevention
Many studies have evaluated the effectiveness of pharmacologic and non-pharmacologic interventions to prevent the onset of POAF, and therefore decrease its growing incidence. Current practice is based on the 2016 European Society of Cardiology (ESC) guidelines [55], and is presented bellow.
Beta-blockers. Beta-Adrenergic blockade helps reduce the effect of increased sympa-thetic activation, which is believed to be a significant contributor to the development of AF in the postoperative period, and to be present in patients undergoing cardiac surgery [9]. The preoperative initiation of beta-blockers has been demonstrated to be more effec-tive than postoperaeffec-tive initiation. These drugs have the additional benefit of controlling the ventricular rate in the event of AF. Due to the extensive evidence of benefits from beta-blockers, the 2016 ESC guidelines presented a class I recommendation to perioper-ative beta-blocker therapy in patients subjected to cardiac surgery [55]. Although it is cost-effective for the reduction of AF, no significant decreases in hospital length of stay [17, 56] and overall cost of care have been observed [56]. The anti-arrhythmic effect of beta-blockers peaks immediately when administered intravenously (IV), and after 1 to 1.5 hours when administered orally [57]. Adverse effects include bradycardia, fatigue, bronchospasm, hypotension, and aggravation of heart failure [58, 59].
Amiodarone. Amiodarone has alpha- and beta-adrenergic blocking properties that might attenuate the elevated sympathetic stimulation seen in patients undergoing cardiac surgery [9, 60]. This anti-arrhythmic drug was found to reduce the incidence of POAF compared to beta-blocker therapy in several meta-analyses, also reducing hospital length of stay [55]. Perioperative amiodarone should be considered as prophylactic therapy to prevent POAF (class IIa in 2016 ESC guidelines), particularly so in high-risk patients [61]. The anti-arrhythmic effect of amiodarone peaks between 1 minute and 1.5 hours after IV administration [62]. When administered orally, the drug concentration peaks after 3 to 7 hours [63, 64], but the anti-arrhythmic effects only start after 2/3 days to 1/3 weeks [62, 65] (the oral absorption rate is slow and variable because amiodarone is highly lipophylic [58]). Adverse effects include symptomatic bradycardia and heart block in patients with pre-existing sinus or AV node disease, dose-related pulmonary toxicity, and hypo- or hyperthyroidism [59].
Although not present in the 2016 ESC guidelines, other therapies have also been studied, showing a decrease in POAF. Pharmacologic therapies include magnesium, colchicine, and corticosteroids [55]. A non-pharmacologic approach includes prophy-lactic atrial pacing, which acts through the suppression of atrial premature complexes and dispersion of atrial refractoriness, which are known to facilitate the onset of POAF [41, 45]. Despite suggestions of its prophylactic effects, biatrial pacing has not gained widespread use [55].
2.3.5 Treatment
Although POAF can be transient and self-limiting, treatment is indicated for patients who remain symptomatic, are hemodynamically unstable, and develop cardiac ischemia or heart failure [9]. Conventional treatment strategies include restoration/maintenance of sinus rhythm, control of ventricular rate response, and prevention of thromboembolic events. The treatment of POAF is manly based on studies of patients undergoing cardiac surgery, with much lower evidence on non-cardiac surgery [55].
Rate control. The postoperative period is characterized by increased adrenergic stress, which might difficult ventricular rate control in patients with POAF. Short-acting beta-blockers are the most widely used therapy, except for patients with contraindications to such agents. For those, other AV nodal blocking agents such as the nondihydropyridine calcium-channel blocker, can be used. Amiodarone is also effective in controlling heart rate, being further associated with improved hemodynamic status [9].
Rhythm control. In symptomatic patients or in cases of difficult control of ventric-ular response, cardioversion (i.e., conversion to sinus rhythm) is preferred. Chemical cardioversion with agents such as amiodarone, procainamide, ibutilide, and sotalol might be effective. Electrical cardioversion should be urgently performed when POAF results in hemodynamic instability, acute heart failure, or myocardial ischemia. This shock-procedure is electively used to immediately restore sinus rhythm after the first onset of AF when a pharmacologic attempt has failed [9]. In postsurgical patients, electrical car-dioversion may be done either externally (transthoracic) or internally, using low-energy transvenous electrodes or epicardial wires placed during surgery. As atrial stunning per-sists after cardioversion, anticoagulation is recommended for the three to four weeks after conversion procedure. Thromboembolism is a major concern of cardioversion, ei-ther pharmacologically or electrically, particularly when POAF has been present for more than 48h [9].
Catheter ablation is an alternative approach. It is a well-established and commonly used therapeutic option for managing patients with symptomatic AF. It consists of ab-lating the site of anatomical reentry or fibrillary activity via a catheter that applies ra-diofrequency current to heat and destroy the tissue. However, this procedure is not recommended for management of POAF patients after thoracic surgery [66], since: 1) several factors that promote POAF cannot be addressed simply by this technique [29]; 2) it is common for AF to recur in the two- to three-month post-ablation healing phase, making it an inappropriate strategy for the control of acute, symptomatic AF, such as that which occurs in the postoperative setting; and 4) its efficacy is modest, and it is associated with risk of complications [66].
Thromboembolism prevention. Thromboembolic events are one of the most haz-ardous complications of AF, which can be reduced with anticoagulation. Moreover, oral anticoagulants at discharge have been associated with a reduction in long-term mortality in POAF. However, anticoagulation is associated with increased risk of bleeding or cardiac
tamponade when administered in the postoperative period [67]. Therefore, the indication and timing of this therapy in POAF patients should take into consideration the risk of postoperative bleeding. Aspirin is a suitable substitute for patients at low risk of throm-boembolic events [8]. It is important to note that even though stroke prevention is central to AF management, data on anticoagulation prophylaxis in the postoperative setting are significantly lacking, and management is often based on evidence from nonsurgical data [45].
C
h
a
p
t
3
P r e d i c t i o n o f Po s t o p e r a t i v e At r i a l
F i b r i l l a t i o n : S ta t e o f t h e A rt
This chapter presents the state of the art on the prediction of postoperative atrial fib-rillation (POAF). It is divided into two parts: preoperative atrial fibfib-rillation (AF) risk stratification and postoperative prediction of AF. The first describes risk stratification efforts to predict POAF using either risk factors, preoperative electrocardiogram (ECG) features, or both combined. The second contains recent methodologies for analysing the ECG on a beat-to-beat basis to predict the onset of atrial fibrillation.
3.1
Preoperative AF risk stratification
An important aspect of POAF management is the identification of risk factors, and de-velopment of accurate prediction models. Risk stratification helps identifying patients who are most likely to develop POAF, and therefore most likely to benefit from targeted prophylactic treatment, thereby improving patient outcomes and reducing healthcare costs.
Several risk scores have been proposed for predicting the development of POAF, based on common risk factors that are significantly associated with the occurrence of the ar-rhythmia in their respective derivation cohorts (Table 3.1). Even though the predictive value of some of the models is reasonably good, they cannot be considered strong models, limiting their clinical application in risk stratification. Moreover, as in AF unrelated to surgery [43, 44, 68, 69], increased age is the only characteristic that has been consistently linked to an increased risk of POAF across all studies [6, 70–73]. The operation type has also been found to be a risk factor of POAF, although this has not been tested in some models [70, 71]. Importantly, no risk stratification has been performed in non-cardiac surgeries, further limiting the generalisability of the models to all surgery types.
Because structural factors, such as fibrosis, scarring, and dilatation of the atria, are pre-dispositions to POAF, it has been hypothesized that electrophysiological measurements before surgery may help predict the development of the arrhythmia. Since then, over 25 ECG features extracted from the either P-wave or heart rate variability (HRV) have been proposed (Table 3.2). As the P-wave reflects atrial depolarization, the site responsible for the arrhythmia, it has been the most extensively studied component.
Table 3.1: Risk models for the prediction of incident atrial fibrillation after cardiac surgery.
Study Model inputs Notes
Predic-tive value: c-statistic Mathew
et al. [6]
• Age
• Medical history of AF or COPD • Valve surgery
• Withdrawal of beta-blockers or ACE inhibitors
• Beta-blockers or ACE inhibitor treatment (pre- and/or postoper-atively)
• Postoperative potassium supple-mentation or nonsteroidal anti-inflammatory treatment
• The study also modeled a risk score for recurrence of AF and for the complications of POAF. 0.77 Helgadottir et al. [72] • Age • Operation type • Standard EuroSCORE
• Patients with preoperative history of AF were excluded • No cross-validation was
per-formed. 0.74 Mariscalco et al. [73] • Age • Emergency operation • Preoperative aortic balloon • Left ventricular ejection fraction
< 30%
• Glomerular filtration rate < 15mL/min or dialysis
• Heart valve surgery • COPD
• The modeled POAF score was also predictive of hospital mortality.
0.65
Chua et al. [71]
• CHADS2: congestive heart fail-ure, hypertension, age > 75 years, type 2 diabetes, and previous stroke or transient ischemic at-tach (doubled).
• CHA2DS2-VASc: congestive heart failure, hypertension, age > 75 years (doubled), type 2 diabetes, previous stroke, transient ischemic attack or thromboembolism (doubled), vascular disease, age 65-75 years, and gender
• These scores were previously recommended and studied to guide antithrombotic therapy in patients with AF or atrial flutter. Each of the factors that can lead to atrial enlarge-ment.
• No validation using the area under the receiver-operating curve was performed.
n\a
AF, atrial fibrillation; ACE, angiotensin-converting enzyme; CI, confidence interval; COPD, congestive obstructive pulmonary disease; ECG, electrocardiogram; ms, milliseconds; n/a, not available; POAF, postoperative atrial fibrillation.
Even though some of the proposed methods have reached relatively good predictive values in terms of accuracy (the root mean square of the last 20ms of the signal-averaged P-wave combined with the signal-averaged P-wave duration provided the best result with an accuracy of 83% [74]), they are not sufficiently reliable for clinical use. Furthermore, due to the lack of a standard definition of P-wave onset and offset, P-wave time domain methods cannot be easily compared [23]. Nevertheless, the results obtained using these time domain indices are of clinical interest. Frequency domain indices and heart rate variability metrics have not shown to be usefulpreoperative predictors of POAF.
Table 3.2: Preoperative electrocardiogram-based methods for prediction of postopera-tive atrial fibrillation. These include P-wave and heart rate variability features in time, frequency and time-frequency (wavelet) domain.
ECG-component Feature domain Feature
P-wave
Time
Signal averaged duration [75–77] Duration [78–85]
Isoelectric interval [76, 80]
Signal-averaged root mean square [74] Root mean square [84]
Terminal force [76] Spatial velocity [76] Dispersion [78, 79, 81–83] Amplitude [81, 82, 85] Variance [78] Area [85] P-axis [81] PR interval [81, 85]
Frequency Signal-averaged power [84, 86] Time-frequency Mean and maximum energy [87]
Heart Rate Variability
Time Mean [88] SDRR [88] rMSSD [88] NN50 [88] pNN50 [88] TINN [89] Triangular index [88]
Embedded spectral entropy [88] Frequency LF/HF [88]
3.2
Prediction of atrial fibrillation
Efforts to predict the imminent onset of AF started with the Computers in Cardiology 2001 challenge [90], which had the objective of developing a fully automated method to classify ECG signals as corresponding to just before the onset of paroxysmal AF or not. The developed methods mostly focused on the detection of atrial premature complexes using the inter-beat intervals [91–95] and heart rate variability metrics [91, 96–99], with a only single approach considering the QRS-complex morphology [96]. Even with a small dataset, results were insufficient and lacked accuracy (the best study achieved an accuracy of 80%).
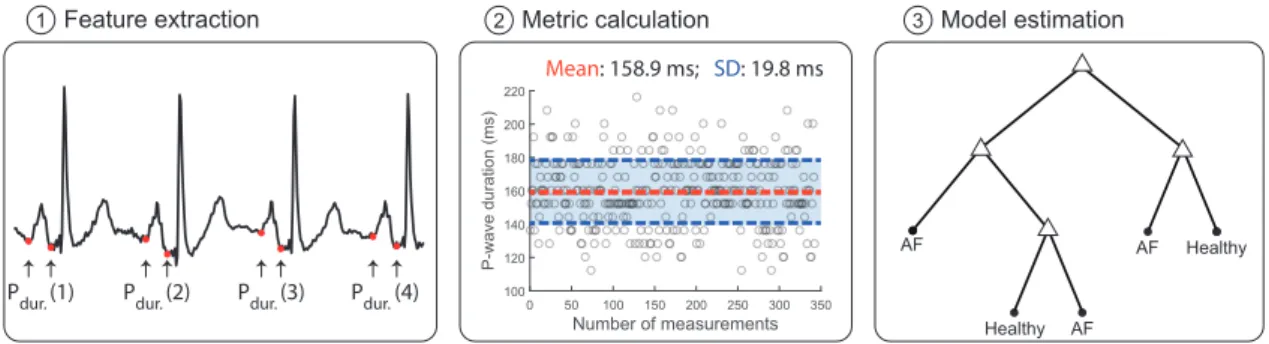
Most recently, studies have investigated beat-to-beat analyses of the ECG during con-tinuous monitoring, thus enabling real-time clinical prediction of AF. These methods can be divided into three stages, as depicted in Figure 3.1 and illustrated in Figure 3.2.
Model
estimation
Metric
calculation
Feature
extraction
ECG
Prediction
of AF
Figure 3.1: The three stages of atrial fibrillation (AF) onset prediction techniques, that perform beat-to-beat analyses of the ECG. Even though these methods have focused on the electrocardiogram (ECG) signal, they could also be applied to other signals.
Pdur.(1) Pdur.(2) Pdur.(3) Pdur. (4)
Mean: 158.9 ms; SD: 19.8 ms
AF Healthy AF
Healthy AF 1 Feature extraction 2 Metric calculation 3 Model estimation
0 50 100 150 200 250 300 350 Number of measurements 100 120 140 160 180 200 220 P-wave duration (ms)
Figure 3.2: Illustration of the three stages of atrial fibrillation (AF) prediction algorithms. These techniques start by delineating the electrocardiogram signal and extract features (e.g. P-wave duration, as depicted). Then, those features are summarised into metrics (e.g. mean and standard deviation, as depicted, or more complex variability measurements), that are used to estimate models.
3.2.1 Feature extraction
The feature extraction stage derives a set of features from each beat of the ECG signal. Most studies have focused on the P-wave’s intervals and morphology.
This stage relies on the identification of the ECG fiducial points. The initial step, common to all techniques, is the identification of the R peak of the QRS complex [100, 101]. This allows the calculation of several heart rate variability (HRV) metrics. The delineation of the P-wave was performed either using the dyadic wavelet [102, 103] or
phasor transform decomposition [104], with both methods showing high delineation accuracy. The use of such automated delineator allows not only the characterization of the P-wave, but also mitigates the lack of standard definition of the P-wave onset and end. Finally, several features are extracted using the P-wave fiducial points and signal.
3.2.2 Metric calculation
The metric calculation step, common to all methods, extracts several indices from each feature’s time-series over a determined period of time (Table 3.3). This summarises each time-series of feature measurements as a single metric. Extracted metrics ranged from simple statistical metrics such as the mean, to more complex variability measurements.
3.2.3 Model estimation
This final step makes use of the previously calculated metrics to create a model to assess the likelihood of developing AF. Studies have relied on machine learning approaches, using the statistically significant metrics as inputs to the algorithms (Table 3.3).
Even though these studies have shown interesting and positive results, they rely on relatively small populations. Furthermore, the majority of the studies have based their models on signals from a time-frame too close to the onset of AF, which would not provide sufficient warning time for prophylactic treatment to be administered and take effect. Nonetheless, these studies have achieved encouraging results.
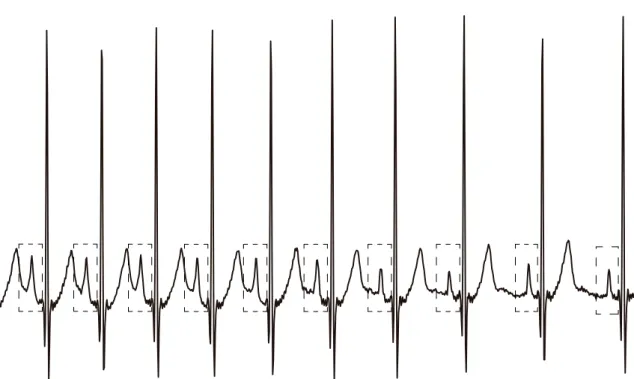
Overall, the beat-to-beat analyses have studied the variability of the extracted ECG features, and have obtained high prediction performance (with accuracy ranging from 70% and 100%). These studies have found that patients who will develop AF have greater variability in P-wave morphology and time-intervals (Figure 3.3) [25–27, 105, 107, 108], and that this variability increases as the onset approximates [25, 26, 105, 107, 108]. These subtle P-wave alterations are according to the atrial electrophysiological changes that precede AF, and suggest intermittently disturbed atrial conduction in patients close to start of the arrhythmia [25].
3.3
Conclusion
Prediction of POAF is preferable in the preoperative period because it allows the adminis-tration of drugs earlier. Indeed, the 2016 ESC guidelines recommend the adminisadminis-tration of beta-blockers or amiodarone in the perioperative period [55]. However, results in pre-operative risk stratification are limited. In contrast, recent studies have indicated that the prediction of POAF in the postoperative period is more promising, as these researches have obtained greater prediction performances (Table 3.3).
Even though considerable progresses have been achieved in the postoperative predic-tion of AF, no technique reliable for autonomous clinical integrapredic-tion has been proposed yet. Further work is required to improve the prediction of POAF from continuous and
Table 3.3: Studies that have performed beat-to-beat analyses of the electrocardiogram for predicting several types of atrial fibrillation, which would be suitable for use in continu-ous postoperative monitoring.
Study Cohort dimension Time before AF onset ECG
features Used metric
Model (accuracy) Martinez et al. [25] 24 PAF + 28 healthy 2h • P-wave intervals • Heart rate Linear regression slope of the vari-ability Linear dis-criminant (90.8 %) Martinez et al. [26] 46 PAF + 53 healthy 2h • P-wave
morphol-ogy: area, con-duction velocity, arc-length
Linear regression slope of the vari-ability Decision tree (86 3%) Martinez et al. [105] 46 PAF + 53 healthy
2h • Gaussian fit
pa-rameters (A,C, W) and error
Linear regression slope of the vari-ability Stepwise dis-criminant analysis (86.7 %) Soviljet al. [24] 14 POAF + 36 healthy 48h after CABG • P-wave intervals • Heart rate • Wavelet energies and entropy Cumulative rank with statistically significant features Decision tree [ap-plied over the time-course] (85.3 %) Ovreiuet al. [106] 37 POAF + 53 healthy 30m • Number of
prema-ture atrial com-plexes • HRV: mean, SDRR, rMSSD, to-tal power, LF/HF, entropy • P-wave duration, amplitude, shape, inflection point, energy ratio
Mean value Neuro-fuzzy
(70.0 %)
Martinez
et al. [107]
46 PAF 2h • P-wave intervals
• P-wave area, arc-length Central tendency measurement Decision tree (90.0 %) Alcarazet al. [108] 46 PAF + 53 healthy 2h • P-wave frequency energies Linear regression slope of the vari-ability Stepwise dis-criminant analysis (80.0 %) Censiet al. [27] 73 pers. AF + 20 healthy
n/a • P-wave duration
and dispersion • P-wave morphol-ogy: polarity changes, frag-mented conduc-tion index • P-wave variabil-ity: amplitude dispersion index, correlation coeffi-cient, DTW
Mean value Receiver
oper-ating charac-teristic curves (without cross-validation) (100.0 %)
AF, atrial fibrillation; CABG, coronary artery bypass grafting; PAF, paroxysmal atrial fibrillation; POAF, postoperative atrial fibrillation; pers., persistent; n/a, not available; DTW, dynamic time warping.
95ms
94ms 94ms 94ms 96ms 94ms 95ms
117ms 128ms 105ms 123ms 132ms 116ms 118ms 107ms 119ms 109ms
Healthy subject
Patient before paroxysmal atrial fibrillation
Figure 3.3: Example of representative ECG signals corresponding to healthy sujects (top) and patients susceptible to paroxysmal atrial fibrillation (PAF; bottom). Patients who will develop PAF are characterised with higher variability in P-wave duration (and other time and morphological features) than healthy subjects. Adapted from Alcarazet al. [109].
unsupervised monitoring in the clinical setting. Specifically, at least three aspects need to be considered:
1. Systematic comparison of predictive methods. Although the majority of the pro-posed predictive techniques have achieved high accuracy, it is not clear which method, if any, is most suitable for clinical use. Moreover, it would be useful to in-vestigate whether combining multiple indices provides improved prediction ability. 2. Evaluation of predictive methods in clinically useful scenarios. The majority of
studies have studied the two hours before the onset of AF, which might be too late for prophylaxis. Furthermore, these studies have only used ECG signals during sinus rhythm, not having considered other rhythms that are common in the postoperative period, such as tachyarrhythmias or bradyarrhythmias [110]. Hence, it is necessary to test the prediction of POAF under clinically relevant and useful scenarios that mimic the real world clinical setting, and at a time before POAF where it is still possible to administer efficient prophylactic treatments.
3. Adaptation for unsupervised use during continuous monitoring. ECG data, espe-cially when acquired during continuous monitoring, is susceptible to several arte-facts that can lead to inaccurate measurements and consequently to a high number
of false alarms. This is particularly important in P-waves, which are highly suscepti-ble to noise. Most studies have excluded noise-corrupted P-waves manually, which is not feasible in the clinical setting. Hence, the development of an automated P-wave quality assessment tool to discriminate between high quality and unreliable P-waves is needed to ensure the accuracy of techniques that predict AF.
Hence, several important aspects need to be considered so that the prediction of AF might be performed in the unsupervised clinical setting.
C
h
a
p
t
4
P- wav e Q ua l i t y I n d e x
This chapter presents and assesses the utility of the P-wave Quality Index (PQI), a tool which automatically identifies artefact-corrupted P-waves. Firstly, the PQI tool is de-scribed, and three different versions are proposed. The performance and utility of each of the three was assessed, and the version showing the highest performance and utility was selected to constitute the final PQI tool. Performance was assessed using its ability to discriminate between high and low quality data. Utility was assessed using: 1) mean absolute error comparisons of several well-known P-wave features with and without the PQI; and 2) evaluation of performance for predicting atrial fibrillation (AF) by using metrics extracted from the P-waves with and without the PQI.
4.1
Introduction
Long-term continuous monitoring using wearable devices has enabled early identification of several types of arrhythmia. A challenge to the use of long-term monitoring, where data is normally collected without clinical supervision, is ensuring that only high quality signals are used to derive clinical measurements. Physiological parameters extracted from artefact-corrupted signals may be inaccurate, which can lead to a high frequency of false alarms [111]. Therefore, assessment of signal quality is a crucial step before accurate and precise data analysis, such as extracting features, identifying deteriorations, and generating alerts.
The study of P-waves from surface electrocardiogram (ECG) is especially important in atrial arrhythmias, such as AF. For instance, subtle alterations in P-wave morphology have been found to be predictive of AF [23, 25–27]. The relatively low amplitude of the P-wave makes it highly susceptible to noise, severely affecting the extraction and quantification of its features, and hindering its clinical applications, especially in long-term recordings.
As artefact-corrupted P-waves influence derived measurements, it is essential to clude them. This has been performed either manually, where expert cardiologists ex-cluded unreliable P-waves by hand [25, 26], or automatically, with a conventional template-comparison method [112]. In the latter, individual P-waves were discarded if they had a cross-correlation coefficient lower than 0.7 with a template P-wave obtained with an av-eraging procedure [27]. Despite being promising, the methodology was not described in depth, and the threshold used to identify low quality P-waves was not optimized, limiting its reproducibility and utility.
Currently, even though much focus has been placed in the creation of methods that use P-waves to predict atrial arrhythmias, there is no reliable tool that assesses P-wave quality automatically. Thus, the clinical utility of such methods could be highly limited by parameters being estimated erroneously from low quality P-waves, causing false alerts. We propose a novel P-wave quality assessment tool to discriminate between high quality and unreliable P-waves, and assess its performance and utility on a database of wearable ECG recordings.
4.2
Methods
4.2.1 Data description
The Computers in Cardiology 2001 challenge database (AFPDB) [90, 113] was used to de-velop and assess the performance of the PQI [90]. This database was originally assembled with the aim of developing techniques for predicting paroxysmal AF (PAF). It consists of a learning and testing set, both of 100 records, with each record lasting 30 minutes. All signals have a sampling frequency of 128Hz and a 12-bit resolution. The database contains three different subject types: healthy controls, PAF patients far away from the arrhythmia onset (no episode 45 minutes before or after the record), and PAF patients just before the arrhythmia onset.
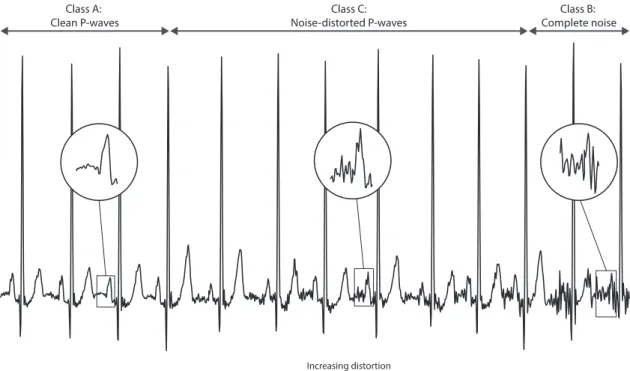
Forty four records (23 from controls and 21 from PAF patients) were randomly se-lected from the training select, after exclusion of those records which did not have dis-cernible P-waves. After pre-processing with a bandpass filter with cut-off frequencies of 0.5 and 40Hz, the ECG lead in which P-waves were most visible for each record was chosen, and P-wave quality was manually annotated and double-checked. Following the tool’s methodology (described bellow), P-waves were classified into three distinct classes, as illustrated in Figure 4.1.
Class A: High quality clean P-waves;
Class B: Complete noise and absent P-waves. This included P-waves withno resemblance
to normal P-wave morphology, either due to motion artefacts, severe baseline wan-der, muscular activation interference, or simply the absence of a P-wave;
Class C: Unreliable, noise-distorted P-waves. This included P-waves that hadsome resem-blance to normal P-wave morphology, but were still unreliable (i.e., their
morphol-ogy was still excessively affected by noise). The degree of distortion varied from mildly to heavily distorted (see Figure 4.1).
This resulted in 22 hours of recording, corresponding to 97,989 P-waves: 88,606 class A (90.4%), 5,102 class B (5.2%), and 4,281 class C (4.4%). PAF patients had a higher proportion (p<0.05) of class B P-waves than controls, as compared using a two-sample
t-test.
Class A:
Clean P-waves Noise-distorted P-wavesClass C: Complete noiseClass B:
Increasing distortion
Figure 4.1: P-waves were classified into three different classes: high quality clean P-waves (class A), complete noise or absent waves (class B), and unreliable, noise-distorted P-waves (class C). Even though class C P-P-waves had some resemblance to normal P-wave morphology, they were still considered unreliable. For that class, the degree of distortion varied from mildly to heavily distorted.
4.2.2 P-wave Quality Index algorithm
The PQI tool algorithm is depicted in Figure 4.2. Briefly, the process started with P-wave detection and signal extraction, and was followed by two different decision-making stages based on template-comparisons. The first decision stage aimed to remove P-waves with no resemblance to the normal P-wave morphology (class B), while the second was more refined, removing P-waves still excessively distorted by noise, and hence unreliable (class C).