DETERMINANTS OF VAT RATE: EVIDENCE FROM 27 EU
COUNTRIES
Manuel Costa Pereira São Martinho
Dissertation submitted as partial requirement for the conferral of MSc in Business Administration
Supervisor:
Prof. Doutora Sofia Sousa Vale, Assistant Professor, ISCTE Business School, Department of Economics
DETERMINANTS OF VAT RATE: EVIDENCE FROM 27 EU
COUNTRIES
Manuel Costa Pereira São Martinho
Dissertation submitted as partial requirement for the conferral of MSc in Business Administration
Supervisor:
Prof. Doutora Sofia Sousa Vale, Assistant Professor, ISCTE Business School, Department of Economics
Acknowledgements
The completion of my dissertation was something that felt really well after all the work it has demanded. In fact it was gratifying to be possible to perform a study about a theme that always kept my interest since I was a teenager.
It was for sure not an easy step in my life as it was most of the times hard to conciliate thesis with the exigency of my professional life. The support of my family, friends and colleagues was essential and cannot be forgotten.
The first person from the list that I have to thank to is Sofia Vale, which was a supporter, guider and motivator. This help was fundamental to start, improve and finish the work. Thank you very much!
Thank you family for giving me a big help when advising me about the deadlines and by helping me on keeping focused on what I was doing every single time.
A huge thank you to all my friends that helped me at any step of the dissertation. A special thanks to Artur Nunes for the kick start and Nuno Alvito and Sophie Warning for going along with me through this process.
The mutual aid and share of knowledge between colleagues from the Master in Business Administration and also from some ex-colleagues from my Bachelor in Economics should not be forgotten either.
Unfortunately I had to give up some time together with my friends and family in order to focus on the dissertation, but I can say that it was for a good reason.
Abstract
Tax rates have become a matter of public discussion since the 20th century. On one side population wants to maximize its utility by having a good purchase power that allows it to afford a basket of products and services that make it possible to have a good quality of life and. On the other side, government wants taxes to be on a level that maximizes tax revenue at the same time that it respects the interests of their people.
Nowadays, Europe faces a situation of country convergence in a broad number of economic, social, and political factors. This convergence is caused or stimulated by the European Union
legislation, by the interest of each country and also by automatic adjustments on people’s behaviour. One should note that the free mobility of goods, services, people and capital as well as the
implementation of a common currency, for the applicable cases, is something that changed the path of Europe. When speaking about Europe one means countries, people and companies. Therefore, it is important to study the new trends of taxes and, more specifically, Value Added Tax.
In order to perform a complete study for the European Union, this thesis compiles data from the 27 European Union countries from the year 2005 to 2012, for which 15 different variables related to different fields are used. The results indicate that a rise in Consumption raises the VAT Rate, while rises in Compliance Rate and GDP per capita lower the VAT Rate instead.
Resumo
Os impostos tornaram-se uma questão de discussão pública desde o século XX. Por um lado, a população quer maximizar a sua utilidade e obter um bom poder de compra que lhe permita adquirir um cabaz de produtos e serviços que que ofereça uma boa qualidade de vida. Por outro lado, o governo quer definir os impostos a um nível que maximize a receita fiscal ao mesmo tempo que respeita os interesses do seu povo.
Hoje em dia, a Europa enfrenta uma situação de convergência num leque abrangente de
factores económicos, sociais e políticos. Esta convergência é causada ou estimulada pela legislação da União Europeia, pelo interesse de cada país e também por ajustes automáticos sobre o comportamento das pessoas. É de salientar que a livre mobilidade de bens, serviços, pessoas e capitais, bem como a implementação de uma moeda comum, nos casos aplicáveis, é algo que mudou o rumo da Europa. Por Europa entenda-se países, pessoas e empresas. Deste modo, é importante estudar as novas tendências dos impostos e, mais especificamente, do Imposto sobre Valor Acrescentado.
De modo a realizar um estudo completo para a União Europeia, esta tese compila dados dos 27 países da União Europeia, entre os anos 2005 e 2012, com a utilização de 15 variáveis de diferentes áreas.
Os resultados indicam que um aumento no Consumo tem como efeito um aumento na taxa de IVA, enquanto aumentos nas taxas de Complacência e do PIB per capita têm como efeito a
diminuição da taxa de IVA.
List of abbreviations
CR – Compliance Rate CPI - Consumer Price Index EU – European Union
GDP – Gross Domestic Product GMM – General Method of Moments IMF – International Monetary Fund
OECD – Organization for Economic Co-operation and Development VAT – Value added Tax
Index
1. Introduction………..….... 1 2. Literature Review……… 3 2.1 Broad view………... 3 2.2 Neighbours VAT……….. 3 2.3 Compliance Rates……… 42.4 Number of Different Rates……….. 6
2.5 Population……… 7 2.6 Number of years……….. 7 2.7 GDP………. 7 2.8 Consumption/Investment………... 8 2.9 Inflation……… 8 2.10 Unemployment……….. 10 2.11 Elections……… 11 2.12 Corruption………. 12
3. Data Sample and Methodology……….. 13
3.1 Data Sample………. 13
3.2 Methodology……… 13
4. Variables and Hypotheses Summary………. 14
5. Tests, Results and Interpretations……….. 19
5.1 Tests………. 20
5.2 Results……….. 22
5.3 Interpretation……….... 24
6. Conclusion……….... 26
6.1 Final Remarks……….. 26
6.2 Limitations and Future Research………... 27
7. References………... 29
Table 1: Explanatory variables and hypotheses summary ... 14
Table 2: Statistical summary ... 15
Table 3: Cross-year sample statistical summary ... 16
Table 4: Linear regression model ... 21
Table 5: Xtabond2 - Final model ... 23
List of Figures
Figure 1: The Laffer curve ... 6Figure 2 : Substitution effect of consumption ... 9
Figure 3: Evolution of Consumption and VAT Rates ... 17
Figure 4: Evolution of Compliance Rate and VAT Rates ... 18
Introduction
VAT is the abbreviation for Value Added Tax. It is a type of indirect and consumption tax. Generally, it is used on domestic consumption of goods and services, except for goods and services that are zero rated or exempt. It is levied at each stage in the chain of production and distribution from raw materials to the final sale based on the value added by each stage.
The invention of VAT is credited to a German businessman named Wilhelm Von Siemens, which has come up with this concept idea around 1920. His idea was developed and put into practice by Maurice Lauré, who was the joint director of the French tax authorities and was entitled as the father of VAT. This type of tax was firstly implemented in France in 1954 and until 1960 only ten countries had implemented a VAT system. In 1965 it was not yet a worldwide success because of the fact that many OECD countries had implemented retail sales taxes instead. By 1989, already 48 countries, mostly located in Western Europe and Latin America had adopted VAT. The spread to Europe was driven by the fact that it was a pre-requisite to become a member of the European Union. By 2014 VAT systems have been implemented in more than 160 countries all over the world,
including all the 28 EU countries. Croatia recently joined the EU (in 2013) and already has this tax implemented, as well1.
The purpose of this dissertation is to study if there are economic, social or political factors that have a significant statistical impact on the variation of the VAT Rates in EU countries and, if so, which ones. This idea emerged from a need to explain how governments define tax rates, under which circumstances governments are likely to change rates and also because of the lack of studies in this field.
Data was gathered from 27 European Union countries for the period between the years 2005 and 2012. Fifteen different variables have been included to perform our panel data analysis. The main results point to a statistical significance for the variables Consumption, Compliance Rate, and GDP per capita. Consumption is the variable statistically more significant and an increase in it tends to lead to an increase in the VAT Rate. Contrary, rises in Compliance Rate and GDP per capita lead to a rise in VAT Rate.
The current thesis is organized as follows. In the second chapter there is presented a Literature Review based on Empirical Evidence and it is organized by the type of possible determinant of VAT Rate. It is followed by chapter three which introduces the Data Sample, Methodology and Hypothesis. Afterwards, chapter four presents a detailed analysis of Descriptive Statistics. Chapter five shows the Tests, Results and the main Interpretations. The sixth chapter has the purpose of gathering all the
1
analysis and interpretations, as well as consolidating them as final remarks and opening the door for possible future researches. It is finalized by two chapters with References and Appendixes for additional information.
Literature Review
Broad View
Nowadays, governments all over the world face the dilemma of whether or not to change taxes or the specific legislation. The EU has particular legislation for all the State Members, which is
mandatory for each one to follow. These tax rules are material that the governments have to take into consideration while choosing the actions to take, as was referred in the previous paragraph. The purpose of this Literature Review will be to focus on the variables that are potentially explanatory on the government tax decisions and which may vary from country to country. As the spotlight of this thesis is the VAT standard rate, it is important to shape some of the key rules imposed by the Tax Directives of the Council of the EU. According to the Directives, the standard rate of VAT, until 31st of December 2015 should not be less than 15% (2010/88/EU) and any State Member can apply reduced rates as long as they are not lower than 5% (2006/112/EC of 28 November 2006 amended by 2009/47/EC of 5th of May 2009). The countries may also introduce reduced rates over certain types of food, water supplies, pharmaceutical products, medical equipment, transportation, accommodation and etcetera. Certain countries, due to specific needs, are also authorized to use special rates even lower than the minimum established for the reduced rate, sometimes even zero rates. For example in France, some of the goods supplied in Corsica are taxed by 2,10% and in Finland the Aland Islands are exempt of VAT. There is even a VAT Committee that will provide consultancy to every country and decide if the assumption that support these exceptions are valid.
As there are not published studies about the factors that influence the VAT Rate establishment in a country, it was decided to go wider and include studies in which the authors refer to a relationship between VAT Rate and economic, social or political factors. Some of the factors may be related with each other and, therefore, have to be studied as a whole.
Neighbours VAT
The countries that surround a specific country are good potential candidates to have an impact on the decision of the VAT Rate to be used in that country. This is caused by the fact that the huge majority (19 out of 28) of the European Union countries are under Schengen’s Agreement. With the free movement across the borders, consumers are induced to buy products and services abroad if the differences in VAT Rates are large enough to cover their travel costs (Ohsawa, 2001). Therefore, it is important to study if a tax rate harmonization really exists across these countries and, more
specifically, to study if there is a tax rate relationship defined by neighbourhood physical boarders or just by proximity. This decision might occur when governments are concerned about avoiding the
consumers to take advantage of different tax burden between different available markets, practice known as arbitrage. Tax neutrality is the concept that states that the taxation systems should treat goods and services’ income equally, so that the market decisions are based on economic merits instead of taxation (Whittington and Prebble, 2012). In theory, this tax concept is covered by the Tax
Directives of the EU, already mentioned previously.
Lockwood and Migali (2009) performed studies together related to the effects of tax
competition after the introduction of the Single Market in EU in 1993. For that purpose, the authors used data from 12 EU countries over a period of 17 years (from 1987 to 2004). They were testing the presence of strategic interaction among neighbour countries when setting tax rates. This work was performed based on an equation in which the level of taxes on a specific country depends on the tax level of its neighbours and it utilized the tax rates as dependent variables. The authors follow the hypothesis that the strategic interaction between the countries was influenced by the length of the border and also by the population sizes. At the end of the analysis, it was possible to conclude that the introduction of the Single Market has modified tax setting among the EU countries, as there was spotted a structural break between the data before and after 1993.
Compliance Rates
A research on the VAT gap on cross-section observations performed by Agha and Haughton (1996), which in 1987 analysed 17 OECD countries, concluded that a higher VAT Rate is associated with lower Compliance Rate. They found out that 1% increase in VAT standard rate would reduce the Compliance Rate by approximately 2,7% The authors also found evidence of other significant factors that would have an impact on the Compliance Rate, such as:
1. The number of VAT Rates applied in a country, where an additional VAT Rate would reduce the Compliance Rate by around 7%;
2. The total population of the country, where a smaller country in terms of population would tend to have a higher VAT Compliance Rate;
3. The length of time that VAT has been applied in one country, a case in which a country that had VAT already implemented for more years ago would have higher Compliance Rate. According to the studies of Christie and Holzner (2006) on “concealed consumption” and using data of EU countries between the years of 2000 and 2003, a higher weighted average VAT Rate reduces VAT CR, while higher judicial and legal effectiveness of the state have the opposite effect.
Reckon (2009), with the purpose of studying the VAT gap in the EU, performed an
econometrical analysis to identify specific characteristics of each country that could be related with the level of VAT gap. The main conclusion of this study was that a lower perceived corruption is associated with lower VAT gap.
Aizenman and Jinjirak (2005) studied VAT Compliance Rates by using the “C-ratio efficiency” formula, computed as follows:
𝐶 − 𝑟𝑎𝑡𝑖𝑜 = 𝑉𝑅⁄𝐶𝑜𝑛𝑠𝑢𝑚𝑝𝑡𝑖𝑜𝑛𝑟 (1)
In which “VR” stands for VAT revenues, “Consumption” is the final consumption of the households, of the non-profit organizations serving households, and also of the government. At last, “r” is the VAT standard rate. By the study of the C-ratio, the authors could conclude that there is a positive correlation between the openness of an economy and the C-ratio dependent variable, which validates the findings that VAT from imports are more easily collected. Also positive correlations were found with GDP per capita and the stability of the political system. Likely to the C-ratio analysis, Bodin et al. (2001) did an econometrical analysis using a dependent variable that was denominated as VAT revenue ratio, computed as follows:
𝑉𝑅𝑅 = 𝑉𝑅𝐵.𝑟 (2)
In which “VR” is VAT revenues, “B” stands for the final consumption of households, non-profit organizations serving households and governments, and finally “r” is the standard rate of VAT. The same positive correlation between an older date of establishment of the VAT system in the country and the Compliance Rate, already stated by Agha and Haughton (1996) was found. The explanation that Bodin et al. (2001) suggested for this occurrence was based on the fact that countries would have more experience with the tax system and there would also occur an abolishment of various exemptions.
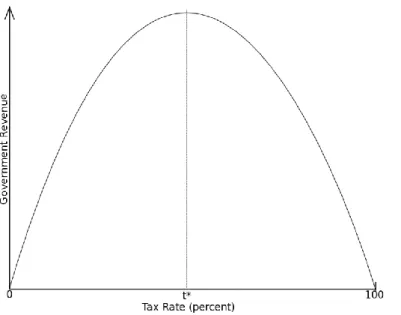
When talking about CR, it is also important to refer the Laffer curve and its implications. “The Laffer curve illustrates the basic idea that changes in tax rates have two effects on tax revenues: the arithmetic effect and the economic effect. The arithmetic effect is simply when tax rates are lowered, tax revenues will be lowered by the amount of the decrease in the rate. The reverse is true for an increase in tax rates. The economic effect, however, recognizes the positive impact that lower tax rates have on work, output, and employment — and thereby the tax base — by providing incentives to increase these activities. Raising tax rates has the opposite economic effect by penalizing participation
in the taxed activities”, therefore high tax evasion can occur. According to Laffer (2004), “The arithmetic effect always works in the opposite direction from the economic effect. Therefore, when the economic and the arithmetic effects of tax-rate changes are combined, the consequences of the change in tax rates on total tax revenues are no longer quite so obvious.” In figure 1 below the Laffer curve is shown.
Figure 1: The Laffer curve shows the impact of the evolution of the tax rates on government revenue.
Number of Different Rates
Agha and Haughton (1996) have mentioned the impact of having different VAT Rates rather than a single one in a country would have on tax revenues. However, there are several other authors referring to the importance of these rates, using this variable for totally different approaches. Keen and Smith (2007) state that “Multiple rates create scope for misclassification fraud (…) Moreover, where rate differentials are sufficiently large they can also give rise to refund entitlements for some traders (those using inputs taxed at a high rate to produce outputs subject to a low rate of VAT), which, in turn, creates opportunities for fraudulent abuse. Although a reduced rate of VAT is the most elegant way of taking account of distributional considerations in the design of a VAT (since it avoids the production inefficiency associated with the taxation of inputs implied by exemption), it has the disadvantage of extending the scope of the refund problem beyond exports.” Keen and Smith (2007) also defend that frauds become more attractive when the VAT Rate is higher, as they see it as a fact that encourages informality to happen. In fact, at the same time that higher rates raise the
unrecovered tax that informal operators will bear on their inputs, they also increase the output prices that these are able to charge while still undercutting formal operators.
Population
The variable ‘Population’ (already introduced by Agha and Haughton, 1996) was utilized by
Cizek et al. (2012) to study the correlation of a country having or not having done an adoption of VAT system. As it was expected the Population growth would have a positive effect on belonging to the group of countries that adopted VAT. Miki (2011) also referred to population growth, stating that a higher percentage of population growth leads to lower GDP growth per capita, ceteris paribus2. As this last author points out, Population can be a good variable to make the bridge between GDP and GDP per capita.
Number of years
Agha and Haughton (1996) stated that there exists a positive correlation between the age of the VAT system in one country (the number of years since its implementation until now) and an increase on tax revenues. The EU could be good to perform a similar study, since the countries joined EU at different times. It may be possible to find a relationship between the number of years that passed since a country joined the EU and the actual VAT Rate.
GDP
As VAT is an indirect and consumption tax, it is important, at first, to search studies that relate general taxes with GDP, consumption taxes with GDP, indirect taxes with GDP and go deeper into studies that try to explain the relationship between the specific case of VAT and GDP.
As it was mentioned before (stated in the CR study), Laffer (2004) referred to an interesting relationship between output (same as GDP) and tax revenues, where a lower tax rate would have a positive impact on tax revenues. Mendoza et al. (1995 and 1997) discovered a positive correlation between consumption taxes and economic growth. Meanwhile, the European Commission (2006) collected data of the OECD countries and found a positive correlation between the ratio of indirect and direct taxes and economic growth. These are relevant outputs to take into consideration if one uses GDP as explanatory variable.
Previous studies on the VAT changing field in Kenya have stated a positive correlation between tax revenues and GDP (Warwire, 2011). There is also the example of Romer and Romer (2007), where the authors stated that tax revenues rise and fall with GDP automatically because many
taxes are a function of income or expenditure. Also Addison and Levin (2008) concluded that an accelerated development is in itself an important determinant of tax revenue and that growing levels of per capita income lead to a rise on the share of tax revenue in national income.
Adesina et al. (2011) studied the possible existence of a link between GDP and VAT revenue applied to the specific case of Nigeria. Their model stated a positive and significant correlation between VAT Revenue and GDP. The authors performed a regression analysis on E-Views, based on data from the period between 1994 and 2008. The results showed an increase on VAT Rate increased also the GDP. It could be interesting to verify if there is a relationship between these results and the ones of the model developed in this thesis for 27 EU countries, which are more developed countries and have different characteristics comparing to Nigeria.
GDP is one of the variables that is often related with others in this Literature Review. As so, the Keynesian formula for aggregate demand should be taken into consideration:
𝐴𝐷 = 𝐶 + 𝐼 + 𝐺 + (𝑋 − 𝑀) (3)
Where “C” is consumption or consumer spending, which can also be stated as: 𝐶 = 𝑎𝑐 + 𝑏𝑐 (𝑌 − 𝑇) (4)
“Y” is the income of the consumers; “T” stands for the taxes paid by them (it should be taken into consideration that this also includes direct taxes and not only indirect, the group to which VAT belongs to); “I” is Investment; “G” is Government Spending; “X” is Exports and finally “M” is standing for Imports.
Consumption/Investment
Several authors performed analyses that trace a relationship between Consumption or Investment and VAT. Starting by Le (2013), this author referred that “(…) unlike income taxes, consumption-based VAT does not distort consumption-savings/investment decision. Being a
consumption tax, the VAT does not have discriminating effect on savings/investment because savings are essentially excluded from the consumption of VAT base”. Adisa (2011) stated that economists generally take the view that VAT encourages savings and investments because it is a tax on consumption and not income.
Miki (2011) defended that the income effect on the aggregate consumption was clearly
negative because a rise in the VAT Rate would decrease people’s dispensable income. The author also defended that, additionally to income effects, a change in the VAT Rate has a substitution effect,
which means that even if the government reduces the income tax rate in order to offset the decrease in people’s income due to the rise of the VAT Rate, aggregate consumption will change. In theory, and according to Miki (2011), if there is an announcement that the government will raise the VAT Rate, people will buy items which can be stocked before the rise of the VAT Rate. After the rise in the VAT Rate, the aggregate consumption will decline because people will use their stock instead of buying new items. Later on, the aggregate consumption will grow up gradually as people run out of their stock and need to buy new items. The movement of aggregate consumption when the VAT Rate is raised is observable in Graph 1. Similarly, the movement of aggregate consumption when the VAT Rate is reduced is visible in the Graph 2, both are shown below.
According to Miki (2011), Economic growth is expected to move as well as aggregate consumption, because the aggregate consumption is a component of GDP. Taking into account the fact that the negative (or positive) income effect of the rise (or reduction) of the VAT Rate on the change of aggregate consumption occurs only in the period just after the implementation of the rise or reduction, the sign of the income effect is the same as the substitution effect. Since economic growth is affected both by the income effect and the substitution effect, the trend is still the same. It will be similar to Graph 1 when the VAT Rate is raised and similar to Graph 2 when the VAT Rate is reduced.
Figure 2 : Substitution effect of consumption, where Graph 1 shows the consequence of a rise in VAT
Inflation
Taking into consideration the work of Le (2003), a practical experience indicates that the VAT should not be introduced when inflation is rising, otherwise, the VAT would be wrongly perceived as inflationary and become a hard sell to the public. This might be an indicator that when there is a positive rate of inflation, governments will not change the VAT Rate to a higher rate.
According to Miki (2011), an increase in the expected future price will affect current
consumption positively or negatively, depending on the relative importance of the income effect to the substitution effect. On one hand, expected inflation makes people spend less money because the real income will decrease and people want to save money for the future. This means that the income effect for this case is negative. On the other hand, inflation provides an incentive to buy things which can be stored at lower prices in the current period, what would mean that the substitution effect here is positive. As can be concluded, the effect of the change of price depends on which of these tendencies predominates. Miki (2011) also says that “Taking into account the fact that the VAT Rate is a
component of Consumer Price Index (CPI), expected inflation rate increases (or decreases) in the period just before the government raises (or reduces) the VAT Rate, because people can easily expect CPI inflation from the government’s announcement about the rise (or reduction) of the VAT Rate.” He also referred to the fact that a higher inflation rate increases the nominal GDP growth per capita due to the effect of a higher price.
Unemployment
In an Economical perspective, lower tax rates should lead to higher outputs, which should lead to a lower unemployment rate. There is evidence of many studies that took into consideration the restaurant sector as a fast job creator sector and highly correlated with tax rates, more likely to consumption taxes, like the case of VAT. This evidence will be exposed in the following paragraphs. Studies by Reinfeldt (2011) reflect that, on the 1st of January of 2012, the Swedish government decided to reduce the VAT Rate for the restaurant sector from 25% to 12%, in order to increase the employment rate and stimulating young employment. As stated by Rosen and Gayer (2010), the decision to reduce this rate was aligned to the optimal tax theorem. In this tax theorem, a sector with high elasticity should be taxed less than a sector with low elasticity. A production in a sector with high elasticity is much more likely to change into informal production or even home production rather than one with low elasticity.
purchasing power that allows them to eat out, they can cook instead. Reducing this specific VAT is assumed as having a direct impact on employment, namely increasing it. Therefore, Wikander (2013) tried to correlate a drop in VAT Rate in Sweden and its unemployment rate but could not conclude with a high level of certainty about its results. However, despite the fact that one did not have access to the studies, this author stated that there were studies performed in Finland and France for the same reason. In order to search for a correlation between VAT Rate drop and unemployment rate, these author reports that these other studies concluded that this drop would drop unemployment rate as well. Also Pereira (2013) referred to a wrong application of VAT Rate in Portugal to the restaurants sector, what was higher than acceptable, with as consequence the bankruptcy of several small
restaurants. This affected the employment and even caused a fall in VAT revenues. A study about the impact of a reduction on VAT for restaurants in Ireland was performed by O’Connor (2013) and employment gains were registered. Higher levels of consumption can also lead to a rise on outputs and, therefore, a drop of the unemployment rate.
Elections
When studying fiscal policy related themes, it is important to include political factors on our analysis. For example, Alesina et al. (1992) made a deep study on the relationship between the macroeconomic policy and elections in OECD democracies. Their purpose was to study evidence of the “political business cycle”, for which they collected data from 18 OECD economies using two specific models, one that belonged to Nordhaus (1974), which was an author referenced by them and a new rational model.
Nordhaus (1974) formalized the idea of the “political business cycle”, stating that politicians stimulate the aggregate demand before elections, in order to create fast economic growth and to reduce unemployment rate. Nordhaus also stated that the inflationary consequences of this policy are erased by a “post-electoral contraction”. Unlike the previous author, Lindbeck (1976) discovered that, by an appropriate choice of the lag structure in the Phillips Curve3, it was possible to create a model that only led to an increase on inflation after elections, without affecting the basic results. This would allow governments to play with tax cuts without having a short impact on inflation. The new
generation of “rational political business cycle models” often assumes that governments have the same utility function as private agents, however they are also “opportunistic”, as they care about winning the elections.
Bizer and Durlauf (1990) report results on the dynamics of taxes in the U.S. which claim to support a political budget cycle. They found a cyclical component to tax changes with a period of
3
eight years, which was correspondent to changes in political-party administration of the U.S. The regression analysis concluded that taxes were reduced two years before successful presidential re-election attempts.
Alesina et al. (1992) defend that both traditional and recent “rational political business cycle” models state that people should observe fiscal deficits before elections. However, they do not focus on whether the pre-electoral fiscal expansion will occur due to tax burden reduction or due to fiscal spending or both.
Corruption
Corruption is a theme that has led to several discussions within its influence in the tax system. Gupta (2007) studied the determinants of tax revenues efforts in developing countries, defining some institutional variables such as corruption, law and order, government stability and political stability. After testing these variables, it was possible to conclude that corruption had a significant correlation with tax revenue. The higher the rate of corruption, the lower the tax revenue, as it was expected. Law and order and government stability did not seem to be statistically significant, while political stability just had a weak relationship with the tax revenues results for low and middle income countries but not for high income.
A more recent study performed by Brasoveanu and Brasoveanu (2009) intended to analyse the correlation between corruption perception index and the overall tax burden in the 27 EU countries, which data period was between the years of 1995 and 2008. The results of the study performed by these authors were not perfectly conclusive, as some countries had a positive correlation, others negative and there were also cases of no correlation. Nevertheless, there seemed to be a negative correlation between corruption and tax revenues and a low coefficient of determination, when analysing the regression equation of 27 EU countries as one. The authors stated that “Even if the negative correlation between corruption and tax revenues is intuitive, the negative coefficient of correlation does not necessary imply that it exists a causal relationship of those two variables. For examples, it might be the case that a high level of corruption and a low level of tax collection rate are caused by some common external factors, such as low level of economic development and high level of poverty; in this case, the reduction of corruption does not imply an increase of fiscal revenues.” The previous authors tried to explain the negative relationship between those variables, as it follows:
1. In the case of the officials in charge of fiscal revenue collection being corrupt, the level of corruption has a direct impact on its low level of tax collection;
2. In the case of corruption reducing the tax base or reducing the level of economy activity, the final result is reduction of budgetary revenues.
Brasoveanu and Brasoveanu (2009) also referred to the fact that the companies that are
successfully working in the informal sector will have a competitive advantage in relation to the ones that pay taxes or have a higher percentage of formal activity, forcing some of them to leave the formal economy and to move to the informal sector.
Data Sample and Methodology
Data Sample
The panel data sample compiles data from 27 EU countries from the year 2005 to 2012. The reason why this was the selected period of time was to gather continuous series without breaks. Croatia was excluded from the sample because it entered the European Union afterwards, in 2013. Data was collected from Eurostat, IMF and World Bank and covers different indicators that are potentially related to the standard rates of VAT of EU countries. These indicators have economic, social, political or geographical feature and range from GDP per capita to Elections or even the influence of the tax burden from the Neighbour Countries.
Methodology
To estimate the best model to explain the variations in VAT standard rates within European Union countries, the presented literature on this subjected was followed in order to select the most adequate independent variables and make them fit together in a reasonable way. The first program that was used for estimation was Eviews, however it was dropped due to Evidence that indicated Stata to be the best program for GMM.
As data plainness is a matter of concern, the euro was always used as denominated currency and the data indexes were converted to percentages. When compiling 27 countries and eight years of data there were variables with some missing data, therefore there has been a true effort not to use variables which had data missing (ex. Activity Sector, Trade Balance, Stability of Political System and Public Debt) or that had no evolution throughout the years (ex. Number of Different Rates, Dummy of Belonging to Eurozone and Dummy of having had IMF bailout). After this selection, only 15 variables remained untouched, therefore, ready to be used.
Variables and Hypotheses
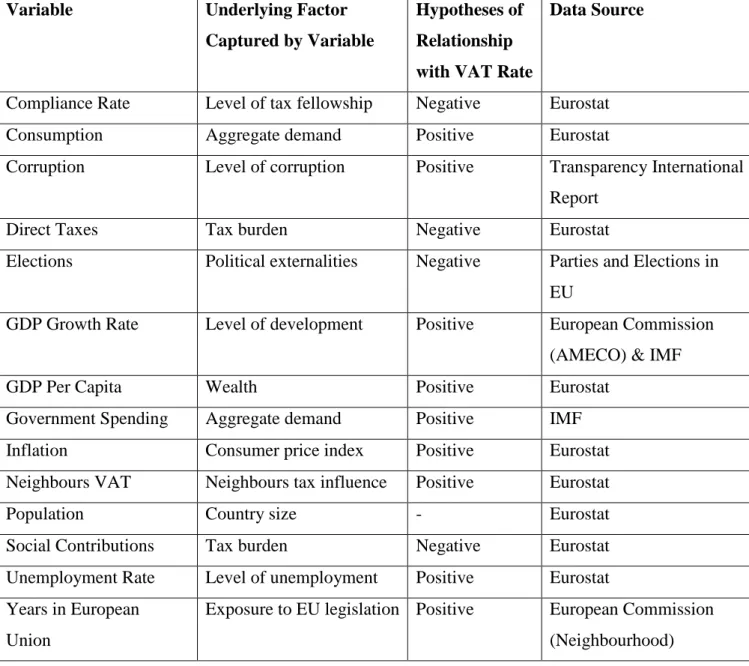
Table 1 allows one to have a full comprehension about the assumptions built based on the Literature Review and previously to the econometrical regression. The visibility of this Table shapes the fact that only four variables are expected to have a negative effect on VAT Rates. Information about the underlying factor of each variable as well as the source of data collection was included..
Table 1: Explanatory variables and hypotheses summary
Variable Underlying Factor
Captured by Variable
Hypotheses of Relationship with VAT Rate
Data Source
Compliance Rate Level of tax fellowship Negative Eurostat Consumption Aggregate demand Positive Eurostat
Corruption Level of corruption Positive Transparency International Report
Direct Taxes Tax burden Negative Eurostat
Elections Political externalities Negative Parties and Elections in EU
GDP Growth Rate Level of development Positive European Commission (AMECO) & IMF GDP Per Capita Wealth Positive Eurostat
Government Spending Aggregate demand Positive IMF Inflation Consumer price index Positive Eurostat Neighbours VAT Neighbours tax influence Positive Eurostat
Population Country size - Eurostat
Social Contributions Tax burden Negative Eurostat Unemployment Rate Level of unemployment Positive Eurostat Years in European
Union
Exposure to EU legislation Positive European Commission (Neighbourhood)
Descriptive Statistics
This chapter was implemented to provide a brief review on the variables that will be tested. Fifteen variables remain, as some others were already dropped under the circumstances explained in the methodology. In table 2 can be seen the Means, Standard Deviation, Minimum Values and Maximum Values for each variable for the eight years of data.
Table 2: Statistical summary
Obs Mean Std.Dev Min Max
VAT Rates 216 19,98 2,60 15,00 27,00 GDP Per Capita 216 24,11 15,40 3,05 82,43 GDP Growth Rate 216 1,62 4,28 -14,80 11,60 Social Contributions 216 10,86 3,64 0,90 17,00 Unemployment 216 8,46 3,86 3,40 24,8 Corruption 216 35,88 18,04 4,00 70,00 Government Spend. 216 45,14 6,56 29,55 65,40 Elections 216 0,28 0,45 0,00 1,00 Population 216 18,38 22,90 0,40 82,50 Years in EU 216 21,38 19,31 0,00 55,00 Neighbours VAT 216 20,03 1,96 15,00 25,00 Direct Taxes 216 11,74 5,29 4,40 31,90 Consumption 216 12,05 1,73 7,30 17,20 Inflation 216 3,02 2,17 -1,70 15,30 Compliance Rates 216 82,32 11,25 50,72 99,84
By the analysis of the Table 2 and starting by VAT Rates, it can be seen that the average rate in European Union between 2005 and 2012 was approximately 20%.
Going into more detail, it is also possible to verify that the rate dropped from 2005 to 2006 because of Hungary deciding to lower it from 25% to 20%. From 2006 to 2007, the average value increased because Germany increased the rate from 16% to 19%. From 2007 to 2008 the only change was in Portugal reducing a rate of 21% to 20%. From 2008 to 2009 there were two changes, with Hungary being back from 20% to a 25% rate and Estonia increasing it from 18% to 20%. From 2009 onwards the rates kept growing continuously, with the year between 2009 and 2010 being the biggest year of changes, where Czech Republic, Finland, Greece, Lithuania, Portugal, Romania, Spain and UK decided to establish a higher rate. The only exception for this year was Ireland dropping the rate to a
lower level. From 2010 to 2011 Latvia, Poland, Portugal, Slovakia and UK increased the rate, while for the last year of the data, 2012, Cyprus, Hungary, Ireland and Italy increased the rate. The lowest standard rate was 15% and it was seen in Cyprus between the years 2005 and 2011. The highest standard rate of our data was reached by Hungary in 2012, a top position in the ranking possible with a rate of 27%.
Not counting with Population (which is measured in different units), GDP per capita is one of the strongest variables, which allows to make a small conclusions trough Standard Deviation. This result reflects many discrepancies over the EU countries, on productivity and possibly on wealth as well.
It is interesting to observe, by the analysis of the mean of Elections, that on average the period that separates Elections from each other is higher than three years. One should observe that the average of Government Spending’s in terms of GDP is approximately 45% while the average of Consumption in terms of GDP is approximately 12%. Direct Taxes in terms of GDP also have a value close to 12%.
The average values of Inflation reflect that, for the years between 2005 and 2012, the Inflation Rate as quite high. To finalize, CR also has large divergences over the EU. The lowest value being under 51% while the highest being almost 100% reflects exactly this fact.
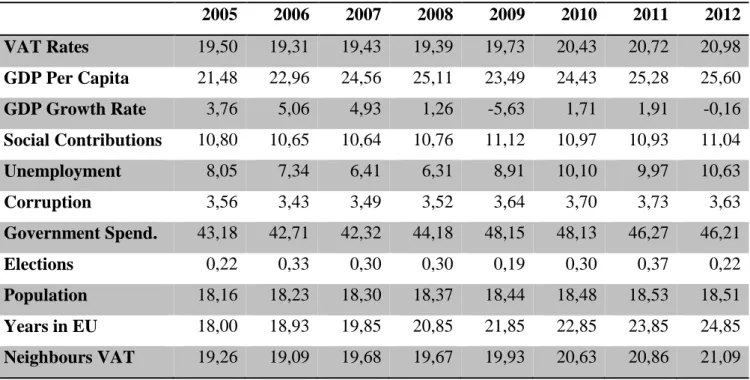
The following Table will be useful to observe the evolution of each variable trough the eight years of data.
Table 3: Cross-year sample statistical summary
2005 2006 2007 2008 2009 2010 2011 2012 VAT Rates 19,50 19,31 19,43 19,39 19,73 20,43 20,72 20,98 GDP Per Capita 21,48 22,96 24,56 25,11 23,49 24,43 25,28 25,60 GDP Growth Rate 3,76 5,06 4,93 1,26 -5,63 1,71 1,91 -0,16 Social Contributions 10,80 10,65 10,64 10,76 11,12 10,97 10,93 11,04 Unemployment 8,05 7,34 6,41 6,31 8,91 10,10 9,97 10,63 Corruption 3,56 3,43 3,49 3,52 3,64 3,70 3,73 3,63 Government Spend. 43,18 42,71 42,32 44,18 48,15 48,13 46,27 46,21 Elections 0,22 0,33 0,30 0,30 0,19 0,30 0,37 0,22 Population 18,16 18,23 18,30 18,37 18,44 18,48 18,53 18,51 Years in EU 18,00 18,93 19,85 20,85 21,85 22,85 23,85 24,85 Neighbours VAT 19,26 19,09 19,68 19,67 19,93 20,63 20,86 21,09
Direct Taxes 11,72 11,99 12,44 12,29 11,48 11,18 11,29 11,53
Consumption 12,30 12,24 12,17 11,93 11,73 11,91 12,02 12,08
Inflation 2,90 3,04 3,33 5,33 1,33 2,06 3,28 2,86
Compliance Rates 85,59 85,46 84,90 82,73 79,27 80,73 79,25 80,61
Even though the fact that the evolution of Consumption should have an important impact in the VAT Rate, it is not clear by the visibility of the evolution provided by the Table 3. To solve that a Graph denominated Figure 3 was created.
Figure 3: Evolution of Consumption and VAT Rates
With the visibility provided by the Figure 3, this relationship between Consumption and VAT Rates is still not clear. One should use more detailed information and also perform the estimation of the regression model at last.
Consumption in terms of GDP has as outsiders Spain and Bulgaria. For the year 2009 Spain had the lowest value on data with approximately 7,3% when Bulgaria had approximately 14,7%. The other important year was 2008 when Bulgaria reached the highest level of Consumption of 17,2% and Spain only had 8,2%.
Regarding the CR, the variations seem not to be so sharp, however even slight variations in percentage might have a significant influence in terms of tax return. The lowest value was reached in Romania for the year 2009 with approximately 51%, which reveals weak tax system. The best tax system so far seems to be the Dutch one, with the Netherlands reaching an outstanding level of Compliance of almost 100% in 2007.
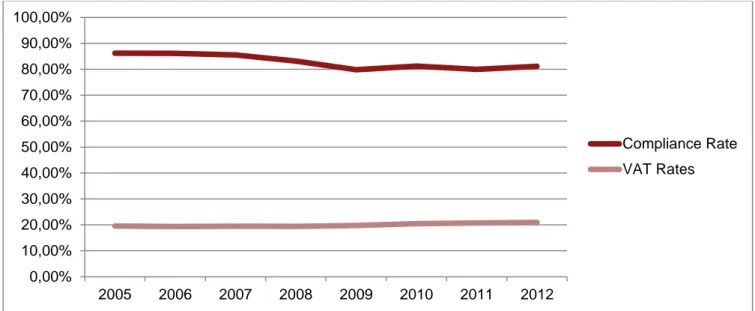
Figure 4 below aims to cross the VAT Rates and the CR. Unfortunately, Descriptive Statistics is still not allowing one to have clear view about this relationship, not before running a regression
0,00% 5,00% 10,00% 15,00% 20,00% 25,00% 2005 2006 2007 2008 2009 2010 2011 2012 Consumption VAT Rates
model. That is why the easiest was to confirm if expressive changes in VAT Rate could be possibly explained by changes in CR.
Figure 4: Evolution of Compliance Rate and VAT Rates
Between the years of 2005 and 2006, Hungary dropped the CR only by approximately 0,25% and the VAT Rate dropped from 25 to 20%. Between the years of 2008 and 2009 there was almost no increase in the CR of Hungary while the VAT Rate was raised from 20 to 25%. It is also interesting to note that from the year 2010 to 2011 the CR of Hungary went up by more than 5,50%, while VAT Rate went up from 25 to 27%. A rise in CR seems to be correlated with a rise in the VAT Rate, however by analysing one country it is not possible to perform conclusions yet.
In 2009, Romania increased the CR almost 1% and VAT was changed from 19 to 24%, Lithuania increased 3,5% of CR and VAT Rate 19 to 21%, Greece increased almost 4% of CR and changed the VAT Rate from 19 to 23%. Spain increased almost 19% CR and it changed VAT Rate from 16 to 18% and Portugal increased around 3,5% CR and the VAT Rate from 20 to 21%. By the opposite and also for 2009, Czech Republic decreased around 4,5% CR and increased VAT Rate from 19 to 20% and Finland decreased CR around 5% and increased VAT Rate from 22 to 23%.
Until now the results that express the statistical relationship between CR and VAT Rates might be confusing, therefore one should postpone early conclusions to the model estimation. GDP per capita is an explanatory variable that has big discrepancies inside the EU. The lowest value of the data was stated in 2005 in Bulgaria with approximately 3.047€ per head, aside from the results of
Luxembourg of around 63.928€ per head for the same year. In 2012 Bulgaria had approximately 5.457€ per head while Luxembourg reached the highest level of the data, with approximately 82.431€.
0,00% 10,00% 20,00% 30,00% 40,00% 50,00% 60,00% 70,00% 80,00% 90,00% 100,00% 2005 2006 2007 2008 2009 2010 2011 2012 Compliance Rate VAT Rates
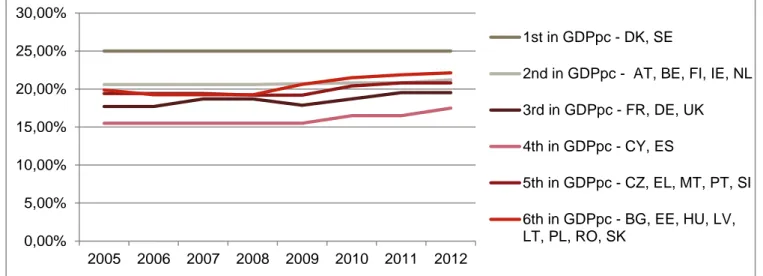
Figure 5: Evolution of VAT Rates by GDP per capita groups
In the Figure 5, countries were divided by groups regarding GDP per capita value. It was possible to get interesting results explained in the following paragraph (Italy and Luxembourg were excluded because these two countries did not have convergence in terms of GDP per capita with other countries.
Considering Denmark and Sweden as the highest income group, during the eight years the average VAT Rate was 25%. For the immediate following group that consolidates Austria, Belgium, Finland, Ireland and Netherlands the average was already approximately 21%. For the next group with France, Germany and UK the average was approximately 18,5%. For the group that includes Cyprus and Spain the average was close to 16%. If one continue going lower in terms of GDP per capita, it is possible to reach the group of Czech Republic, Greece, Malta, Portugal and Slovenia, for which group the average rate was approximately 20 %. As the lowest income group there are eight countries with similar levels of GDP per capita and also of VAT Rates, Bulgaria, Estonia, Hungary, Latvia,
Lithuania, Poland, Romania and Slovakia, which have an average of approximately 20,5%. As one can see, VAT Rate seems to be higher in countries that either way have high or low levels of GDP per capita.
The results for the statistical relationship between GDP per capita and VAT Rates have two major opposite forces. Once again, one should postpone precipitated conclusions about this
connection.
Test, Results and Interpretations
This chapter is divided into three sub-chapters, which follow a logical sequence in order to present all the econometrical process.
0,00% 5,00% 10,00% 15,00% 20,00% 25,00% 30,00% 2005 2006 2007 2008 2009 2010 2011 2012 1st in GDPpc - DK, SE
2nd in GDPpc - AT, BE, FI, IE, NL 3rd in GDPpc - FR, DE, UK 4th in GDPpc - CY, ES
5th in GDPpc - CZ, EL, MT, PT, SI 6th in GDPpc - BG, EE, HU, LV, LT, PL, RO, SK
Tests
This sub-chapter will contain a brief introduction to the type of estimation performed, the implicit assumptions to consider when performing an estimation of this type and also an analysis to the first model. This first model will be a guide to what comes next.
Due to the objectives of the thesis and also to the carachteristics of the collected data, it was decided that the best estimator would be of GMM type. The Econometrical estimations performed as well as the respective Tests had as guide the author Roodman (2006). According to him, before building this specific type of estimation there are several assumptions that one should take into consideration:
1. The process may be dynamic, with current realizations of the dependent variable influenced by past ones.
2. There may be arbitrarily distributed fixed individual effects in the dynamic, so the dependent variable consistently changes faster for some observations units than in other cases. Therefore, cross-sections should assume fixed effects away, however on panel data the variation over time can be used to identify parameters, which favours the decision to perform the last one. 3. Some regressors may be endogeneous, while other predetermined but not strictly exogeneous,
even if independent of current disturbances they might still be influenced by past ones. For example, the lagged dependent variable.
4. The idiosyncratic disturbances (apart from fixed effects) may have individual-specific patterns of heteroskedasticity and serial correlation and may be uncorrelated across individuals.
5. The number of time periods of the data, “T”, may be small while the number of observations, “N”, may be large . These two particular characteristics are pilar to the sustention of this thesis. Since the estimators are designed for general use, they do not assume that good instruments are available outside the immediate data set, leading to the next assumption. 6. The only instruments available are “internal”, which means they are based on lags of the
instrumented variables.
According to Kline(2011), the parsimony principle should be taken into consideration before starting. This principle suggests adopting models with the minimum number of parameters possible, because the simplest models with less explanatory variables are preferred, due to the following reasons:
1. The inclusion of too many explanatory variables in the model worsens the relative accuracy of the individual coefficients;
2. The resulting loss of degrees of freedom should reduce the power of the tests performed on the estimated coefficients;
3. Simple models are easier to understand.
The model tests regress VAT Rates against a set of explanatory variables and also tests hypotheses giving the default significance level of 5%.
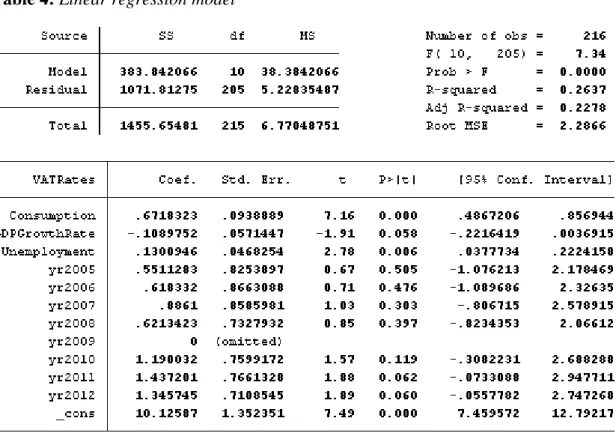
Table 4: Linear regression model
Equation: 𝑉𝐴𝑇 𝑅𝑎𝑡𝑒𝑖 = 𝛽1𝐶𝑜𝑛𝑠𝑢𝑚𝑝𝑡𝑖𝑜𝑛 + 𝛽2𝐺𝐷𝑃 𝑔𝑟𝑜𝑤𝑡ℎ 𝑟𝑎𝑡𝑒𝑖 + 𝛽3𝑈𝑛𝑒𝑚𝑝𝑙𝑜𝑦𝑚𝑒𝑛𝑡𝑖 + 𝛽4𝑌𝑒𝑎𝑟2005𝑖 + 𝛽𝑥+1𝑌𝑒𝑎𝑟𝑡+1𝑖+ 𝛽𝑥+2𝑌𝑒𝑎𝑟𝑡+2𝑖… + 𝑢𝑖 (5)
In order to better understand the relationship between the variables it was fundamental to start with a more simple type of regression. The output from the Table 4 represents a linear regression model that allowed to study this relationship between three different variables that made sense together, followed by dummy variables for the years that are present in the data.
Based on the probability associated with the P-values it was possible to see that these variables could possibly be used for a more developed model when imputing the GMM estimation. It was also very interesting to note that the VAT Rate, if all the variables were zero, would be by default close to
10%. This is a hypothetical example, however it is a good indicator about the variables, knowing that there is not any data in any country with a VAT Rate below 10%, means that for every country the gap between those 10% and the actual VAT Rate was explained by our model.
By the results of the R-squared and Adjusted R-squared one can conclude that the total variation of the dependent variable is explained by the model, approximately between 26,37% and 22,78%. These values are low as one could expect from data panel regression.
The next step is to calculate the coefficient of variation, which allows one to conclude that the weight of the standard error of the regression on the mean of the dependent variable is not as low as it would be desirable:
𝐶𝑉 =5,2283548719,97593 × 100 ≈ 26,17% (6)
By assessing the probability associated with the F-Test, which is lower than the default significance level, one can reject the null hypothesis and conclude that there is at least one estimated coefficient that is statistically significant. In this case, one can confirm by the individual p-values that some of them are lower than the default significance level, meaning they are statistically significant.
Results
This sub-chapter will introduce the final output of the estimation and which information one can extract out of these results. It will mostly be focused on individual and group statistical
significance in the first paragraphs and finalize with auto-correlation and endogeneity analysis. The explanations in terms of variable relationships will be analysed in the subsequent sub-chapter.
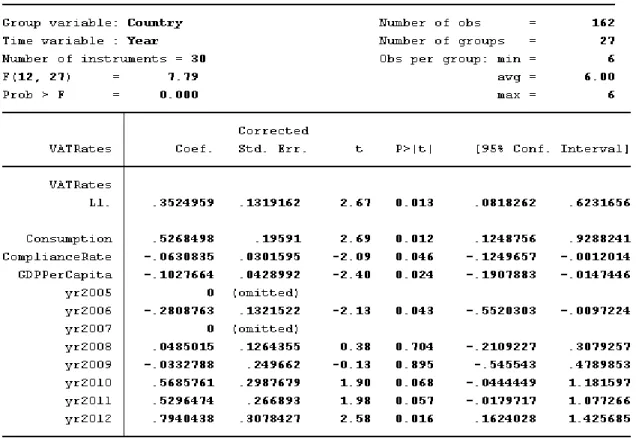
Table 5: Xtabond2 - Final model
Equation: 𝑉𝐴𝑇 𝑅𝑎𝑡𝑒𝑖 = 𝛽1 𝑉𝐴𝑇 𝑅𝑎𝑡𝑒(𝑙𝑎𝑔 1)𝑖 + 𝛽2𝐶𝑜𝑛𝑠𝑢𝑚𝑝𝑡𝑖𝑜𝑛𝑖 + 𝛽3𝐶𝑜𝑚𝑝𝑙𝑖𝑎𝑛𝑐𝑒 𝑟𝑎𝑡𝑒𝑖+
𝛽4𝐺𝐷𝑃 𝑝𝑒𝑟 𝑐𝑎𝑝𝑖𝑡𝑎𝑖 𝛽5𝑌𝑒𝑎𝑟2005𝑖 + 𝛽𝑥+1𝑌𝑒𝑎𝑟𝑡+1𝑖+ 𝛽𝑥+2𝑌𝑒𝑎𝑟𝑡+2𝑖… + 𝑢𝑖 (7)
Endogenous Variable: Unemployment(lag 1)
Instruments: Consumption, Compliance Rate and GDP per capita
Table 5 shows the output of the final test. One should note that for the null hypothesis the model is statistically significant and for the alternative hypothesis the model is not statistically significant.
than the default significance level, the null hypothesis is rejected. This means that our model was well estimated, with significant explanatory variables to explain the dependent variable.
For the correlation analysis, one should note that in the null hypothesis there is no correlation between the variables of our model and in the alternative hypothesis there is auto-correlation between them. By analysing the P-value of the Arellano-Bond test for AR(1), which is lower than the default significance level, the null is rejected. Therefore, there is no first-order auto-correlation for the model (one should also check the Appendix 16 which contains the Matrix of Covariance). These results are good for the tested model, confirming that there are not big issues about endogeneity. Despite the fact that GDP per capita should be less correlated with Consumption that GDP growth rate, these results were a good statistical step to the final estimation of the model and to the results interpretation as well.
Interpretation
This sub-chapter intends to perform reconciliation with the outcomes extracted from the Descriptive Statistics, the formed hypothesis and the final results. This analysis will lead to explanations that will make it possible to do the final conclusions in this matter.
𝛽1 is the estimator of Consumption. It means that for 1% of increase in Consumption in terms of GDP, the VAT Rate increases by approximately 0,53%, ceteris paribusi. Based on the Literature Review it was suggested that Consumption should have a positive impact on the VAT Rates and also the interpretation from the Descriptive Statistics pointed to this result. However, one could not guess that the impact correlation would be so high. In fact VAT Rate is a good tax tool to control the level of Consumption on an Economy, so it makes sense that this impact is quite big. In hypothetical terms a richer society would have higher standards of Consumption and, therefore, have a higher level of VAT Rate. For the specific case of having more than a VAT rate in the tax system, a richer society could consume more sophisticated goods, leading to the implementation of higher rates.
𝛽2 is the estimator of CR. It means that for each 1% of increase in CR, the VAT Rate
decreases by approximately 0,06%, ceteris paribus. Based on the Literature Review it was suggested that CR should have a negative impact on the VAT Rates, so the proposal has just been confirmed. As one could see by the Literature Review, this is a complex variable that is somehow related with many other variables. For better understanding of the results there should be thought about two situations that may cause this result:
1. High levels of CR make the country decrease the VAT Rate – according to the Literature Review there can be seen that this happens because of the fact that the CR is high enough and
already provides good tax revenues to the country, meaning that decreasing the rate would be a way to stimulate Economic Growth, for example by stimulating Consumption.
2. Low levels of CR make the country increase the VAT Rate - According to the Curve of Laffer there is an optimal tax rate (T*) for each country that maximizes the tax revenues. However, some countries which already reached this point need to achieve higher tax revenues, and they keep setting-up higher values of VAT Rate instead of trying to improve the tax system.
𝛽3 is the estimator of GDP per capita. It means that for each increase of 1000€ in the GDP per capita, the VAT Rate decreases by approximately 0,10%, ceteris paribus. One should split this
analysis in two different cases:
1. High levels of GDP per capita could be caused by decrease in Population or increase in GDP. In order to make VAT Rate to drop, it could mean that countries with less people do not need so high consumption taxes to finance the government spending. It could also be correlated with an increase in GDP, because the country would probably have a higher level of CR and, therefore, would not need the rate of VAT to be high.
2. Low levels of GDP per capita could be caused by increase in Population or decrease in GDP. A positive move in Population could grow VAT Rate because the government would need to finance more spending. A drop in GDP could lead to recession and also lower levels of CR, creating a need to the government explore solutions to maintain a high level of tax revenue. The GDP per capita variable was used instead of GDP growth rate because it includes the variation in Population factor, meaning that the negative variation is being caused by a force which is not so much correlated with GDP growth rate, but correlated with GDP per capita. The fact that the Variable Consumption is likely to absorb the model effect and to relegate GDP per capita to a secondary plan, could mean that there are problems of endogeneity. Therefore, one would think that could be useful to test the logarithm of GDP per capita instead. This test was performed, as it is
Conclusion
Final Remarks
While there are many studies about the impact of VAT Rate in other variables, there are not studies that searched for the determinants of VAT Rate. Not many studies of this field focused specifically in the EU either. The main purpose of this work was to arrive to a practical and logic conclusion about these determinants and fulfil the lack of empirical research about this specific and important theme.
In order to perform such analysis, data from 27 EU countries was gathered from the period between the years 2005 and 2012, for which 15 different variables were used to execute a panel data analysis. One could consolidate the evolution of those variables trough time and establish a
relationship between them by achieving results on a two-time analysis, first by Descriptive Statistics and later on by econometrical model estimation.
Descriptive Statistics allowed creating expectations on Consumption having an important impact in the VAT Rates. These expectations were only created because in some years there was a visible rise in both Consumption and VAT Rates. Despite the fact that the Descriptive Statistics did not still allow to achieve conclusions about the variable GDP per capita, it had some interesting outputs. By the creation of six group of Countries based in GDP per capita, it was possible to see that the VAT Rate seemed to be higher in countries that have high level of GDP per capita and also in countries that have low level. Countries that have a medium GDP per capita value were found to be situated on a medium level of VAT Rate.
Due to the econometrical model estimation it was possible to confirm that Consumption had a high level of statistical significance and a quite high coefficient. An increase of 1% in Consumption would increase VAT Rate by approximately 0,53%. The main explanation for the first result is that VAT Rate is a good tax tool to control the level of Consumption in an Economy. Also a richer society would have higher standards of Consumption and, therefore, have a higher level of VAT Rate. For the specific case of having more than a VAT rate in the tax system, a richer society could consume more sophisticated goods, leading to the implementation of higher rates.
The following significant output was related to CR. An increase of 1% in CR was associated to a decrease in the VAT Rate of around 0,06%. High levels of CR make the country decrease the VAT Rate because of the fact that the CR is high enough already providing good tax revenues to the
country, meaning that decreasing the rate would be a way to stimulate Economic Growth, for example by stimulating Consumption. Low levels of CR make the country increase the VAT Rate because some countries which already reached the optimal point need to achieve higher tax revenues, by
consequence, they keep setting-up higher values of VAT Rate instead of trying to improve the tax system.
The last significant output was GDP per capita. For this case, a rise of 1000€ in GDP per capita was associated to a decrease in the VAT Rate of around 0,10%. High levels of GDP per capita mean that countries with less people do not need so high consumption taxes to finance the government spending. It could also be correlated with an increase in GDP, because the country would probably have a higher level of CR and, therefore, would not need the rate of VAT to be high. Low levels of GDP per capita could mean that more Population would create a need to finance more spending, increasing VAT Rate, while a drop in GDP could lead to recession and also lower levels of CR, creating a need to the government explore solutions to maintain a high level of tax revenue.
Summing up, the Econometrical model estimation allowed one to conclude that it is actually possible to build some limited predictions about whether a government is going to change or not the VAT Rate and for which new level. One should keep in mind that some of the variables that were not used could also have an influence in the VAT Rate, many other variables not collected could also affect the predictions or even just unpredictable external shocks could move the results in a different way.
Limitations and Future Research
One can consider the biggest limitation of this thesis the fact that there were not Empirical Studies available that could be a strong support to the hypotheses. Most of the studies focused on the impact of changes in VAT Rate and not the opposite.
Also the fact that the independent variables may have implicit endogeneity does not give the wished level of clearance regarding an answer about what is exactly the cause and what is exactly the consequence. More specifically, one cannot conclude exactly if the stronger case is the one of
Consumption, Compliance Rates and GDP per capita having a big influence in the VAT Rates or the opposite.
The fact that implementing many lagged forms of the independent variables would destroy the model because of auto-correlation is also a limitation to consider. Would be interesting to search for behaviours in independent variables that could have a clear impact in the dependent one on the following years. This would mitigate the risk of not knowing which variable is the cause and which one is the consequence.
With such a broad subject it is possible to build many other researches about this topic to cover unavailability of data or even to focus on different aspects. These new possible paths will be described
in the following paragraphs.
In the future it could be interesting to collect more updated data, if possible, and to split the analysis in two parts. The first one for the period before the economic crisis of 2008, the other one for the following periods, in order to search for a possible structural breakpoint.
It would also be interesting to search for a clear way to analyse if the other type of VAT Rates beyond the standard have an impact on the level of the standard one. In order to perform this study, it could be possible to arrange a way of categorizing the different type of non-standard rates, studying individually or even segregating countries by groups. For the specific case of this thesis one could not transform this into a variable, but it is possible that someone with different background or persistence can get another output from that.
It could also bring a good output to change the chosen criteria to analyse the variable
“Neighbours VAT”, for which were included effects of Population, on a matter that a country that was surrounded by more than one country would get more influenced from the Neighbour Countries with more Population. It was not statistically significant in prior estimations, however it could be a good candidate to explain the variation of the VAT Rates if well implemented. In fact the variable Elections could also be re-estimated after changing some criteria. In our case we have chosen to adjust the data for Cyprus, Czech Republic and France, as in these countries it is common that an Election for the position of President has more impact than the Legislative Elections, unlike the rest of the countries. It is also possible that some of the variables that were not statistically significant or that were not used because it did not make sense in terms of the model regression will start to be in the future. A different but potentially significant study with different roots would be reachable by using VAT Rate but converted to a dummy. For this case, the number one would mean that a country changed the VAT Rate in a specific year and the number zero that there was no change verified for that year. It could be possible by using probit and logit estimation solutions.
References
Addison, T. & Levin, J. (2008). “The Determinants of Tax Revenue in Sub-Saharan Africa”.
Adisa, A. (2011), “The determinants of Value Added Tax Revenue in Kenya”, University of Nairobi”. Adesina, J., Adereti, S., Sanni, M. (2011), “Value added tax and economic growth in Nigeria”,
European Journal of Accounting Auditing and Finance Research, Vol 2, No. 8, pp. 62-69.
Agha, Ali, Jonathan Haughton (1996), “Designing VAT Systems: Some Efficiency Considerations”,
The Review of Economics and Statistics 78, No. 2, pp. 303–08.
Aizenman, J. & Jinjarak, Y. (2005), “The collection efficiency of value added tax: Theory and International Evidence”.
Alesina, Alberto, Cohen, G., Roubini, N. (1992), “Macroeconomic policy and elections in OECD Democracies”, Economics & Politics, Vol 4, No 1, Issue 1.
Bizer, D. & Durlauf, S. (1990), “Testing the positive theory of government finance”, Journal of
Monetary Economics 26 (1990) 123 – 141, North Holland.
Bodin, J. P., Ebrill, E. P., Keen, M., Summers, V. P. (2001), “The Modern VAT”, Washington D.C.,
International Monetary Fund.
Bornhorst, F., Gupta, S. & Thornton, J. (2009). “Natural resource endowments and the domestic revenue effort”, European Journal of Political Economy 25 (2009) 439-446, Elsevier.
Brasoveanu, I., & Brasoveanu, L. (2009), “Correlation between corruption and tax revenues in EU 27”, The Bucharest Academy of Economic Studies.
Chand, S. & Moene, K (1997). “Controlling Fiscal Corruption”. IMF Working Paper 97/100. Washington, DC: International Monetary Fund.
Christie, E., Holzner, M. (2006), “What Explains Tax Evasion? An Empirical Assessment Based on European Data”, The Vienna Institute for International Studies Working Papers 40.
Cizek, P., Lei, J., Ligthart, J. (2012), “The determinants of VAT introduction: a spatial duration analysis”, CentER Discussion Paper, Vol. 2012-071, Tilburg Econometrics.
European Commission (2006), “Macroeconomic effects of a shift from direct to indirect Taxation: A simulation for 15 EU Member States”, presented by the European Commission services at the 72nd meeting of the OECD Working Party No.2 on Tax Policy Analysis and Tax Statistics.
Hortlund, P. (2008), “Reduced VAT – Higher employment? A study of restaurant industry”, AB Handelns Utredningstitut (HUI) - Swedish Retail Institute.
Gupta, S. (2007), “Determinants of Tax Revenue Efforts in Developing Countries”, IMF Working
Paper 07/184. Washington D.C.: International Monetary Fund.