BJRS
RADIATION SCIENCES
07-03 (2019) 01-15ISSN: 2319-0612 Accepted: 2019-05-06
Dosimetry Study of a VARIAN 600 C/D Linear
Accelerator Head Model using MCNP5 Monte Carlo Code
Cancino J. L. B., Velasquez C. E., Fernandes L. C., Silva C. A. M.,
Sousa R. V. and Pereira C.
Departamento de Engenharia Nuclear - Universidade Federal de Minas Gerais Av. Antonio Carlos, 6627 campus UFMG, 31.270-901, Belo Horizonte, MG, Brazil
Tel/fax: 55-31-34096662 e-mail:claubia@nuclear.ufmg.br
ABSTRACT
In radiotherapy treatment planning, tools that improve the accuracy and quality of the radiation treatment for cancer are important for the decreased death of healthy tissue and the probability to produce cancer cells. This work aims to establish the simulation basis on MCNP code for reproducing the x-ray generation from the electron beam to the photon beam used on radiotherapy by the LINAC VARIAN 600 C/D. The main goal is to approximate the simulated x-ray spectrum, the profile dose and the relative dose to experimental ones. The analyzes show the difficulties to simulate a linear accelerator in relation to the relative percentage error between the simulation and experimental cases for the profile dose and the relative dose. These difficulties are due to the lack of information from the suppliers to the academic public in a matter of material composition, dimensions, and energies. Therefore, some parts of the model should be inferred, such as the electron beam source and its angle. The results show the data of the experimental measures compared to the Monte Carlo results, where the measurements of PDD are inside the margin of error for buildup region and the flat region for the beam profile dose according to reference criteria. The developed model would help to optimize the simulation of patient dosimetry in radiotherapy treatment planning.
1. INTRODUCTION
Being responsible for near 8.2 million deaths worldwide in 2012, according to the World Health Organization, cancer disease rises among the leading causes of death in the world. Brazil is not the exception; the Brazilian Ministry of Health estimates the diagnosis of 600 thousand new cases between 2016 – 2017 [1].
According to the Radiotherapy Committee of Brazil, 153 LINACs were available in the Radiotherapy facilities of Brazilian Ministry of Health in 2005. Currently, there are about 240 LINACs, which 60% corresponds to the physical and energetic parameters of a CLINAC 600 C/D.
An important issue in the radiotherapy facilities is the risk associated with their procedures, due to its effectiveness and efficiency is conditioned to the management culture of the radiotherapy services, organization for the day-to-day practice, as well as, lack of self-evaluation based daily could cause potential side effects in cancer treatment and in the surrounding healthy tissue. Therefore, the radiotherapy treatment plans used should look for tools and planning optimization, applying accurate dosimetry parameters to patients. In order to improve the dosimetry accuracy calculations for radiation therapy treatment planning, Monte Carlo simulations’ have been performed approximating the model to the experimental one. Then, the model should be improved and finally, after accuracy tests, it could be used in the radiotherapy facility. The purpose of this first study looks for simulates an experimental VARIAN 600 C/D with the highest approximation, besides leading with lack of detail information [2-7].
The studies of the penumbra region and charged particle buildup/build-down regions are fundamental in the percentage depth dose (PDD) and profile dose calculations. The PDD is defined as the dose normalized distribution where its value is 100% in the central axis inside the patient. In this context, the MCNP code has become an important tool in external photon and electron beam therapy researches [3-9].
The goal is to develop a model for the VARIAN 600 C/D linear accelerator using the MCNP5 code and perform the distribution dose in situations where the planning of radiotherapy could be
questionable. The utilization of the VARIAN 600 C/D simulation is useful as a complement of computational calculation models to check the actual dose calculation in hospitals. This model could be useful as a tool for quality control protocols, and to improve the dosimetry in a linear accelerator for radiotherapy.
2. METHODOLOGY
2.1. Description of the main components of the linear accelerator used in the
simulation
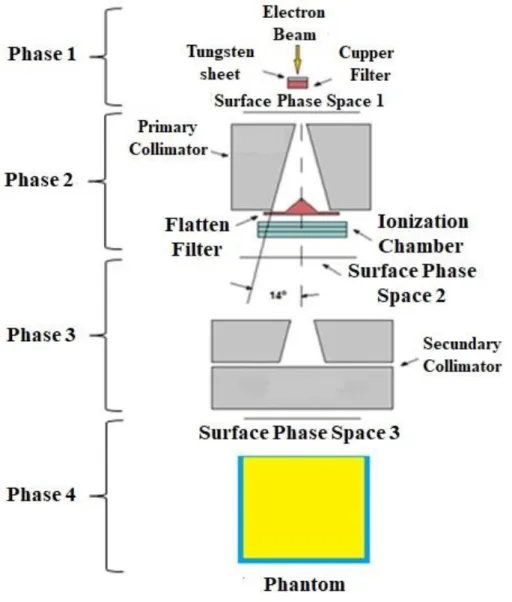
The development of a simple and reliable model of a VARIAN 600 C/D linear accelerator represents an essential part of this work. Figure 1 shows the components of the linear accelerator with 4 phases of space surface used in the simulation. These divisions help to calculate photon spectrum crossing each region.
The model starts assuming the output of an electron beam from the beam transport system, the electron beam source is a monoenergetic and monodirectional disk source of radius 0.05 cm assumed as the incident electrons beam striking the tungsten target producing photons by Bremsstrahlung and characteristic X-rays.
A tungsten alloy plate (tungsten 95%, nickel 3.4%, and iron 1.6%) with a thickness of 0.0635 cm and density 18.0 g/cm3, acts as a target for the electron beam, attached to a 0.2667 cm thickness and 8.92 g/cm3 density copper backing plate. A photon spectrum is generated due to Bremsstrahlung produced in the interaction between electron beams with the tungsten target. Right under the tungsten target is located the primary collimator. It is designed by a block of 9.144 cm edge with a 28o conical hole, causing the first collimation for the photon beam.
Figure 1: Schematic representation of the essential components and Phase Space Surface used in
the MCNP simulation of a VARIAN 600 C/D linear accelerator.
After the photon beam passes through the primary collimator, at the end of it, there is a flattening filter copper (density 8.92 g/cm3) with a conical shape. The flattening filter is designed to
attenuate and reduce the dose rate at the center of the beam in a higher degree. The almost conical shape of the filter allows absorbing the radiation with a gradual decrease from the center to both sides of the beam. Uniform and practically flat dose profiles are obtained; thereby the dose distribution is improved in patients.
Previous studies showed that the ionization chamber has not significant effect on photon beam characteristics [13]. Therefore, the ionization chamber was not included in the simulations.
The secondary collimator consists of four tungsten blocks forming an adjustable diaphragm system. Two blocks forming the upper collimation in the x-axis and two forming the lower collimation in the y-axis. The blocks have 7.874 cm thickness and they are located from 27.940 cm (upper collimator) to 44.704 cm (lower collimator) from the tungsten target. These collimators together design the irradiation field size.
2.2 Monte Carlo modeling of VARIAN 600 C/D linear accelerator
MCNP code allows developing the proper 3D model of the linear accelerator head. In the simulation, the components described above were used with their respective chemical compositions and densities.
The part of the accelerator of electron beam transport was simplified just to an electron source. Therefore, in PHASE 1, it considered the electron beam colliding to the tungsten target for X-ray production. The angle of the electron beam from the head of a typical linear accelerator is around 0.06o to 0.3o, which is very close to 0o. Therefore, this simulation was considered using a monodirectional electron disk source (radius 0.05 cm) with angle 0o. Thus, the electron beam strikes the tungsten target straight ahead.
One of the main difficulties to simulate the electron beam generated by a linear accelerator is the unknown of the mean energy from the electron beam. To obtain it, it was applied a trial and error method [4] to improve the simulation performance related to the real data. After achieving the purpose, as shown in Figure 2, the photon spectrum produced by Bremsstrahlung is tracked over a cylindrical cell placed below the copper filter.
Figure 2: Components for the photon calculation.
2.3 Field Simulation
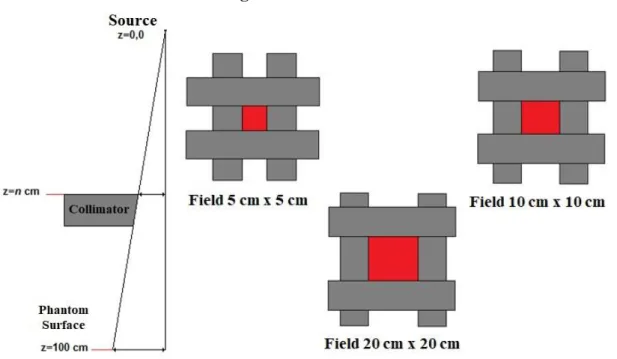
The proper primary electron beam energy was determined by calculation of percentage depth dose for different energies in the range 6 - 6.5 MeV for the field sizes 5 cm x 5 cm, 10 cm x 10 cm, 20 cm x 20 cm. Figure 3 shows the field sizes used to make the measurements. The comparison between PDD calculated with the measurements showed that the suitable primary electron energy for the VARIAN 600 C/D model was 6.2 MeV.
The simulation included a phase-space (PS) surface to reduce the computing time and improve the statistical uncertainty. This method is widely used and consists of the division of the simulation in two stages. The first stage consists of particles transport through the linear accelerator head and record the photons crossing the scoring plane (SSW, Surface Source Write card) located at the end of the flattening filter. In the second stage, this PS surface is used as the new source of irradiation (SSR, Surface Source Read card), and then the particles are transported to the irradiation object (Water Phantom). This information is stored in a phase space file containing the energy, angular and spatial distribution of photons.
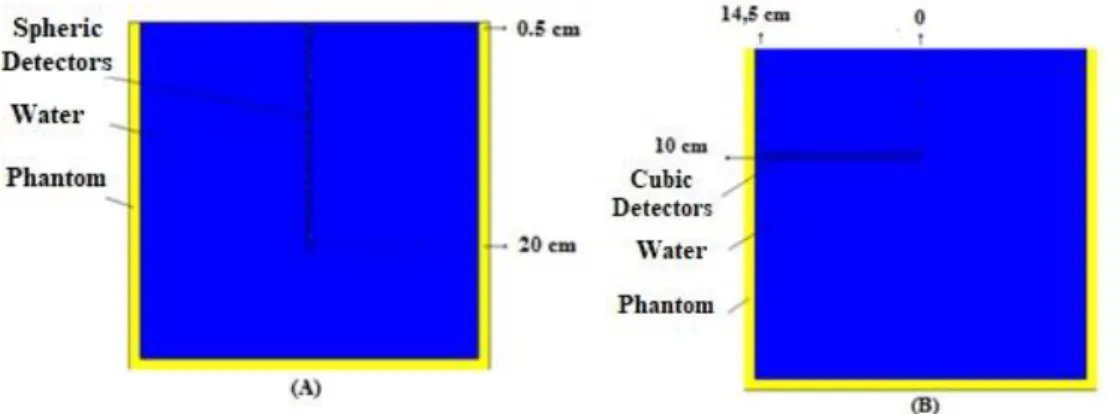
The phantom was simulated using the following dimensions 30 cm x 30 cm x 30 cm at 100 cm distance from the source-surface distance (SSD). The field sizes were 5 cm x 5 cm, 10 cm x 10 cm and 20 cm x 20 cm, which were used for PDDs and beam profiles calculations performed at 10 cm depth. To calculate the depth dose in the phantom, 40 spheres of 0.25 cm radius were placed from 0.5 cm to 20 cm depth. The beam profile simulation setup for the calculations was defined as a vertical rectangular box with 1 cm x 1 cm cross section located at 10 cm depth and divided into scoring cells with 0.25 cm thick. Figure 4 shows the frontal view of the simulated phantom.
Figure 4: Frontal view of the phantom containing the spherical detectors in vertical (A) and (B)
horizontal position.
The data tracked have energy values per particle in MeV. These results were divided by the detector mass used in the simulation and then multiplied by the constant (1.602×10⁻¹⁰) MeV∙g-1 to
obtain Gray (Gy) units. In order to decrease the statistical error below 1%, the number of primary particles should be at least 109. Below it, the error increases greatly.
2.4 Experimental measurements
To validate the LINAC Varian 600 C/D model, the experimental dose measurements were obtained applying the protocol TRS (Technical Reports Series) 398 from the IAEA (2000). This protocol describes the procedures for the quality control in LINAC’s through the dose-absorbed in the water. The DW,Q value in the ionization chamber inside the phantom was calculated according to
equation 1, as follow:
DW,Q= MQ ∙ ND,W,Q0 ∙ kQ,Q0 (1)
where MQ is the chamber ionization reading, ND,W,Q0 is the calibration factor and kQ,Q0 is the quality
correlation of the beam.
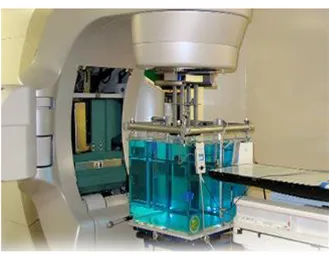
In order to carry out an accurate measurement, an ionization chamber (Wellhoffer IC 70 Farmer) was placed inside the phantom using a motorized system. This system allows the ionization chamber to perform high-speed sweeping all over the water phantom. Figure 5 shows the water phantom used in the dose measurements.
The depth dose measurements were taken every 0.5 cm from the surface of the phantom to 20 cm depth while dose profile measurements were carried out perpendicularly to beam central axis every 0.5 cm at 10 cm depth. All these measurement procedures were taking into account in the simulation for dose calculations. Thus, the comparison between MCNP calculations and measurements acquire should have an agreement in the corresponding values [10-11].
2.5 Recommendation Criteria for the Validation
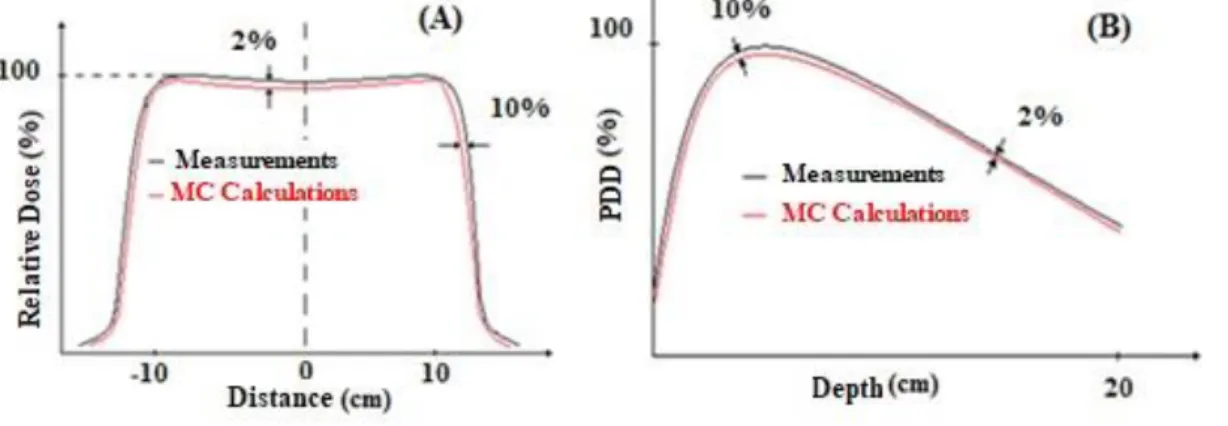
There are two recommendation criteria for the curves validation of the relative dose and PDD simulations using the MCNP code. The first criteria adopted was the one from VERHAEGEN, F. (2003) [12] in which the flatter curve of the relative dose and for the PDD in the part of the curve where the rate of dose fall off, both should be below 2%. The second criteria followed was from VENSELAAR, J.et al. [13] in which for the relative dose in the penumbra region and in the depth of maximum dose for the PDD should be below 10%, as shown in Figure 6. Therefore, the main goal is to fit the simulation of the relative dose and PDD inside these criteria parameters.
The definition of percentage difference presented in Equation 2 is used to calculate the differences in percent between the experimental measurements and the MCNP calculation for the relative dose and PDD,
𝐷𝑖𝑓%= |𝑀𝑒𝑎𝑠𝑢𝑟𝑒𝑚𝑒𝑛𝑡−𝐶alculation𝑀𝐶
|
𝑀𝑒asurements × 100 (2)
Figure 6: Recommendations criteria to evaluate the simulation of a LINAC Varian 600 for the
curves of (A) Relative Dose and (B) PDD.
3. RESULTS AND DISCUSSION
Figure 7 shows the photon spectrum produced by the Bremsstrahlung obtained over the tracking cell. The photon fluence calculation is in the range between 0.01 to 6.3 MeV which shows an expected behavior. This is the x-ray spectrum after the electron beam strikes the tungsten target and pass through the filter, where the characteristic peak is attenuated and is tracked below the filter.
Figure 7: Photon Energy at 0.7 cm from the source for 6.3 MeV beam.
0 1 2 3 4 5 6 7 0.000 0.005 0.010 0.015 0.020 Norm alised ph oto n f luen ce Energy (MeV)
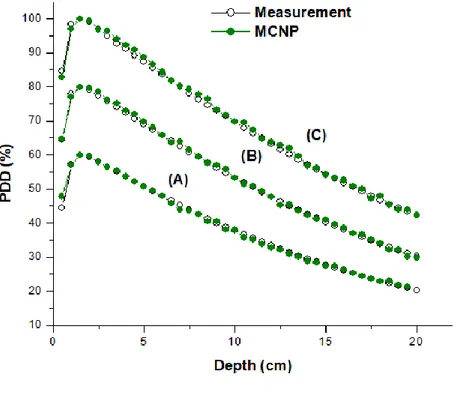
Figure 8 shows the PDDs comparison between the experimental measurements and the MCNP calculation for the three field sizes. The most important to highlight is the results obtained to the 10 cm x 10 cm field size simulation. As shown in Figure 9, it presented the lowest relative error of the three field sizes and it is below 2%. In other words, it has the lowest mean relative error overall the curves.
Figure 8: Comparison between calculated PDD and measurement for a (A) 5 cm x 5 cm field
size, (B) 10 cm x 10 cm field size, and (C) 20 cm x 20 cm field size.
Figure 10 shows the relative dose data between the experimental measurements and the MCNP calculation. The results satisfied the margin of error for the field size 5 cm x 5 cm and 10 cm x 10 cm field sizes, where their relative error is less than 2% in the build-up and in the umbra region. Nevertheless, when the 20 cm x 20 cm field size is used, the relative error increases, especially in the penumbra region, where the maximum error is 19.6 %.
Figure 9: Relative Error between the MCNP calculation and experimental data for PDD results
for the 10 cm x 10 cm field size.
Figure 10: Comparison between calculated beam profile and measurements at 10 cm depth in a
water phantom for the (A) 5 cm x 5 cm (B) 10 cm x 10 cm (C) 20 cm x 20 cm field size.
Table 1 presents the relative error values considering the criteria recommendation described in section 2.5. The highest error found in the penumbra region for 20 cm x 20 cm field size was 19.6 % and the minimum error was around 0.3 %. On the one hand, the lowest error found in the build-up region is 1.9 % presented for the 10 cm x 10 cm field size and the minimum is 0 %. Nonetheless, the mean error in this zone is 0.92%. Considering the mean error for the 5 cm x 5 cm and 10 cm x 10 cm fields, both are inside the acceptable criteria adopted for each region.
Table 1: Relative Error between the MCNP calculation and experimental data for the PDD and
beam profile dose for the field sizes 5 x 5, 10 x 10, and 20 x 20 cm2. Relative Error (%)
Study Region Field Size (cm2) Min. Max. Mean σ
PDD Build-up 5x5 0 7.5 1.35 2.54 10x10 0 1.9 0.92 0.5 20x20 0.1 2.1 1.1 0.78 Drop-off 5x5 0 3.2 1.00 0.86 10x10 0 2.8 0.98 0.77 20x20 0.1 2.86 1.1 0.79 Beam Pro-file Dose Umbra 5x5 0 4.6 1.4 1.8 10x10 0 4.5 1.6 1.4 20x20 0 10 4.7 3.4 Penumbra 5x5 2.2 10.6 5.6 3.6 10x10 3.5 13.3 8.9 4 20x20 0.3 19.6 9.4 5.8
4. CONCLUSION
In this paper, a VARIAN 600 C/D linear accelerator model head was simulated using the MCNP code, and results were compared with measured data. The comparisons between MCNP calculations and experimental measurements show results with statistical within the margin of error considering the recommended criteria, adopted in this paper, in which the differences in the results of the curve are below 2% for the drop-off region and less than 10% in the build-up region. Also, there was a high coherence in the beam profiles comparison. The error from the umbra region has
an average of 2%, but the data could contain values in the range until 5 % and for the penumbra region, the average error is about 11 %, which is inside the range of 0.3 to 19.6 %. The highest discrepancy for the 20 cm x 20 cm field should be due to the lack of information about the energy from the electron beam to produce the x-ray spectrum and the lack of information about the exact representation of the collimators for the simulation, which could be perceived for bigger fields. The chosen dosimetry parameters (PDD and beam profile) for comparisons were crucial in the model validation. The use of Phase Spaces allowed considerable statistical improvement and gain of computation time. Finally, the results are inside the margin of error for the 5 cm x 5 cm and 10 cm x 10 cm fields. Nevertheless, it is needed improvements to simulate bigger fields. This is the first step in the model to obtain the profile dose and PDD measures using the MCNP code. Future works will show improvements in the linear accelerator model, as well as, in the profile dose and PDD.
ACKNOWLEDGMENT
The authors are grateful to the Brazilian research funding agencies, CNEN – Comissão Nacional de Energia Nuclear (Brazil), CNPq – Conselho Nacional de Desenvolvimento Científico e Tecnológico (Brazil), CAPES – Coordenação de Aperfeiçoamento de Pessoal de Nível Superior (Brazil) and FAPEMIG – Fundação de Amparo à Pesquisa do Estado de Minas Gerais (MG/Brazil) for the support.
REFERENCES
[1] Ministerio da Saúde, “Rio de Janeiro ganha novo Centro de Diagnóstico do Câncer de Próstata”,
http://portalms.saude.gov.br/component/content/article/41997-rio-de-janeiro-ganha-novo-centro-de-diagnostico-do-cancer-de-prostata, 2017
[2] Alex C. H. Oliveira, José W. Vieira, Marcelo G. Santana and Fernando R. A. Lima, “Monte Carlo Simulation of a Medical Linear Accelerator for Generation of Phase Spaces”, International Nuclear Atlantic Conference, Recife, Brazil, November 24-29, 2013.
[3] Ali Nedaie Hassan et al., “Monte Carlo study of electron dose distributions produced by the elekta precise linear accelerator”, Reports of Practical Oncology and Radiotherapy, 11(6):287– 292, 2006.
[4] Karzmark C. J., Nunan C. S., and Tanabe E., “Medical Electron Accelerators”, McGraw-Hill, New York, 1993.
[5] Mesbahi, A., “Developement a simple point source model for Elekta SL-25 linear accelerator using MCNP4C Monte Carlo code”, Iran Journal of Radiation Research, 4 (1):7-14, 2006. [6] Mesbahi, A., Michael Fix, Mahmoud Allahverdi, Ellen Grein and Hossein Garaati, “Monte
Carlo calculation of Varian 2300C/D Linac photon beam characteristics: a comparison between MCNP4C, GEANT3 and measurements”, Applied Radiation and Isotopes, 62: 469–477, 2005. [7] Mohammad Taghi et al., “Monte Carlo simulation for Neptun 10 PC medical linear accelerator
and calculations of output factor for electron beam”, Reports of Practical Oncology and Radiotherapy, 17(2): 115–118, 2012.
[8] Podgorsak, E. B., Review of radiation oncology physics: a handbook for teachers and students, Education Report Series, International Atomic Energy Agency, Vienna, Austria, 2003.
[9] Sempau, J. et al., “Monte Carlo simulation of electron beams from an accelerator head using PENELOPE”, Physics in Medicine and Biology, 46(4):1163–1186, 2001.
[10] Sheikh-Bagheri, D. and Rogers, D. W. O., “Monte Carlo calculation of nine megavoltage photon beam spectra using the BEAM code”, Medical Physics, vol. 29, pp. 391-402, 2002. [11] Sousa, R.V., “Dose rate influence on deep dose deposition using a 6 MV x-ray beam from a
linear accelerator”, Brazilian Journal of Physics, v. 39, No.2, 2009.
[12] Varian Medical Systems, Inc. C-Series CLINAC Clinical User Guide. Delivery Systems. P/N 1102903-03 7/99. USA, 1999.
[13] Venselaar, J., Welleweerd, H., Mijnheer, B., “Tolerances for the accuracy of photon beam dose calculations of treatment planning systems”, Radiotherapy Oncology, 60: 191-201, 2001. [14] Verhaegen, F. and Seuntjens, J., “Monte Carlo modeling of external radiotherapy photon