Vol.61, no.spe: e18000600, 2018 http://dx.doi.org/10.1590/1678-4324-smart-2018000600
ISSN 1678-4324 Online Edition
BRAZILIAN ARCHIVES OF BIOLOGY AND TECHNOLOGY
A N I N T E R N A T I O N A L J O U R N A L
Analysis of the Operation of Photovoltaic Systems Installed
at Federal University of Technology - Paraná in Curitiba
Jair Urbanetz Junior
1,2*, Fabianna Stumpf Tonin
2;
Juliana D’Angela
Mariano
2, Gerson
Máximo Tiepolo
1.
1 Programa de Pós-Graduação em Sistemas de Energia, Universidade Tecnológica Federal do Paraná, Curitiba, Brasil; 2 Programa de Pós-Graduação em Engenharia Civil, Universidade Tecnológica Federal do Paraná, Curitiba, Brasil.
ABSTRACT
The Federal University of Technology - Paraná (UTFPR), Campus Curitiba, has a Grid-Connected Photovoltaic System (GCPVS) of 2.1 kWp in the Green Office (GO), which has been in operation since December 2011, and until September 2017 generated little more than 13.64 MWh and a GCPVS of 10.2 kWp, in operation since February 2016. The photovoltaic panel of the 2.1 kWp system was set up following the inclination of the roof of the building, which does not give its maximum performance. On the other hand, the panel of the 10.2 kWp system in Neoville was installed in optimum conditions, that is, oriented to the north and with slope equal to the latitude of Curitiba and, up tol September 2017 generated more than 20.65 MWh. This paper presents the monitoring of the electric energy generated by the systems and also a history of the merit indexes of the GCPVS, which are: Productivity (Yield); Performance Ratio; and Capacity Factor. These indexes allow to evaluate the performance of the GCPVS and make a comparison between them. Finally, the photovoltaic generation of both GCPVS proved to be a sustainable and effective form of distributed generation of electric energy in the urban environment.
Keywords: solar energy, distribuited generation, grid-connected photovoltaic system
INTRODUCTION
The grid-connected photovoltaic system shows great growth among renewable energy sources worldwide with 75GW installed in 2016, which corresponds to the installation of more than 31.000 photovoltaic modules per hour. In addition, more photovoltaic capacity was installed in 2016 than the global photovoltaic capacity accumulated in the five previous years. The year of 2016 recorded a total photovoltaic capacity of 303GW, while the year of 2015 achieved 228 GW (48% less than 2016), 2014 added 177GW installed (71% below 2016) and 2013 accumulated 137 GW (220% below 2016)¹.
A grid-connected photovoltaic system is basically composed of a Photovoltaic (PV) panel, which converts the energy of the sun into electrical energy in direct current, and an inverter, which converts the direct current into alternating current, with voltage and frequency compatible with the utility grid to which the system is interconnected. The main advantages of this type of system are: high productivity, absence of bank of batteries and automatic shutdown in case of lack of power of the network, avoiding the phenomenon of islanding².
In December 2011, the Green Office (GO) of the Federal University of Technology - Paraná (UTFPR) was inaugurated, a unique proposal in Brazil for a sustainable building of 150 m² that adopted several sustainability strategies in partnership with more than sixty companies, aiming to verify the performance of these strategies, among them, the maximum energy efficiency3. In addition to taking advantage of natural lighting and the use of LED lamps, the project also opted for the photovoltaic generation technique as a master line to provide energy to the building, together with the utility's electrical system. Figure 1 shows the Green Office of the UTFPR.
Figure 1 – UTFPR`s Green Office
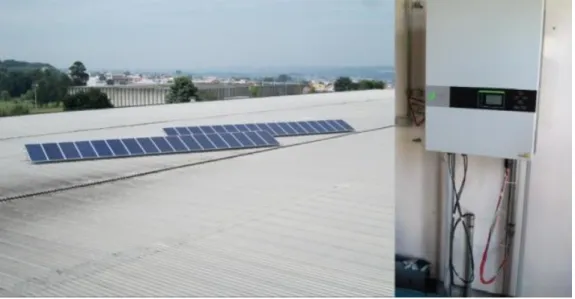
Figure 2 - Neoville’s System
Both systems are based on the interaction of two agents responsible for the supply of electric energy: the energy distribution company and the photovoltaic generator. When there is solar incidence on the photovoltaic panel, there is generation of electric energy, and this is made available directly in the electricity grid of the consumer where the photovoltaic generator is located. In case the photogenerated energy is higher than the consumed, it is sent to the electricity grid to be consumed in the neighborhood. In moments of low or no solar incidence, the distributor supplies the consumer5.
MATERIAL AND METHODS
A. Work place - data collected directly from the grid-connected photovoltaic system of UTFPR installed in the city of Curitiba.
B. Procedure - With the irradiation data provided by the pyranometer, the National Institute of Meteorology (INMET)6, for the A807 station located in Curitiba and, with the aid of the RADIASOL program, provided by the Federal University of Rio Grande do Sul7. With this program it is possible to determine irradiation that effectively affects the photovoltaic panel of each system, since the input data of that program are the irradiation data in the horizontal plane and the output data are the irradiance values in the GCPVS plane (according to the respective slope and azimuthal deviation). C. Data Analysis - Calculations of the merit indices of the systems were performed, using the universal equations for Productivity, Performance Rate and Capacity Factor 8,9,10.
RESULT AND DISCUSSION
Generated Energy
Analyzing the operation of the Green Office’s system from 2012 to September 2017, a
total generation of 13.64 MWh was observed in this period. The generation of electric energy is proportional to the irradiation incident in the PV panel, where in the summer months (higher solar incidence) there is a larger generation of electric energy and in the winter months, (lower solar incidence) there is less generation. Figure 3 shows the electric energy values generated in each month of Green Office’s system operation.
Table 3 - Electricity Generation (kWh /month) of Green Office
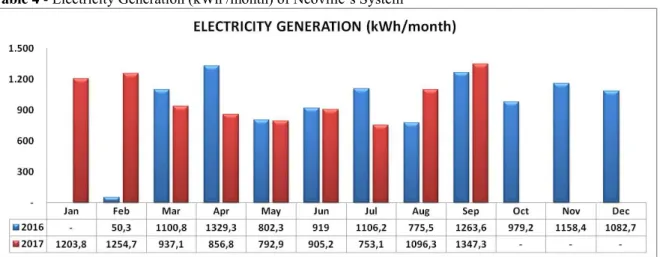
Table 4 shows the electric power generation of Neoville’s system. Since in operation, it has generated more than 20.65 MWh.
Table 4 - Electricity Generation (kWh /month) of Neoville’s System
Photovoltaic Panel Incident Irradiation
The irradiance values of the photovoltaic panels, which served as the basis for the calculation of some of the merit indexes of the PV system, were obtained from the National Institute of Meteorology (INMET) database for station A807, located in the metropolitan area of Curitiba6.
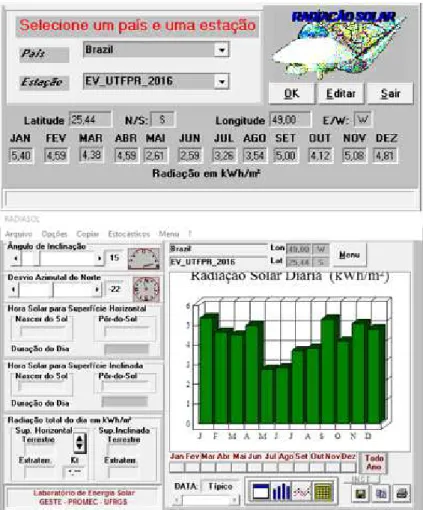
As the INMET pyranometer is installed horizontally, the RADIASOL program is used to determine the irradiation that effectively affects the panel of each system. In the case of Green Office, the slope of the panel is 15º and the azimuthal deviation of 22º
This program, provided by the Federal University of Rio Grande do Sul7, allows the identification of irradiance values for any plane (different slopes and azimuthal deviation from the north) from the insertion of the irradiation values in the horizontal plane.
For the period of 2012 to 2017 the stations - EV_UTFPR_2012, EV_UTFPR_2013, EV_UTFPR_2014, EV_UTFPR_2015, EV_UTFPR_2016 and EV_UTFPR_2017 - were created in the RADIASOL program of UFRGS. Figure 5 shows the EV_UTFPR_2016 screen, in which the irradiance values for the year 2016 were edited in the horizontal plane for the geographic position (-25.440418, -49.268610) where the PV photovoltaic panel is installed and then the slope and azimuthal deviation values were adjusted, thus obtaining the graph shown in Figure 5 with the irradiation values incident on the plane of the photovoltaic panel. Similarly, this same procedure was performed to obtain the irradiation values incident on the Neoville panel.
Figura 5 - Radiasol screen
Merit indexes
The merit indexes are used to compare the operation of PV systems located at different locations and with different nominal powers8,9,10.
Yield
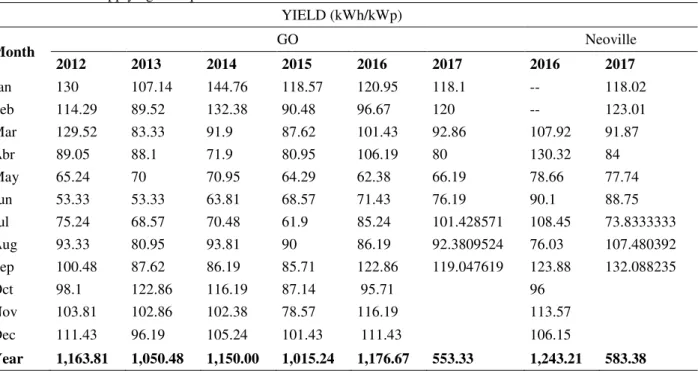
considered the monthly yield. Equation 1 shows the quantity in question. Table 1 shows the monthly and annual yield of the two grid-connected photovoltaic systems.
kWp
kWh PVGenerated Y
power energy
(1)
Table 1 - Annual and monthly yield of the UTFPR’s grid-connected photovoltaic systems Values calculated applying the equation above
YIELD (kWh/kWp)
Month GO Neoville
2012 2013 2014 2015 2016 2017 2016 2017
Jan 130 107.14 144.76 118.57 120.95 118.1 -- 118.02
Feb 114.29 89.52 132.38 90.48 96.67 120 -- 123.01
Mar 129.52 83.33 91.9 87.62 101.43 92.86 107.92 91.87
Abr 89.05 88.1 71.9 80.95 106.19 80 130.32 84
May 65.24 70 70.95 64.29 62.38 66.19 78.66 77.74
Jun 53.33 53.33 63.81 68.57 71.43 76.19 90.1 88.75
Jul 75.24 68.57 70.48 61.9 85.24 101.428571 108.45 73.8333333
Aug 93.33 80.95 93.81 90 86.19 92.3809524 76.03 107.480392
Sep 100.48 87.62 86.19 85.71 122.86 119.047619 123.88 132.088235
Oct 98.1 122.86 116.19 87.14 95.71 96
Nov 103.81 102.86 102.38 78.57 116.19 113.57
Dec 111.43 96.19 105.24 101.43 111.43 106.15
Year 1,163.81 1,050.48 1,150.00 1,015.24 1,176.67 553.33 1,243.21 583.38
It is noted that the productivity value, which is a result of the ratio of the generated energy divided by the installed photovoltaic power, presented close results during the entire period of operation of the GCPVS of the GO. It is evident that accumulation of dirt directly affects the productivity of the system, since after the cleanups, carried out on 8/31/2013, 9/26/2015 and 9/1/2016, productivity rises again.
On the other hand, Neoville's grid-connected photovoltaic system results show greater productivity from March to July.
Performance Ratio
% 000 , 1 / n IrradiatioYield
PR (2)
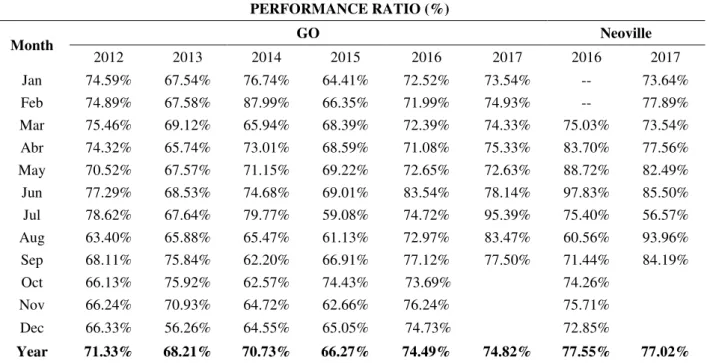
Table 2 - Monthly and annual performance ratio of the UTFPR’s grid-connected photovoltaic systems Values calculated applying the equation above
PERFORMANCE RATIO (%)
Month GO Neoville
2012 2013 2014 2015 2016 2017 2016 2017
Jan 74.59% 67.54% 76.74% 64.41% 72.52% 73.54% -- 73.64%
Feb 74.89% 67.58% 87.99% 66.35% 71.99% 74.93% -- 77.89%
Mar 75.46% 69.12% 65.94% 68.39% 72.39% 74.33% 75.03% 73.54%
Abr 74.32% 65.74% 73.01% 68.59% 71.08% 75.33% 83.70% 77.56%
May 70.52% 67.57% 71.15% 69.22% 72.65% 72.63% 88.72% 82.49%
Jun 77.29% 68.53% 74.68% 69.01% 83.54% 78.14% 97.83% 85.50% Jul 78.62% 67.64% 79.77% 59.08% 74.72% 95.39% 75.40% 56.57%
Aug 63.40% 65.88% 65.47% 61.13% 72.97% 83.47% 60.56% 93.96%
Sep 68.11% 75.84% 62.20% 66.91% 77.12% 77.50% 71.44% 84.19%
Oct 66.13% 75.92% 62.57% 74.43% 73.69% 74.26%
Nov 66.24% 70.93% 64.72% 62.66% 76.24% 75.71%
Dec 66.33% 56.26% 64.55% 65.05% 74.73% 72.85%
Year 71.33% 68.21% 70.73% 66.27% 74.49% 74.82% 77.55% 77.02%
Analyzing the months immediately prior to the GO PV panel cleanings, a gradual decrease was observed in this index, and after the cleanings, the monthly performance rate returned to the level observed in the first months of operation of the GCPVS, remaining higher than 70%.
Neoville has already performance rates above 71% in every month. It is interesting to
note that the Neoville’s performance rate for the year 2016 was 4% higher than the
GO for that year.
Capacity Factor
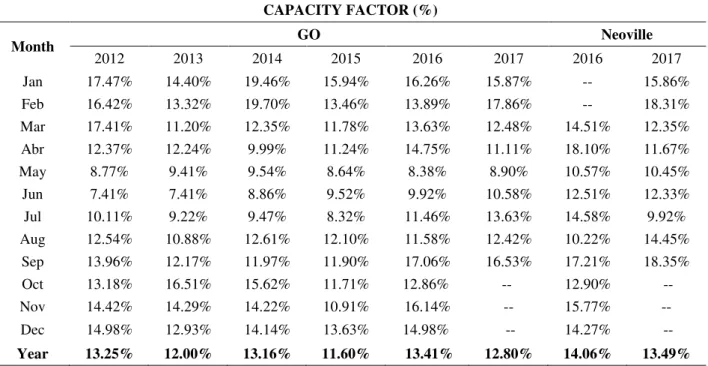
It is its real capacity to generate energy according to the energy it would generate if operated at nominal power for 24 hours a day, also expressed as a percentage8. Equation 3 presents the magnitude in question, and Table 3 shows the Capacity Factor for 2012, 2013, 2014, 2015, 2016 and until September 2017 for the GCPVS of the GO’s grid-connected photovoltaic system. This greatness is also shown for the Neoville’s grid-connected system for 2016 and until September 2017.
% 24 days PVGenerated CF
power
energy
Table 3 - Monthly and annual capacity factor of the UTFPR’s grid-connected photovoltaic systems Values calculated applying the equation above
CAPACITY FACTOR (%)
Month GO Neoville
2012 2013 2014 2015 2016 2017 2016 2017
Jan 17.47% 14.40% 19.46% 15.94% 16.26% 15.87% -- 15.86%
Feb 16.42% 13.32% 19.70% 13.46% 13.89% 17.86% -- 18.31%
Mar 17.41% 11.20% 12.35% 11.78% 13.63% 12.48% 14.51% 12.35%
Abr 12.37% 12.24% 9.99% 11.24% 14.75% 11.11% 18.10% 11.67%
May 8.77% 9.41% 9.54% 8.64% 8.38% 8.90% 10.57% 10.45%
Jun 7.41% 7.41% 8.86% 9.52% 9.92% 10.58% 12.51% 12.33%
Jul 10.11% 9.22% 9.47% 8.32% 11.46% 13.63% 14.58% 9.92%
Aug 12.54% 10.88% 12.61% 12.10% 11.58% 12.42% 10.22% 14.45%
Sep 13.96% 12.17% 11.97% 11.90% 17.06% 16.53% 17.21% 18.35%
Oct 13.18% 16.51% 15.62% 11.71% 12.86% -- 12.90% --
Nov 14.42% 14.29% 14.22% 10.91% 16.14% -- 15.77% --
Dec 14.98% 12.93% 14.14% 13.63% 14.98% -- 14.27% --
Year 13.25% 12.00% 13.16% 11.60% 13.41% 12.80% 14.06% 13.49%
The average Capacity Factor of the GO in 2015 was lower than the other years, due to the lower solar irradiation in that year. Neoville's average capacity factor for 2016 was 5% higher than the GO value.
CONCLUSION
The monitoring of the GO and Neoville’s grid-connected systems in Curitiba for the analyzed period confirm the urban applicability of distributed photovoltaic generation. Thus, these PV systems operate in a clean, silent and that does not require additional area to be installed, since the photovoltaic panels are installed on the roofs of the buildings. Both grid-connected photovoltaic systems are shown as high reliability systems, since they operate uninterruptedly from the respective installations. It is important to highlight that these PV systems had no replacement of equipment, and cleaning of the photovoltaic modules is the only intervention that has been performed. Regarding merit indexes: Yield, Performance Ratio and Capacity Factor, the values are adequate and similar to those published by other universities that conduct research in this field, such as UFSC and USP. The irradiance values considered for the calculation of the Performance Ratio were obtained through the meteorological station of INMET (A807). This station has a pyranometer installed horizontally, providing the values of irradiation in the horizontal plane, with the use of the RADIASOL program, irradiation was obtained in the plane of the PV panel of GO and Neoville.
However. it is important to mention that the 10.2 kWp Neoville’s grid-connected photovoltaic system uses a 380V three-phase transformerless of the high efficiency with maximum efficiency of 98%, while the GO’s grid-connected photovoltaic system of the 2.1 kWp employs a single-phase inverter with a low-frequency transformer and maximum efficiency of 92%. The non-transformer inverter has less losses than the inverter with transformer and for this reason, it is superior to the other. In addition, these inverters are lighter, more compact and use components with more technology than inverters with transformer. This is the main trend of the photovoltaic market regarding inverters, that is, to use non-transformer inverters in order to increase the
system’s efficiency.
In addition, the Neoville’s photovoltaic panel system was installed in optimum conditions, that is, geographically oriented north and with tilt angle equal to the latitude of Curitiba (25º) - without azimuthal deviation. On the other hand, the GO’s photovoltaic panel was installed alongside the inclination and orientation of the respective roofs. Furthermore, the GO’ system panel is very closely attached to the roof, which reduces the ventilation of the panel and thereby causes the modules to heat up more than the modules of the other GCPVSs that have greater ventilation and consequently reduces its productivity.
Finally, it is noticed that the choice of the inverter and the way of installation of the photovoltaic modules are determinant factors to maximize the performance of the photovoltaic system. For this reason, this type of equipment and its installation must be carefully chosen during the design phase of the system.
REFERENCES
1- Renewables 2017 Global Status Report - [cited 2017 Aug 10]. Available from:
http://www.ren21.net/wp-content/uploads/2017/06/17-8399_GSR_2017_Full_Report_0621_Opt.pdf2017.
2- Urbanetz Jr J. [Photovoltaic Systems Connected to Urban Distribution Networks: Their Influence on the Quality of Electric Power and Analysis of Parameters That May Affect Connectivity]. [Thesis], 2010; 189. Portuguese.
3- Green Office – [cited 2017 Jun 20]. Available from: http://labens.ct.utfpr.edu.br/projetos/. 4- Tonin FS. [Characterization of Photovoltaic Systems Connected to the Electrical Network in the city of Curitiba]. [Masters Assignment] 2017; 131. Portuguese.
5- Urbanetz Jr J, Tiepolo GM, Fusano RH, Casagrande Jr EF, Canciglieri Jr O. [Analysis of the performance of the photovoltaic system connected to the power grid of UTFPR's green office] 2013; Revista SODEBRAS. Vol 8. N° 88.
6- National Institute of Meteorology [cited 2017 Jun 22]. Available from: http://www.inmet.gov.br/.
7- UFRGS. Softaware “RADIASOL”. [cited 2017 Jun 22]. Available from: http://www.solar.ufrgs.br/.
8- Oliveira SHF. [ Distributed Generation of Electricity; Insertion of Photovoltaic Buildings to the Network in the State of São Paulo]. [Thesis] 2002; 205. Portuguese.
9- Benedito RS. Characterization of the Distributed Generation of Electricity by means of Photovoltaic Systems Connected to the Network in Brazil under the Technical Aspects. Economic and Regulatory]. [Masters] 2009; 110. Portuguese.
10- Marion B, Adelstein J, Boyle K, Hayden H, Hammond B, Fletcher T, Canada B, Narang D, Shugar D, Wenger H, Kimber A, Mitchell L, Rich G, Townsend T. Performance Parameters for Grid-Connected PV Systems. 31st IEEE Photovoltaics Specialists Conference and Exhibition; 2005 Jan 3-7; Lake Buena Vista, Florida, USA.

