RESUMO.- [Alterações do parênquima cerebral durante a senilidade em gatos domésticos.] Este estudo objetivou a identificação de alterações no parênquima cerebral relacionadas ao avanço da idade em gatos domésticos saudáveis. Nossa hipótese é de que os gatos sofrem atrofia cerebral e cerebelar, além de alterações focais na intensidade do sinal do parênquima cerebral, de acordo com a progressão da idade. Doze gatos não braquicéfalos adultos (1 a 6 anos), onze maduros (7 a 11 anos) e dez geriátricos (12 anos ou mais) foram submetidos à ressonância magnética encefálica. Não foram observadas alterações na intensidade do sinal e na captação de contraste do parênquima encefálico nos gatos. Os animais geriátricos
apresentaram médias da espessura da adesão intertalâmica e porcentagem do volume do parênquima cerebral, em relação ao volume intracraniano, significativamente menores a aquelas encontradas no grupo dos adultos. Não foram encontradas diferenças significativas entre os grupos para volume cerebral, volume cerebelar e porcentagem de volume cerebelar em relação ao volume intracraniano. Os resultados deste estudo indicam que a atrofia do parênquima cerebral, incluindo a adesão intertalâmica, ocorre com o avanço da idade em gatos domésticos, confirmando a hipótese do estudo. No entanto, os resultados não corroboraram a hipótese de que os gatos apresentam atrofia cerebelar e alterações focais na intensidade do sinal do parênquima encefálico com a progressão da idade. TERMOS DE INDEXAÇÃO: Encéfalo, parênquima cerebral, gatos, neuroanatomia, ressonância magnética, senilidade.
INTRODUCTION
During senescence process, it is known that brain parenchymal volume reduces in humans (Coffey et al. 1992, Courchesne et al. 2000, Jernigan et al. 2001, Beason-Held & Horwitz 2002, Ge et al. 2002, Resnick et al. 2003, Scahill et al. 2003, ABSTRACT.- Babicsak V.R., Klein A.V., Tsunemi M.H. & Vulcano L.C. 2018. Brain parenchymal
changes during normal aging in domestic cats.Pesquisa Veterinária Brasileira 38(6):1196-1202. Departamento de Reprodução Animal e Radiologia Veterinária, Faculdade de Medicina Veterinária e Zootecnia, Universidade Estadual Paulista, Campus de Botucatu, Rua Prof. Dr. Walter Mauricio Correa s/n, Botucatu, SP 18618-681, Brazil. E-mail: [email protected]
This study aimed to identify changes related to brain parenchyma as advancing age in healthy domestic cats. Our hypothesis is that cats suffer cerebral and cerebellar atrophy and show focal changes in signal intensity of the brain parenchyma in accordance with the progression of age. Twelve adult (1 to 6 years), eleven mature (7 to11 years) and ten geriatric non-brachycephalic cats (12 years or more of age) underwent brain magnetic resonance imaging (MRI). There were no changes in signal intensity and contrast uptake in brain parenchyma of the cats. Geriatric animals showed significantly lower average thickness of the interthalamic adhesion and percentage of the cerebral parenchyma volume in relation to intracranial volume than those found in the adult group. No significant differences were found between groups for cerebral volume, cerebellar volume and percentage of cerebellar volume in relation to intracranial volume. The results of this study indicate that atrophy of the cerebral parenchyma, including the interthalamic adhesion, occurs with age in domestic cats, confirming the hypothesis of the study. However, the results did not corroborate the hypothesis that cats show cerebellar atrophy and focal changes in signal intensity of the brain parenchyma with advancing age.
INDEX TERMS: Brain, parenchymal changes, aging, cats, neuroanatomy, magnetic resonance imaging, senility.
Vet 2548 pvb-5397 SA
Brain parenchymal changes during normal aging in
domestic cats
1Viviam R. Babicsak2*, Adriana V. Klein2, Miriam H. Tsunemi3 and Luiz C. Vulcano2
1 Received on April 21, 2017.
Accepted for publication on May 11, 2017.
2 Departamento de Reprodução Animal e Radiologia Veterinária, Faculdade
de Medicina Veterinária e Zootecnia (FMVZ), Universidade Estadual Paulista (Unesp), Campus de Botucatu, Rua Prof. Dr. Walter Mauricio Correa s/n, Botucatu, SP 18618-681, Brazil. *Autor para correspondência: [email protected]
3 Departamento de Bioestatística, Instituto de Biociências, Universidade
2014) and dogs (Tapp & Siwak 2006, Pugliese et al. 2010) as a result of several processes such as neuronal degeneration, reduction of synaptic density (Seeley et al. 2009), change in length of myelinated fibers (Meier-Ruge et al. 1992, Marner et al. 2003), increased perivascular space (Meier-Ruge et al. 1992) and demyelination (Marner et al. 2003).
Although volumetric reduction of the brain parenchyma normally occurs according to the progression of age in humans, some diseases are also associated to brain atrophy, such as Alzheimer’s, Parkinson’s, among others (Eisenberg 2010). In Alzheimer’s disease, some imaging findings have been used for diagnosis in humans, such as prominent total brain atrophy (Chan et al. 2001a), specially the frontal orbital area (Resnick et al. 2003) and temporal lobe, particularly the hippocampus (Chan et al. 2001b).
In dogs, it had also been identified differences in brain atrophy rate between healthy animals and dogs with cognitive impairment, since it was detected that the thickness of the interthalamic adhesion is significantly decreased in affected animals (Hasegawa et al. 2005).
The determination of these imaging findings associated to brain parenchymal diseases in humans and dogs, however, was only made possible as a result of studies focusing on the investigation of the normal changes in brain parenchyma during the senescence process in these species, highlighting the importance of the knowledge of the effects of senility.
So far, there is no imaging data in the literature regarding the age-related changes in the brain of cats. Thus, the objective of this study was to identify the effect of senility in brain parenchyma of healthy adult, mature and geriatric domestic cats by magnetic resonance imaging (MRI). Our hypothesis is that cats suffer reduction in brain volume as advancing age, as well as focal changes in signal intensity in parenchyma.
MATERIALS AND METHODS
In this study, approved by our ethic committee for animal experimentation, were only used cats belonging to owners who agreed to participate in the study and signed a consent after the explanation of the procedure and the risks related to anesthesia and contrast administration.
Animals. Thirty-three neutered non-brachycephalic domestic
cats (Felis catus) were investigated and divided into three groups according to age, as classification previously described (Lund et al. 1999, Fortney 2012, Laflamme & Gunn-Moore 2014). The group of adult animals included 12 cats aged 1 to 6 years (group A), the group of mature animals comprehended 11 cats aged 7 to 11 years (group B), and the group of geriatric animals comprised 10 cats aged 12 years and older (group C).
The average age obtained from 2 males and 10 females of the group of the adult animals was 2.00±0.74 years (1-4 years) and the average weight was 3.96±0.69 kg. Considering the group of the mature animals, the mean value determined for age and weight of the 3 males and 8 females were 8.54±1.37 years (7-11 years) and 4.91±2.80 kg, respectively. The average age and weight calculated from 2 males and 8 females of the group of the geriatric cats were 14.00±1.33 years (12-16 years) and 4.08±1.12 kg, respectively.
Selected animals could not have history of neurological disorders and, therefore, the owners were asked about symptoms such as excessive vocalization, aggression, decreased physical activity,
Later, the cats were submitted to general and neurological physical assessment performed by a single evaluator and only animals considered healthy were included in this study. Neurological examination included general inspection, which was carried out by assessing the behavior and the state of consciousness; observation of the march; attitude and posture reactions by proprioception tests; and cranial nerves examinations, as blink-to-threat reflex, eyelid reflex, pupillary light reflex, evaluation of pupillary size and hearing test, as reported by Fitzmaurice (2010).
Polymerase chain reaction (PCR) for feline immunodeficiency (FIV) and leukemia (FeLV) viruses, blood count, serum biochemistry (urea, creatinine, aspartate aminotransferase, alkaline phosphatase, gamma glutamyl transferase, total plasma protein, albumin, globulin), thoracic radiographs and abdominal ultrasound were performed to ensure that animals were healthy and thus apt to be anesthetized and submitted to the contrast medium administration.
Magnetic resonance imaging. Cats were anesthetized and, thus,
they were subjected to 12-hours of fasting and 2-hours of water deprivation. Pre-anesthetic medication consisted in intramuscular injection of 0.05mg/kg 0.2% acepromazine (Apromazin; Syntec Brazil, Cotia, SP, Brazil) and 0.3mg/kg morphine sulphate (Dimorf; Cristália, Itapira, SP, Brazil). The anesthesia was induced by intravenous administration of propofol (Propovan; Cristália, Itapira, SP, Brazil) through the cephalic vein catheterization at the rate of 6mg/kg or until the loss of laryngotracheal reflection for endotracheal intubation. The endotracheal tube was connected to Bain circuit and isoflurane vaporizer (Isoforine; Cristália, Itapira, SP, Brazil) was adjusted to maintain a moderate plane of anesthesia. Parameters, such as capnography, pulse oximetry, electrocardiogram and blood pressure were evaluated using multiparameter monitor.
Brain images were acquired in low-field MRI system (0.25T - Vet MR Grande; ESAOTE, Genova, Italy) on transverse T1- (TE: 18ms / TR: 433,333ms), T2- (TE: 120ms / TR: 5100ms) and post-contrast T1-weighted sequences. The latter sequence was initiated one minute after the intravenous injection of 0.2mmol/kg paramagnetic contrast agent (Dotarem; Guerbet, Aulnay-sous-bois, France). During the procedure, cats were placed in right lateral decubitus and the skull was arranged inside the most appropriated coil according to cranial dimensions (coil 3 or 4 - ESAOTE, Genova, Italy). The following acquisition parameters were used: slices thickness = 3.0mm, gap = 0.3mm, matrix = 224x192 and FOV = 14cm.
Image evaluation. Image analysis was performed using the
medical image software application OsiriX (OsiriX v.6.0.2; OsiriX, Atlanta, GA, USA) by a single experienced radiologist, blinded to patient identification, which primarily certified the absence of brain changes by subjective evaluation.
Changes in signal intensity and contrast uptake in brain parenchyma were categorical parameters investigated in this study.
Thickness of the interthalamic adhesion was measured on both T1- and T2-weighted sequences and later it was calculated the average value.
Intracranial volume was also determined and it was used to the correction of the values related to the cerebral and cerebellar volumes by calculating the percentage of their volumes in relation to intracranial volume.
The values of the continuous parameters analyzed in this study have resulted from the mean obtained by the measurements performed in triplicate by the evaluator.
Statistical analysis. Statistical analysis was performed
using the software SPSS 17.0 (SPSS Inc., Chicago, Illinois, USA). The median of the single nonparametric continuous variable, cerebellar volume was analyzed by Kruskal-Wallis test. To compare the average values of the continuous variables with normal distribution, it was used ANOVA test followed by Bonferroni multiple comparison test.
Fig.1. MRI brain images on transverse T1-weighted sequence of a 14-year-old female mixed breed cat, illustrating the measurement of cerebral volume.
intracranial volume and age; percentage of the cerebellar volume by intracranial volume and age; percentage of the cerebral parenchyma volume by intracranial volume and percentage of the cerebellar volume by intracranial volume; thickness of the interthalamic adhesion and age; and thickness of the interthalamic adhesion and percentage of the cerebral parenchyma volume by intracranial volume.
Statistical level of significance for all tests was set at 5% (p<0.05).
RESULTS
In the present study, no abnormalities in signal intensity and contrast uptake were identified in brain parenchyma of the cats.
Thickness of the interthalamic adhesion was significantly lower in geriatric cats in relation to the adults (Table 1 and 2). The thickness was 0.28mm lower in the mature cats than the adults and 0.32mm lower in the geriatric animals in relation to the mature cats. Assuming the value found in adults as basis, the thickness of the interthalamic adhesion suffered a decrease of 5.81% between mature animals and adults and
Estimated annual rate of reduction of the interthalamic adhesion thickness, using the difference between the average ages of the groups, was 0.89% in the early phase (between adult and mature groups) and 1.18% in the late phase (between mature and geriatric groups).
There was no significant difference between the cerebral volume of the groups, however, the percentage of the cerebral volume in relation to intracranial volume was significantly lower in geriatric animals compared to the adults, as well as the percentage of the cerebral parenchyma volume in relation to intracranial volume (Table 1 and 2).
Percentage of the cerebral parenchyma volume by intracranial volume reduced in 1.39% between adults and mature cats and 2.04% between mature and geriatric animals. Considering the percentage calculated for adults as basis, it was identified a decrease of 2.11% between adult and mature animals, 3.06% between mature and geriatric cats and 5.17% between the adult and geriatric group.
Table 1. Mean, standard deviation (SD), minimum and maximum values and p-value of the comparison of the parametric continuous variables between adults, mature and geriatric cats
Parameters Groups N Mean SD Minimum Maximum P value
Thickness of the interthalamic adhesion (mm) A 12 4.82 0.44 4.14 5.43 0.028*
B 11 4.54 0.42 3.80 5.08
C 10 4.23 0.60 3.25 5.25
Cerebral volume (cm3) A 12 18.58 1.46 16.40 21.72 0.332
B 11 18.16 1.60 15.33 21.09
C 10 17.59 1.54 15.03 19.84
Cerebral volume x100/intracranial volume (%) A 12 66.30 2.04 62.44 68.24 0.003*
B 11 65.10 1.70 62.69 68.72
C 10 63.15 2.11 60.25 66.95
Cerebral parenchyma volume x100/ intracranial volume (%) A 12 66.24 2.01 62.16 68.09 0.001*
B 11 64.84 1.66 62.65 68.58
C 10 62.81 2.11 59.76 66.55
Cerebellar volume x100/intracranial volume (%) A 12 34,00 0.71 32.53 35.07 0.039*
B 11 34.04 0.47 33.17 34.81
C 10 33.33 0.82 32.26 34.67
A = Adult cats, B = mature cats, C = geriatric cats; * Statistically significant difference between groups (P<0.05).
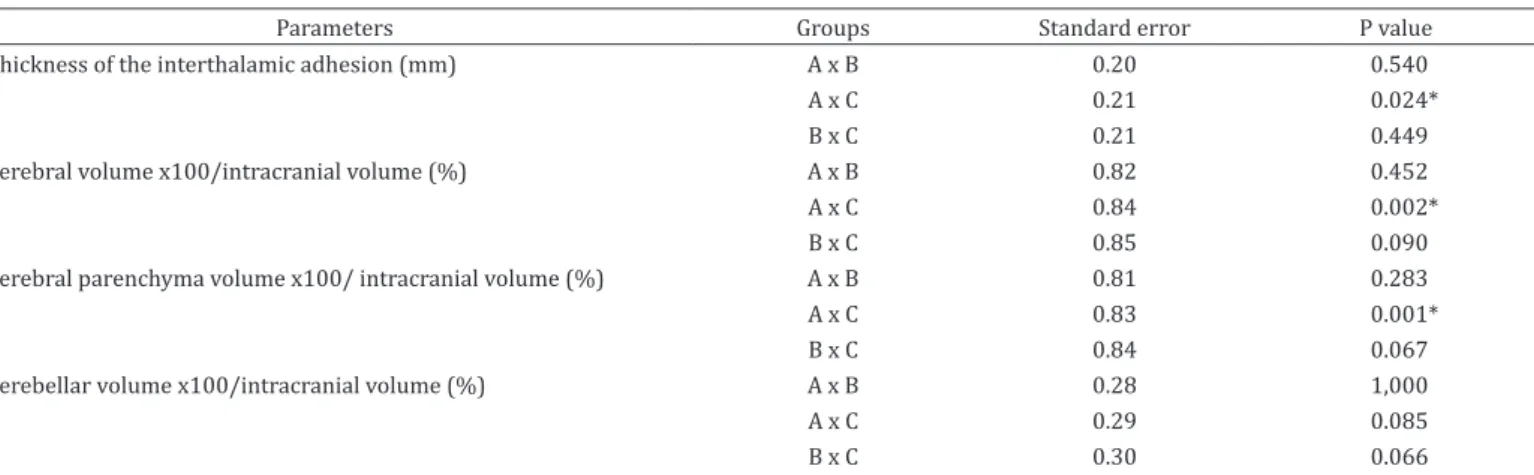
Table 2. Standard error and p-value obtained in the multiple comparison test of the parametric continuous variables with
significant p-values between adults, mature and geriatric cats
Parameters Groups Standard error P value
Thickness of the interthalamic adhesion (mm) A x B 0.20 0.540
A x C 0.21 0.024*
B x C 0.21 0.449
Cerebral volume x100/intracranial volume (%) A x B 0.82 0.452
A x C 0.84 0.002*
B x C 0.85 0.090
Cerebral parenchyma volume x100/ intracranial volume (%) A x B 0.81 0.283
A x C 0.83 0.001*
B x C 0.84 0.067
Cerebellar volume x100/intracranial volume (%) A x B 0.28 1,000
A x C 0.29 0.085
B x C 0.30 0.066
Estimated annual rate of decrease of the percentage of the cerebral parenchyma volume in relation to intracranial volume, using the difference between the mean ages of the groups, was 0.21% in the early phase and 0.37% in the late phase.
There was no significant difference between the cerebellar volumes of the groups (Table 3). ANOVA test showed significant difference between the percentage of the cerebellar volume in relation to intracranial volume of the groups, however, Bonferroni multiple comparison test did not demonstrate significant difference (Table 1 and 2).
Strong negative correlation was found between percentage of the cerebral parenchyma volume by intracranial volume and age, and strong positive correlation was found between percentage of the cerebral parenchyma volume by intracranial volume and percentage of the cerebellar volume by intracranial volume. There was no significant correlation between percentage of the cerebellar volume by intracranial volume and age. It was identified moderate negative correlation between thickness of the interthalamic adhesion and age and moderate positive correlation between thickness of the interthalamic adhesion and percentage of the cerebral parenchyma volume by intracranial volume.
DISCUSSION
The significant decrease of the percentage of the cerebral parenchyma volume in relation to intracranial volume in geriatric cats compared with adults, indicates the occurrence of cerebral atrophy in cats of increasing age, as also reported by several studies in humans (Coffey et al. 1992, Courchesne et al. 2000, Jernigan et al. 2001, Beason-Held & Horwitz 2002, Ge et al. 2002, Resnick et al. 2003, Scahill et al. 2003, DeCarli et al. 2005, Fotenos et al. 2005, Walhovd et al. 2005, Kruggel 2006, Ziegler et al. 2012, Fjell et al. 2014, Storsve et al. 2014) and dogs (Tapp & Siwak 2006, Pugliese et al. 2010).
Strong negative correlation was found between age and percentage of the cerebral parenchyma volume by intracranial volume in cats (r=-0.600), which is partially consistent with the findings reported in humans, since weak negative correlation was found between age and white matter volume reduction and strong negative association was detected between age and gray matter atrophy (Jäncke et al. 2015).
Estimated annual rates of cerebral parenchymal atrophy in early (0.21%) and late (0.37%) phases are similar to the annual values of cerebral atrophy rates identified in humans in longitudinal (0.32%) and transverse (0.33%) analysis of a study (Scahill et al. 2003), and to the rate of 0.45% per year determined by other authors (Fotenos et al. 2005).
The significant reduction of the thickness of the interthalamic adhesion in geriatric cats in this study suggests the occurrence of atrophy of this structure, which is attributed not only to cell loss, but also to compaction and cell retraction in
humans (Turlejski & Djavadian 2012). These findings do not corroborate the results found in humans by some authors (Jernigan et al. 2001), however, they are consistent with data reported by most studies, which detected volumetric reduction of the thalamus as advancing age in humans (Pfefferbaum et al. 1990, 2013, Walhovd et al. 2005, Van der Elst et al. 2007, Fjell et al. 2009, Walhovd et al. 2011).
In dogs, the thickness of the interthalamic adhesion is considered an important marker for monitoring the progression of cerebral atrophy (Hasegawa et al. 2005). Thus, we compared the results of the thickness of the interthalamic adhesion and volume of the cerebral parenchyma corrected for intracranial volume. Significant positive association was found between these two parameters; however, the correlation was considered moderate (r=0.410). Considering correlations of these two variables with age, it was observed a higher correlation between age and percentage of the cerebral parenchyma volume by intracranial volume (r=-0.600) in comparison to the association between the thickness of the interthalamic adhesion and age (r=-0.438). These data suggest that perhaps the thickness of the interthalamic adhesion is not the best parameter to be evaluated for monitoring cerebral atrophy in cats.
Considering the percentage of the cerebral parenchyma volume by intracranial volume, it was noted that the cerebral volume reduction was most pronounced between mature and geriatric groups, as well as the decrease of the interthalamic adhesion thickness. These results are consistent with a research conducted in humans that demonstrate acceleration in brain atrophy rate as advancing age (Scahill et al. 2003).
Changes in signal intensity of the brain parenchyma have been identified in MRI images of humans with increasing age, as white matter hyperintensities on T2-weighted and FLAIR (Awad et al. 1986, Meyer et al. 1992, Beason-Held & Horwitz 2002, Grueter & Schulz 2012). These areas, which are originated by continuous damage to the brain white matter, are characterized by neuronal loss, demyelination and gliosis in the neuropathological examination (Fazekas et al. 1993). These changes in parenchymal signal intensity were not evident in the cats of this study and one explanation for this occurrence is the use of a low-field MRI system (0.25T), since the images acquired by these equipment’s have lower spatial resolution and signal to noise ratio that high-field systems, interfering with the quality of the images (Hayashi et al. 2004).
The selection of animals with no symptoms consistent with cognitive dysfunction syndrome in the present study may also have contributed to these lesions had not been found in brain images. The reason for this fact is that changes in signal intensity of the brain parenchyma are related to ischemic processes in humans (Awad et al. 1986, Meyer et al. 1992, Beason-Held & Horwitz 2002), which in turn, is linked to the
Table 3. Median, minimum and maximum values and p-value of the comparison of the non-parametric continuous variable between adults, mature and geriatric cats
Parameter Groups N Median Minimum Maximum P value
Cerebellar volume (cm3) A 12 3.46 3.18 3.88 0.235
B 11 3.67 2.99 4.61
C 10 3.81 3.12 4.32
Another possibility for these lesions had not been seen in MRI images is related to the age of the cats. Changes in parenchymal signal intensity may be evidenced in animals with higher ages, since these lesions are strongly associated with age in humans (Awad et al. 1986, DeCarli et al. 2005, Grueter & Schulz 2012).
CONCLUSIONS
The results of this study support the hypothesis that domestic cats suffer atrophy of the cerebral parenchyma, as well as the interthalamic adhesion, with advancing age. However, the results do not confirm the hypothesis of cerebellar volume reduction and focal changes in signal intensity of the brain parenchyma in cats during senility.
The use of low-field magnetic resonance imaging (MRI) equipment and the selection of a reduced number of cats are considered a limitation for this study. Further results investigating a larger number of cats with higher ages, healthy and with cognitive disorder, in high-field MRI system, are necessary to enable detection of additional alterations associated with senility.
Acknowledgements.- The study was supported by Fundação de Amparo à Pesquisa do Estado de São Paulo (2013/06148-0 and 2012/18750-3).
REFERENCES
Awad I.A., Spetzler R.F., Hodak J.A., Awad C.A. & Carey R. 1986. Incidental subcortical lesions identified on magnetic resonance imaging in the elderly. I. Correlation with age and cerebrovascular risk factors. Stroke 17(6):1084-1089. http://dx.doi.org/10.1161/01.STR.17.6.1084. PMid:3810705. Beason-Held L.L. & Horwitz B. 2002. Aging brain, p.43-57. In: Ramachandran
V.S. (Ed.), Encyclopedia of the Human Brain. Academic Press, New York. http://dx.doi.org/10.1016/B0-12-227210-2/00009-1.
Chan D., Fox N.C., Jenkins R., Scahill R.I., Crum W.R. & Rossor M.N. 2001a. Rates of global and regional cerebral atrophy in AD and frontotemporal dementia. Neurology 57(10):1756-1763. http://dx.doi.org/10.1212/ WNL.57.10.1756. PMid:11723259.
Chan D., Fox N.C., Scahill R.I., Crum W.R., Whitwell J.L., Leschziner G., Rossor A.M., Stevens J.M., Cipolotti L. & Rossor M.N. 2001b. Patterns of temporal lobe atrophy in semantic dementia and Alzheimer’s disease. Ann. Neurol. 49(4):433-442. http://dx.doi.org/10.1002/ana.92. PMid:11310620. Coffey C.E., Wilkinson W.E., Parashos L.A., Soady S.A., Sullivan R.J., Patterson
L.J., Figiel G.S., Webb M.C., Spritzer C.E. & Djang W.T. 1992. Quantitative cerebral anatomy of the aging human brain: a cross-sectional study using magnetic resonance imaging. Neurology 42(3 Pt 1):527-536. http://dx.doi. org/10.1212/WNL.42.3.527. PMid:1549213.
Courchesne E., Chisum H.J., Townsend J., Cowles A., Covington J., Egaas B., Harwood M., Hinds S. & Press G.A. 2000. Normal brain development and aging: quantitative analysis at in vivo MR imaging in healthy volunteers. Radiology 216(3):672-682. http://dx.doi.org/10.1148/radiology.216.3.r00au37672. PMid:10966694.
DeCarli C., Massaro J., Harvey D., Hald J., Tullberg M., Au R., Beiser A., D’Agostino R. & Wolf P.A. 2005. Measures of brain morphology and infarction in the framingham heart study: establishing what is normal. Neurobiol. Aging 26(4):491-510. http://dx.doi.org/10.1016/j.neurobiolaging.2004.05.004.
PMid:15653178.
Eisenberg R.L. 2010. Clinical imaging: an atlas of differential diagnosis. 5th ed. Wolters Kluwer Health/Lippincott Williams and Wilkins, Philadelphia. 1442p.
dx.doi.org/10.1212/WNL.43.9.1683. PMid:8414012.
Fitzmaurice S.N. 2010. Saunders Solutions in Small Animal Practice: small animal neurology. Elsevier, London. 352p.
Fjell A.M., Walhovd K.B., Fennema-Notestine C., McEvoy L.K., Hagler D.J., Holland D., Brewer J.B. & Dale A.M. 2009. One-year brain atrophy evident in healthy aging. J. Neurosci. 29(48):15223-15231. http://dx.doi.org/10.1523/ JNEUROSCI.3252-09.2009. PMid:19955375.
Fjell A.M., McEvoy L., Holland D., Dale A.M. & Walhovd K.B. 2014. What is normal in normal aging? Effects of aging, amyloid and Alzheimer’s disease on the cerebral cortex and the hippocampus. Progr. Neurobiol. 117:20-40. http://dx.doi.org/10.1016/j.pneurobio.2014.02.004. PMid:24548606. Fortney W.D. 2012. Implementing a successful senior/geriatric health care
program for veterinarians, veterinary technicians, and office managers. Vet. Clin. N. Am., Small Anim. Pract.42(4):823-834, viii. http://dx.doi. org/10.1016/j.cvsm.2012.04.011. PMid:22720816.
Fotenos A.F., Snyder A.Z., Girton L.E., Morris J.C. & Buckner R.L. 2005. Normative estimates of cross-sectional and longitudinal brain volume decline in aging and AD. Neurology 64(6):1032-1039. http://dx.doi.org/10.1212/01. WNL.0000154530.72969.11. PMid:15781822.
Ge Y., Grossman R.I., Babb J.S., Rabin M.L., Mannon L.J. & Kolson D.L. 2002. Age-related total gray matter and white matter changes in normal adult brain. Part I: volumetric MR imaging analysis. Am. J. Neuroradiol.
23(8):1327-1333. PMid:12223373.
Grueter B.E. & Schulz U.G. 2012. Age-related cerebral white matter disease (leukoaraiosis): a review. Postgrad. Med. J. 88(1036):79-87. http://dx.doi. org/10.1136/postgradmedj-2011-130307. PMid:22184252.
Hasegawa D., Yayoshi N., Fujita Y., Fujita M. & Orima H. 2005. Measurement of interthalamic adhesion thickness as a criteria for brain atrophy in dogs with and without cognitive dysfunction (dementia). Vet. Radiol. Ultrasound 46(6):452-457. http://dx.doi.org/10.1111/j.1740-8261.2005.00083.x.
PMid:16396259.
Hayashi N., Watanabe Y., Masumoto T., Mori H., Aoki S., Ohtomo K., Okitsu O. & Takahashi T. 2004. Utilization of low-field MR scanners. Magn. Reson. Med. Sci. 3(1):27-38. http://dx.doi.org/10.2463/mrms.3.27. PMid:16093617. Jäncke L., Mérillat S., Liem F. & Hänggi J. 2015. Brain size, sex, and the aging brain. Human Brain Mapping 36(1):150-169. http://dx.doi.org/10.1002/ hbm.22619. PMid:25161056.
Jernigan T.L., Archibald S.L., Fennema-Notestine C., Gamst A.C., Stout J.C., Bonner J. & Hesselink J.R. 2001. Effects of age on tissues and regions of the cerebrum and cerebellum. Neurobiol. Aging 22(4):581-594. http:// dx.doi.org/10.1016/S0197-4580(01)00217-2. PMid:11445259. Kruggel F. 2006. MRI-based volumetry of head compartments: normative values
of healthy adults. Neuroimage 30(1):1-11. http://dx.doi.org/10.1016/j. neuroimage.2005.09.063. PMid:16289929.
Laflamme D. & Gunn-Moore D. 2014. Nutrition of aging cats. Vet. Clin. N. Am., Small Anim. Pract. 44(4):761-774, vi. http://dx.doi.org/10.1016/j. cvsm.2014.03.001. PMid:24951345.
Landsberg G.L. & Araujo J.A. 2005. Behaviour problems in geriatric pets. Vet. Clin. N. Am., Small Anim. Pract. 35(3):675-698. http://dx.doi.org/10.1016/j. cvsm.2004.12.008. PMid:15833565.
Lund E.M., Armstrong P.J., Kirk C.A. & Klausner J.S. 1999. Health status and population characteristics of dogs and cats examined at private veterinary practices in the United States. J. Am. Vet. Med. Assoc. 214(9):1336-1341. PMid:10319174.
Meier-Ruge W., Ulrich J., Brühlmann M. & Meier E. 1992. Age-related white matter atrophy in the human brain. Ann. N.Y. Acad. Sci. 673:260-269. http://dx.doi.org/10.1111/j.1749-6632.1992.tb27462.x. PMid:1485724. Meyer J.S., Kawamura J. & Terayama Y. 1992. White matter lesions in the elderly. J. Neurol. Sci. 110(1/2):1-7. http://dx.doi.org/10.1016/0022-510X(92)90002-3. PMid:1506848.
Pfefferbaum A., Sullivan E.V., Jernigan T.L., Zipursky R.B., Rosenbloom M.J., Yesavage J.A. & Tinklenberg J.R. 1990. A quantitative analysis of CT and cognitive measures in normal aging and Alzheimer’s disease. Psychiatry Res. 35(2):115-136. http://dx.doi.org/10.1016/0925-4927(90)90015-X. PMid:2100804.
Pfefferbaum A., Rohlfing T., Rosenbloom M.J., Chu W., Colrain I.M. & Sullivan E.V. 2013. Variation in longitudinal trajectories of regional brain volumes of healthy men and women (ages 10 to 85 years) measured with atlas-based parcellation of MRI. Neuroimage 65:176-193. http://dx.doi.org/10.1016/j. neuroimage.2012.10.008. PMid:23063452.
Pugliese M., Carrasco J.P., Gomez-Anson B., Andrade C., Zamora A., Rodríguez M.J., Mascort J. & Mahy N. 2010. Magnetic resonance imaging of cerebral involutional changes in dogs as markers of aging: an innovative tool adapted from a human visual rating scale. Vet. J. 186(2):166-171. http://dx.doi. org/10.1016/j.tvjl.2009.08.009. PMid:19748805.
Resnick S.M., Pham D.L., Kraut M.A., Zonderman A.B. & Davatzikos C. 2003. Longitudinal magnetic resonance imaging studies of older adults: a shrinking brain. J. Neurosci. 23(8):3295-3301. http://dx.doi.org/10.1523/ JNEUROSCI.23-08-03295.2003. PMid:12716936.
Scahill R.I., Frost C., Jenkins R., Whitwell J.L., Rossor M.N. & Fox N.C. 2003. A longitudinal study of brain volume changes in normal aging using serial registered magnetic resonance imaging. Arch. Neurol. 60(7):989-994. http://dx.doi.org/10.1001/archneur.60.7.989. PMid:12873856. Seeley W.W., Crawford R.K., Zhou J., Miller B.L. & Greicius M.D. 2009.
Neurodegenerative diseases target large-scale human brain networks. Neuron 62(1):42-52. http://dx.doi.org/10.1016/j.neuron.2009.03.024.
PMid:19376066.
Storsve A.B., Fjell A.M., Tamnes C.K., Westlye L.T., Overbye K., Aasland H.W. & Walhovd K.B. 2014. Differential longitudinal changes in cortical thickness, surface area and volume across the adult life span: regions of accelerating and decelerating change. J. Neurosc. 34(25):8488-8498. http://dx.doi. org/10.1523/JNEUROSCI.0391-14.2014. PMid:24948804.
Tapp P.D. & Siwak C.T. 2006. The canine model of human brain aging: cognition, behavior, and neuropathology, p.415-434. In: Conn P.M. (Ed.), Handbook of Models for Human Aging. Academic Press, New York. http://dx.doi. org/10.1016/B978-012369391-4/50036-9.
Turlejski K. & Djavadian R. 2012. Life-long stability of neurons: a century of research on neurogenesis, neuronal death and neuron quantification in adult CNS. Progr. Brain Res. 136:39-65. http://dx.doi.org/10.1016/ S0079-6123(02)36006-0. PMid:12143397.
Van Der Elst W., Van Boxtel M.P.J., Van Breukelen G.J.P. & Jolles J. 2007. Assessment of information processing in working memory in applied settings; the paper and pencil memory scannning test. Psychol. Med. 37(9):1335-1344. http://dx.doi.org/10.1017/S0033291707000360.
PMid:17376260.
Walhovd K.B., Fjell A.M., Reinvang I., Lundervold A., Dale A.M., Eilertsen D.E., Quinn B.T., Salat D., Makris N. & Fischl B. 2005. Effects of age on volumes of cortex, white matter and subcortical structures. Neurobiol. Aging 26(9):1261-1270, discussion 1275-1278. http://dx.doi.org/10.1016/j. neurobiolaging.2005.05.020. PMid:16005549.
Walhovd K.B., Westlye L.T., Amlien I., Espeseth T., Reinvang I., Raz N., Agartz I., Salat D.H., Greve D.N., Fischl B., Dale A.M. & Fjell A.M. 2011. Consistent neuroanatomical age-related volume differences across multiple samples. Neurobiol. Aging 32(5):916-932. http://dx.doi.org/10.1016/j. neurobiolaging.2009.05.013. PMid:19570593.