UNIVERSIDADE FEDERAL DE SÃO CARLOS CENTRO DE CIÊNCIAS EXATAS E DE TECNOLOGIA
PROGRAMA DE PÓS-GRADUAÇÃO EM CIÊNCIA E
ENGENHARIA DE MATERIAIS
EVALUATION OF Ti-6Al-4V FRICTION SURFACING COATINGS REINFORCED WITH CARBIDES
Carlos Alberto Belei Feliciano
UNIVERSIDADE FEDERAL DE SÃO CARLOS CENTRO DE CIÊNCIAS EXATAS E DE TECNOLOGIA
PROGRAMA DE PÓS-GRADUAÇÃO EM CIÊNCIA E
ENGENHARIA DE MATERIAIS
EVALUATION OF Ti-6Al-4V FRICTION SURFACING COATINGS REINFORCED WITH CARBIDES
Carlos Alberto Belei Feliciano
Dissertation presented to Programa de Pós-Graduação em Ciência e Engenharia de Materiais to obtain the MASTER OF SCIENCE DEGREE IN MATERIALS SCIENCE AND ENGINEERING
Supervisor: Dr. Nelson Guedes de Alcântara
Grant Agency: CNPq (Process no. 131389/2016-5)
RESUME
ACKNOWLEDGMENTS
I would like to thank my close relatives for all the love and support.
My professor Nelson for the important talks and for the opportunity to work and live abroad.
All Helmholtz-Zentrum Geesthacht employees. CNPq for the financial support.
All my friends who stuck with me, from my hometown to Hamburg. You know who you are. Special thanks to my good friend Bruno (“Cebola”) without whom none of this would happen.
My supervisors Viktoria and Stefanie for the mentorship. This work would not be possible without them. And also for the fun times and friendship.
ABSTRACT
Friction surfacing is a thermo-mechanical process employed to deposit coatings in solid state resorting to friction between a rotating consumable rod and a substrate. The current work focuses on deposition of Ti-6Al-4V coatings reinforced with carbide particles (TiC, B4C and SiC) on Ti-6Al-4V substrate.
Particles were added using holes drilled into the rod tip. Different configurations of hole placements within the rod were correlated with process behavior, coating quality, deposition efficiency and particle distribution within the deposits. Configurations varied in number of holes and their distance to the rod’s cross -sectional center. Holes placed near to the rod center increased axial forces during the plastification stage, whereas particles in holes far off the rod center were mainly expelled, not yielding as much effect on the process response. An increase in number of holes amplified the effects of the hole distance. The axial force during plastification stage affected both coating appearance and process efficiency. No full intermixing of coating material and particles during deposition occurred, thereby preventing a uniform distribution of particles throughout the coatings. Particles were mostly deposited along trails, which influenced the behavior of growing grains during recrystallization. B4C and SiC particles
underwent dissolution, whose degree was influenced by the rotational speed. Moreover, a refined α-Ti microstructure was reported, related to the development of shear bands independent of the particles’ presence.
AVALIAÇÃO DA DEPOSIÇÃO POR FRICÇÃO DA LIGA Ti-6Al-4V COM REFORÇO DE CARBETOS
RESUMO
A deposição por fricção (FS) é um processo termomecânico utilizado na deposição em estado sólido de camadas através da fricção entre uma barra metálica, consumível, e um substrato. O presente trabalho foca na deposição da liga Ti-6Al-4V com reforço de carbetos (TiC, B4C e SiC) em forma de partículas
sobre um substrato da mesma liga. Partículas foram adicionadas utilizando furos feitos na extremidade da barra consumível. Diferentes configurações no que diz respeito ao posicionamento e à quantidade de furos na mesma barra foram relacionadas com o comportamento do processo, qualidade e eficiência das deposições e distribuição do reforço ao longo da seção transversal do depósito. Furos posicionados próximos do centro da seção transversal da barra acarretaram no aumento da força axial exercida mela máquina durante o estágio inicial de plastificação, enquanto furos mais distantes do centro foram em sua maioria expelidos, não tendo, assim, influência na resposta do processo. A força axial durante o estágio de plastificação afetou tanto a qualidade quanto a eficiência da deposição. O aumento no número de furos posicionados a mesma distância do centro da barra apenas amplificou tais efeitos. Não houve total mistura entre metal e reforço, o que preveniu uma distribuição uniforme de partículas ao longo do depósito. Partículas foram principalmente depositadas ao longo de faixas, o que influenciou de certa forma o crescimento dos grãos na recristalização durante o processo. Partículas de B4C e SiC sofreram dissolução,
PUBLICATIONS
Published papers on international journals:
- BELEI, C.; FITSEVA, V.; DOS SANTOS, J.F.; ALCÂNTARA, N.G.; HANKE, S.
TiC particle reinforced Ti-6Al-4V friction surfacing coatings. Surface & Coatings
TABLE OF CONTENTS
FOLHA DE APROVAÇÃO... i
ACKNOWLEDGMENTS ... iii
ABSTRACT ... v
RESUMO ... vii
PUBLICATIONS ... ix
TABLE OF CONTENTS ... xi
TABLES LIST ... xiii
FIGURES LIST ... xv
SYMBOLS AND ABBREVIATIONS ... xix
1. INTRODUCTION AND JUSTIFICATION ... 1
2. OBJECTIVES ... 3
3. LITERATURE REVIEW ... 5
3.1. Titanium and its alloys ... 5
3.1.1.Titanium grade 5 (Ti-6Al-4V) ... 6
3.2. Carbides ... 11
3.2.1.Group 4 carbides ... 11
3.2.2.Covalent carbides ... 12
3.3. Metal-matrix composites: strengthening mechanisms ... 13
3.4. Friction-based processes ... 15
3.4.1.Friction Surfacing ... 16
3.4.2.Manufacture of metal-matrix composites ... 20
4. MATERIALS AND METHODS... 23
4.1. Materials ... 23
4.2. Friction Surfacing process ... 24
4.2.1.Machine features ... 24
4.2.2.Process parameters ... 25
4.3. Hole configurations ... 26
4.4. Temperature measurements ... 28
4.5. Evaluation of coating quality by visual analysis ... 28
4.6. Metallographic sample preparation ... 28
5. RESULTS AND DISCUSSION ... 31
5.1. Influence of hole configuration on coating appearance ... 31
5.2. Friction surfacing process response ... 32
5.3. Particle distribution within the coatings ... 37
5.4. Microstructure evolution ... 42
5.4.1.The influence of particles on dynamic recrystallization and its effect on coating hardness ... 49
5.4.2.Particle behavior: dissolution and fracture ... 55
6. GENERAL DISCUSSION ... 71
7. CONCLUSIONS ... 73
8. SUGGESTIONS FOR FUTURE RESEARCH ... 75
TABLES LIST
FIGURES LIST
Figure 3.1 - Possible phase diagram configurations, depending upon the alloying
element [17]. ... 5
Figure 3.2 - Lamellar structure on Ti-6Al-4V [17]. ... 7
Figure 3.3 - Widmanstätten structure on Ti-6Al-4V [21]. ... 7
Figure 3.4 - Martensitic structure on Ti-6Al-4V [22]. ... 8
Figure 3.5 – Schematics of a generic thermomechanical route deployed to obtain a bimodal microstructure on the Ti-6Al-4V alloy. Adapted from [17]. ... 9
Figure 3.6 – Bimodal microstructure on Ti-6Al-4V [24] ... 9
Figure 3.7 – Fully equiaxed microstructure on Tu-6Al-4V [26]. ... 10
Figure 3.8 - Relationship between hardness and temperature for group 4, 5 and 6 carbides [31]. ... 12
Figure 3.9 – Relationship between particle radius and yield strength of a given material. The optimal strength is achieved at Ř, the point where the curve for cutting (~R1/2) and bypassing (~1/R) meet [39]. ... 14
Figure 3.10 – Friction Surfacing process applying several successive layers of aluminum [55]. ... 17
Figure 3.11 – Schematic depiction of the friction surfacing process showing different process stages acc. to [16]. ... 18
Figure 3.12 – Visual representation of the material flow during the FS. Adapted from [66]. ... 19
Figure 4.1 - Size distribution of TiC particles ... 24
Figure 4.2 - Friction surfacing machine. 1) Spindle; 2) consumable rod; 3) moving table; 4) substrate (Helmholtz-Zentrum Geesthacht). ... 25
Figure 4.3 – A schematic of the reinforcement of Ti-6Al-4V rod (longitudinal section) with TiC particles. ... 27
Figure 4.4 - Experimental design deployed to evaluate the process feasibility. Inside each hole, TiC particles were inserted. Each condition was labeled with a code, which is displayed next to the drawings... 27
Figure 5.22 – B4C particle embedded in Ti matrix by FS (rotational speed of 3000
min-1). EDS analysis was performed on the area highlighted by the red circle. 57
Figure 5.23 - Possible reactions involving boron, titanium and carbon, according to their Gibbs free energy of formation. ... 59 Figure 5.24 – Red dot represents the approximate composition of the spot measured by Figure 5.22, projected on a B-C-Ti ternary phase diagram. Adapted from [105]. ... 60 Figure 5.25 - TiB whiskers appearing as a result of degradation of B4C particles
on process runs deposited with rotational speed of 3000 min-1. ... 61
Figure 5.26 - Trail of precipitates delimited by red dashed lines (6000 min-1). EDS
analysis performed on the precipitate-rich strip (1) and on a precipitate free surrounding region. ... 62 Figure 5.27 - Precipitate-rich region, where TiB whiskers are indicated by black arrows. Rotational speed of 6000 min-1. ... 63
Figure 5.28 - SiC particle partially dissolved. Rotational speed of 6000 min-1. . 65
Figure 5.29 - Particle size distribution for deposited TiC particles (a) and TiC particles before the process (b), according to measurements performed on OM and SEM images ... 66 Figure 5.30 – Small TiC particles along shear flow paths (delimited by red dashed lines). Larger particles within those paths elongated in a direction showed by yellow arrows. ... 67 Figure 5.31 – OM image of small SiC particles deposited in parallel to the yellow arrows within a shear flow path delimited by the red dashed lines. No important effects of particle dissolution were observed, as the rotational speed (3000 min -1) was not sufficient to degrade the reinforcement. ... 68
SYMBOLS AND ABBREVIATIONS
AS Advancing Side
ASTM American Standard for Testing of Materials B4C Boron Carbide
EBSD Electron Backscatter Diffraction EDS Energy-Dispersive Spectroscopy HV Vickers Hardness
MMC Metal-Matrix Composite FS Friction Surfacing
FSSW Friction Stir Spot Welding FSW Friction Stir Welding OM Optical Microscope RS Retreating Side
SEM Scanning Electron Microscope SiC Silicon Carbide
alternative materials and processes in their efforts to decrease weight in order to reduce the fuel consumption and save natural resources. As weight reduction comes normally at the expense of the mechanical properties, which are important for structural components, the development of materials with high strength-to-density ratio has been extensively stimulated in the last decades. The deployment of aluminum and titanium alloys in several structural applications follows this trend [1], as well as the evolution of composite technologies, which are essential for the modern industry [2,3].
The desired mechanical properties of lightweight metal alloys can be further improved not only by work hardening or heat treatments, but also by reinforcing them e.g. through addition of hard particles. Such metal matrix composites (MMC) can be used in applications where specific combinations of thermal, chemical and especially mechanical properties are required. There are a vast number of manufacture methods able to reliably produce MMC’s. Among those, friction-based methods have been proving worth of value in the composites manufacture [4–7], especially when one takes into account the complete absence of melting on this group of processes, along with all the advantages that a melting-free method may offer.
15]. Such a deficiency may be potentially overcome by the addition of hard particles.
The effect of the particles on process characteristics, their distribution within the coating material and their influence on the microstructure evolution is to date still unclear, especially for titanium alloys, whose FS depositions without reinforcement particles are already highly sensitive to even subtle changes on process parameters [16]. In such a still underdeveloped scenario, it would be therefore pointless to proceed with mechanical properties testing and studies of feasibility of industrial implementation alike.
Prior to any other kind of investigation, one must be able to produce high quality reinforced coatings, being “high quality” defined here as having good structural uniformity and high concentration of homogeneously dispersed particles with as low reinforcement loss as possible.
Thus, the purpose behind this study is to provide a general knowledge baseline on the friction surfacing of titanium alloys reinforced with particles. This basic understanding will serve as a mainstay for future studies aiming to locally improve surface properties by adding MMC layers to a given component.
2. OBJECTIVES
The main objective of this study is to determine the feasibility of the friction surfacing process applied to deposit Ti-6Al-4V carbide-reinforced coatings on substrates from the same alloy, concerning the technical aspects of the process.
3. LITERATURE REVIEW
3.1. Titanium and its alloys
Titanium is a silver-colored transition metal, known by its outstanding specific strength, low thermic and electric conductivity and a relatively high melting point (up to 1670ºC [17]), in comparison to aluminum, its main competitor in a number of applications.
Similarly to iron and other metals, titanium undergoes an allotropic transformation upon heating. This phenomenon changes its crystal structure from hexagonal close-packed (referred to as α-Ti) to body-centered cubic (β-Ti). The temperature at which this transformation occurs (Tβ) depends upon the alloy composition (Figure 3.1 [17]): titanium grade 1 has a Tβ of 890ºC; alloys where β phase is predominant have Tβ ranging from 700 ºC and 900ºC; α+β alloys reach Tβ generally from 950ºC to 1100ºC [17]. Both α and β phases can coexist at room temperature, also depending upon alloy composition. Normally, titanium alloys are classified in three different classes, according to their composition at equilibrium: α, β and α+β alloys.
Titanium is highly reactive with oxygen. When exposed to an oxygen-rich atmosphere, this metal is converted to TiO2 [17] and TiO (unstable, rapidly
oxidized to TiO2 [18]), constituting a layer frequently called oxide scale [18]. At
room temperature, the oxide scale is a compact layer, which acts as a protective coat against other exterior gases. However, at high temperatures, such a layer becomes porous [18], increasing oxygen diffusion into the scale and ultimately reaching the base material. This eventually makes the oxide scale expands inwards at expense of the base material, as the oxidation goes on. Moreover, an oxygen-rich layer beneath the scale is formed simultaneously with the oxidation itself [17,19]. This interphase is referred to as α-case [17,20], since it is constituted by oxygen-stabilized α phase. Since the α-case is hard and less ductile [20], it may induce crack formation on the surface under mechanical loading [17]. Therefore, the use of an inert atmosphere during processing is essential for titanium alloys. Furthermore, this oxidation behavior renders the titanium useless on any situation taking place above 550ºC, point beyond which oxygen diffusion into oxide scale drastically increases [17].
3.1.1. Titanium grade 5 (Ti-6Al-4V)
Created in 1954 [17], the titanium grade 5, also known as Ti-6Al-4V, is the most utilized titanium alloy worldwide. It contains aluminum ranging between 5.5 and 6.75%, and vanadium between 3.5 and 4.5% (according to ASTM B348-13). The composition in equilibrium is composed by α phase scattered uniformly in the β phase, which places the Ti-6Al-4V alloy under the “α+β alloys” category. The addition of V makes the β phase stable at room temperature and present in a volumetric fraction of approximately 15%.
Figure 3.2 - Lamellar structure on Ti-6Al-4V [17].
As the cooling rate rises, alpha laths thin out. In this case, there is room for lath growth from the interface created between beta grain and alpha laths. In order to reduce elastic strain, such “secondary” laths grow perpendicularly to “primary” laths, which creates what is called “Widmanstätten structure” or “basket weave” (due to the similarities with the way handcrafted baskets are woven), Figure 3.3 [21]. Refined lamellae tend to result in higher yield stress, ductility and high-cycle fatigue resistance in comparison to coarse lamellae [17].
For cooling rates above 1000ºC/min, Widmanstätten structure ceases formation, giving rise to martensitic structure (Figure 3.4 [22]), which can be either α' (hexagonal) or α'’ (orthorhombic) [17,23]. The main difference between the martensitic structure and the ones originated from mild cooling is that the martensite (i) shows needles dispersed all over the beta grain (with different Burgers relationships) and (ii) does not grow from the beta grain boundaries (which is the case for the aforementioned structures, originated from nucleation and growth).
Figure 3.4 - Martensitic structure on Ti-6Al-4V [22].
Figure 3.5 – Schematics of a generic thermomechanical route deployed to obtain a bimodal microstructure on the Ti-6Al-4V alloy. Adapted from [17].
During material recrystallization (Figure 3.5-III), alpha lamellae recrystallize, while beta grains grow along alpha/alpha grain boundaries, separating alpha grains to a distance approximately equal to the size of the beta grain. As a result, primary alpha grains are found at triple junctions. The rest of the microstructure is comprised by alpha laths grown from beta grain boundaries (Widmanstätten) as shown in Figure 3.6. Such a microstructure is named bimodal [17].
With sufficiently low cooling rates from the recrystallization stage, alpha laths do not grow, which means that the entire alpha volumetric fraction would be represented by equiaxed alpha grains. Beta phase now is found at triple junctions between alpha grains (Figure 3.7), which constitutes a fully equiaxed microstructure [17]. Another parameter responsible for the occurrence of such a microstructure instead of the bimodal one is the temperature during the recrystallization stage. While a bimodal microstructure requires temperatures approximately as high as 970 ºC, a fully equiaxed microstructure can be obtained at 800 ºC [25].
Figure 3.7 – Fully equiaxed microstructure on Ti-6Al-4V [26].
From the mechanical properties standpoint, it is known that the bimodal microstructure normally offers higher yield strength and ductility in comparison to the equiaxed one. However, the latter usually presents higher fatigue resistance than the former [17].
3.2. Carbides
Carbides are inorganic compounds formed by carbon and another element, which may be a metal or not. From the material science standpoint, carbides are classified as ceramic materials, usually with very high melting point and hardness. By comparison, while commercially-pure titanium has a hardness of approximately 55 HV, titanium carbide has 3200 HV; while the cp-Ti melts at 1640oC, the titanium
carbide has a melting point clocking in at around 3000oC [29,30]. Thus, carbides are
frequently used as reinforcement on metal-matrix composites, since such an addition enhances gains in properties such as hardness, wear resistance, creep resistance, and so forth.
3.2.1. Group 4 carbides
Figure 3.8 - Relationship between hardness and temperature for group 4, 5 and 6 carbides [31].
3.2.2. Covalent carbides
interstitial carbides, covalent carbides also show ductile-to-brittle transformation. In silicon carbide, for example, the temperature at which this transformation occurs hovers around 1100ºC, depending on the stress state and strain rate [34]. Both silicon and boron carbide are basically inert at room temperature [32].
3.3. Metal-matrix composites: strengthening mechanisms
Metal-matrix composites (MMC’s) are a class of materials comprising metallic alloys, wherein a foreign material is embedded. The embedded material (usually called reinforcement) may be ceramic or another metal and is usually shaped as particles. The interaction between the matrix and its reinforcements can originate several metallurgical phenomena, which are also influenced by the method utilized to assembly the material. Such phenomena are the main responsible for enhancing mechanical strength of the material. Some of the main strengthening mechanisms are namely:
Dislocation generation upon cooling: the difference between the thermal expansion coefficient of both matrix and reinforcement lead to a more intense matrix shrinkage in comparison to the reinforcement one. This induces the matrix to create dislocations in order to accommodate the reinforcement [35].
Reinforcement particles act hindering dislocation movement during deformation: as dislocations reach a reinforcement particle, they can either cut through or bypass the particle. Here, the initial size of particles is an important parameter, as it defines the behavior of dislocation movement when reaching such obstacles. Small, coherent particles (usually smaller than 1 µm [36]) are cut through by dislocation movement upon the deformation (phenomenon usually referred to as Friedel
cutting) [37–39]. On the other hand, large particles are wrapped when reached by a
Figure 3.9 – Relationship between particle radius and yield strength of a given material. The optimal strength is achieved at Ř, the point where the curve for cutting (~R1/2) and bypassing (~1/R) meet [39].
Grain refinement: the relationship between strength and grain size is given by the Hall-Petch equation [42]:
σy= σ0 + kD1/2 (3.1)
where σy represents the yield stress, σ0 the flow stress of a unreformed single crystal
and D is the grain diameter. The constant k depends on the material and dictates the efficiency of the grain boundaries in slowing down dislocation movement. Grain refinement may be achieved on a composite as follows: depending on how the reinforcement is introduced into the metal matrix, recrystallization may occur. In such instances, particles may either aid the nucleation of new grains (known as
particle-stimulated nucleation – PSN [43,44]) or inhibit grain growth by exerting a
dissolution or precipitation [36]. Particle size is an important factor dictating the effectiveness of a given particle on the grain boundary arrest [46,47]. While they might be important for nucleation increase, large particles do not act strongly suppressing grain boundary movement. At equilibrium, the original Zener relation (also known as Zener-Smith relation) between matrix grains and second-phase particles radii is given by
R = 4r/3fv (3.2)
where R is the mean matrix grain radius, r is the mean second-phase particle radius and fv is the volumetric fraction [48].
3.4. Friction-based processes
A friction-based process resorts to the heat generated between two rubbing surfaces to increase temperature and soften materials, which eases the processing. A moving hard tool and a stationary component (to be processed) generally comprise those rubbing surfaces. When contact occurs, friction generates heat, which raises temperature and reduces the mechanical strength of the stationary component, without disturbing the structure integrity of the tool [49]. As mechanical strength dwindles, the component can be deformed to the desired shape. Heat generation decreases with the mechanical resistance of the stationary surface. As the component approaches its melting point, friction itself cannot produce heat anymore [50], which leads to a temperature drop. Thus, under normal circumstances no friction-based process involves melting [49,50].
one on the top of the other. The rotating tool makes contact with only one component first, and drives through it until the other component is finally reached. In the FSSW, the tool also mixes materials from both components, but differs from the FSW since it leaves a single spot welded, in comparison to a welded line featured by the latter.
3.4.1. Friction Surfacing
Friction surfacing (FS) is also a friction-based process. One of its main characteristics is that instead of a tool, a consumable rod (also called mechtrode) is used to promote friction, which avoids problems regarding the tool wear appearing both in FSW and FSSW [6,7,51]. The origins of this process date back from the II World War period [52], remaining relatively distant from any scientific research until the final of the 1980’s, when efficient solutions for surface reinforcement by friction-based techniques began to be studied [50].
Figure 3.10 – Friction Surfacing process applying several successive layers of aluminum [55].
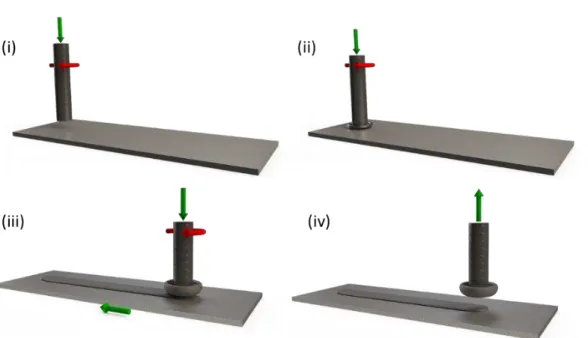
The stages of the process are schematically shown in Figure 3.11. Initially, a consumable rod is brought in contact with the substrate. The rod rotates and is pressed onto the substrate under a pre-set axial force (i). The combination of axial force and rotation in contact with the substrate generates friction and consequently heat, which leads to thermal softening and plastic deformation of the rod’s tip (ii). Part of this “plasticized” material is squeezed out of the contact forming a “flash” around the rod. This results in shortening of the rod, which is recorded by the equipment used.
Figure 3.11 – Schematic depiction of the friction surfacing process showing different process stages acc. to [16].
The FS process allows to deposit different metallic materials, including aluminum alloys [56,57], steels [58–60], Cr60Ni40 [61], copper alloys [62] and cobalt-chromium alloys [63]. The generation of titanium alloy coatings by FS proved to be more complex compared to other reported metallic materials. This is mainly due to the tendency of flash formation at the coatings depending on process parameters such as deposition and rotational speeds [64], and a shift in material behavior and process characteristics at rotation speeds between 1000 and 2000 min-1, resulting in two different deposition regimes [65], which is unprecedented in
comparison to the FS of aforementioned alloys.
Once part of the flash, the material does not actively participate on the deposition process anymore. Figure 3.12 shows the main material flow during the process [66]. Usually, the thermo-affected zone is smaller than the one present in fusion-based processes. This feature is result of lower process temperatures achieved during the deposition [66].
Figure 3.12 – Visual representation of the material flow during the FS. Adapted from [66].
During the process, there are three main controlled parameters, namely: rod’s rotational speed (given in min-1 or rpm), traverse speed (mm s-1) and
deposition rate (or burnoff rate, given in mm s-1), which represents the length of the
rod consumed over a certain time interval. In order to keep a constant deposition rate, the axial force tends to vary along the process, according to the difficulty imposed by the rod material. The deposition rate may also be turned into a process response if one decides to control the axial force instead. In this case, the axial force remains constant, while the deposition rate varies [50].
The FS process has certain features that are frequently boasted as advantages in comparison to deposition techniques that rely upon melting [68,69]. For instance, the FS leads to refined microstructures devoid of defects and hard phases typical of processes where melting takes place [50]. However, it is important to emphasize that the FS shows important disadvantages as well, which have not been overcome to this date. After the process, coatings often present extremities of both advancing and retreating side not bonded to the substrate [70]; those areas need to be machined out in order to the deposited layers be of any commercial value. Another problem inherent to the FS process is the low efficiency. Large portions of the consumed material usually end up surrounding the consumable bar, forming a waste called “flash”, as previously mentioned [66].
The FS process could potentially be utilized to fix structures and on- and off-shore pipes in-situ [71,72], crack control in components present in nuclear powerplants [73], railroad repairs [74] and similar applications. Moreover, this process can also produce industrial and agricultural blades [15,75], knieves [76], reinforced turbine dovetails [59], among others.
3.4.2. Manufacture of metal-matrix composites
a filler material into the weld [4]. Another MMC manufacturing method derived from FSW is friction stir surfacing [5], for which several holes are placed along the weld line (before the process) and filled with the reinforcement. As the rotating tool travels across the weld line, metal and reinforcement are mixed together, generating the composite [5]. The FSSW also offers the possibility of manufacturing MMCs. In this case, the reinforcement is inserted between the parts. The rotating tool makes contact with the metal-powder system, leading to particles being ultimately blended into the metal matrix [78]. However, an important obstacle for those methods is the rapid tool wear due to the high abrasive nature of the used particles [6,7].
According to several studies, the reinforcement of FS coatings with ceramic particles is not only possible, but may improve properties such as hardness and wear resistance as well. In 1994, Bedford et al. studied a case where different steels reinforced with Al2O3 particles were deposited by FS [8].
4. MATERIALS AND METHODS
4.1. Materials
As substrate material, Ti-6Al-4V (ASTM F 136-08) hot-rolled plates with dimensions of 300 mm x 100 mm x 10 mm were used. Consumable rods used were made of the same alloy, in a rolled condition with a diameter of 20 mm. The chemical analysis of the base materials was carried out and results are given in Table 4.1.
Table 4.1 - Chemical composition of the base material consumable rod and plate (wt. %)
Consumable rod Plate Material Ti-6Al-4V Ti-6Al-4V
Fe 0.11 0.11
C 0.03 0.02
N 0.023 0.007
H 0.0039 0.0049
O 0.15 0.049
Al 6.6 6.2
V 3.5 3.9
Ti Bal. Bal.
Figure 4.1 - Size distribution of TiC particles
In order to evaluate the consequences of adding other carbides as reinforcement particles to the coatings (in accordance with the minor objectives of this work), additional experiments were performed using silicon carbide (SiC) and boron carbide (B4C), both with the same size (99% > 14 μm) according to
the supplier.
4.2. Friction Surfacing process
4.2.1. Machine features
Figure 4.2 - Friction surfacing machine. 1) Spindle; 2) consumable rod; 3) moving table; 4) substrate (Helmholtz-Zentrum Geesthacht).
The axial force spans the whole range between 0 and 60 kN, while the rotational speed could be increased up to 6000 rpm. The electric motor of the spindle is able to keep constant rotational speeds, even at high torque peaks (which can be as high as 200 Nm). Sensors are placed in order to detect force in all three directions and the spindle torque. All the information is measured and recorded in a frequency of 100 Hz.
The machine is property of the Helmholtz-Zentrum Geesthacht, where all the coatings used for the present study were deposited.
4.2.2. Process parameters
The process parameters for the current study were used based on the publication of Fitseva et al. for deposition of Ti-6Al-4V alloy layers onto Ti-6Al-4V substrates [64].
During the initial plastification stage, an axial force of 9 kN was fixed. This force was kept until the rod shortened approximately 0.8 mm. From there on, the table started moving and the deposition stage commenced.
feed rate (“consumption rate”) was applied, and the axial force was therefore a resultant parameter, as previously explained. Further, keeping the rod consumption rate constant has the advantage that the consumed length of the rod during the process is always known, enabling to use exactly the rod depth containing the filler material particles.
All the experiments used to evaluate the process feasibility (with TiC) were realized with a rotational speed of 6000 min-1, a rod consumption rate of 1.6 mm
s-1 and a deposition speed of 16 mm s-1.
For the experiments exclusively aimed to observe particle behavior (with B4C and SiC), the same process parameters as the main experiments were
applied, with exception of the rotational speeds, which were 3000 and 6000 min -1.
4.3. Hole configurations
To reinforce the consumable rods with ceramic particles, holes were drilled according to the schematic (for one hole as an example) shown in Figure 4.3. The use of holes to insert particles into the consumable rod was based on the aforementioned study of Gandra et al. where aluminum coatings were reinforced by SiC particles [11]. To realize the desired coating length of approximately 150 mm with process parameters at the aforementioned values, roughly 15 mm of the rod must be consumed. Therefore, the holes were manufactured to an according depth of 15 mm. The diameter of the holes was set to 2 mm, since this dimension was large enough to enable one to insert manually the particles into the drilled cavity with relative ease, while small enough to represent only 1% of the rod’s cross-sectional area. About 14 mm of the depth were filled with ceramic particles, and Ti-6Al-4V wire was pressed into the remaining 1 mm of the hole as a closure.
For the feasibility experiments (with TiC), the number of holes (1 to 3) and their arrangement was varied according to Figure 4.4. For the particle behavior experiments (with B4C and SiC), only one hole was drilled per consumable rod at
Figure 4.3 – A schematic of the reinforcement of Ti-6Al-4V rod (longitudinal section) with TiC particles.
4.4. Temperature measurements
Temperature measurements were carried out to relate microstructural features of the coatings to thermal phenomena. The process temperature was measured using thermocouples set according to Figure 4.5. Temperatures were registered with a frequency of 100 Hz.
Figure 4.5 - A schematic of the thermocouple placement used for temperature measurements during the deposition process
4.5. Evaluation of coating quality by visual analysis
Following their deposition, coatings were evaluated by visual analysis. This analysis was deployed to determine the coating quality, and took into account the following items (in no particular order):
(i) Coating uniformity (ideally, coatings should be as straight as possible on both AS and RS);
(ii) Presence of poorly deposited sections; (iii) Presence of cracks;
(iv) Particle loss to the immediate surroundings.
4.6. Metallographic sample preparation
of the coating; (3) the last 50 mm. The preparation followed standard metallographic procedures. The samples were grinded and polished and the cross sections were etched with Kroll solution. The microstructure of the samples was observed with optical microscopes (Leica Microsystems DM IRM, Wetzlar, Germany; optical microscopes at DEMa - UFSCar) and with scanning electron microscopes (SEM) (Quanta™ 650 FEG and Inspect™ S50, both FEI Europe B.V., Eindhoven, The Netherlands) equipped with electron backscatter diffraction (EBSD) (Digiview IV CCD camera & TSL OIM Analysis 7, EDAX Inc., Mahwah, USA). For the EBSD measurements, an additional vibratory polishing step (VibroMet 2, Buehler, Illinois, USA) was applied for 12 hours, using 0.05 µm Silica suspension.
4.7. Hardness measurements
Microhardness measurements were performed on each feasibility experiment (with TiC), as well as on non-reinforced coatings produced with the same set of machine parameters. Tests were conducted using a BAQ UT 100 (BAQ GmbH, Braunschweig, Germany) hardness mapping machine with a HV0.2 scale. The distance between measurements was 200 μm, which surpassed the minimum of two and one half times the length of the diagonal of one impression (ASTM E92-17). The analyzed surfaces were the coating’s cross-sections extracted according to section 4.6.
The data was processed using Microsoft Excel and Visual Basic for Applications (VBA) routines, according to the following steps:
1) Data exported from the machine to an excel spreadsheet. Hardness values from substrate and surrounding plastic resin were discarded. The result were matrices with rows and columns proportional to the actual cross section dimensions (factor of 200 μm).
Figure 4.6 – Sketch of a generic coating divided in twelve blocks (labeled with roman numerals) according to the indicated dimensions.
2) A control group was established. This control group comprised samples from coatings deposited with identical machine parameters, but devoid of particle reinforcement. The treatment group, therefore, was represented by reinforced samples.
3) For each sample from the control group, an average hardness value was calculated for each one of the aforementioned twelve blocks.
4) For each sample from the treatment group, each value was divided by the average hardness calculated during step 4, depending on the block where the hardness value was situated. For instance, a value present within block II had its value divided by the average block II hardness (from step 4). The resultant hardness values composed matrices with same
dimensions from the ones built on the step 1. Those matrices were also divided into twelve blocks, according to Figure 4.6.
5. RESULTS AND DISCUSSION
5.1. Influence of hole configuration on coating appearance
Figure 5.1 shows the hole geometries with their respective resulting coatings. Irregularities in coating appearance were observed, which mostly included lack of deposition, deposition in a non-straight line and particle loss. The distance between hole and rod center had pivotal importance on the general coating appearance. Experiments with 2 mm distance led to irregular coatings, which became increasingly more regular as the holes moved away. The number of holes within a certain distance only magnified the effects. An increase in particle content in the rods was also reported to be detrimental to the coating quality by [8].
The deposition efficiency of the process is given by the ratio of deposited (approximately) to consumed material volume. The material fraction that is not deposited, i.e. the one that has a negative effect on the deposition efficiency, moves into the flash forming around the rod tip. The efficiency tends to decrease as the number of holes increases (Figure 5.2). This correlates well with the above described observations of the coating appearances. At 8 mm however, experiments displayed virtually the same deposition efficiency regardless of the number of present holes. In fact, the deposition efficiency for 8 mm experiments (around 37%) was close to the one reported for experiments performed with the same set of parameters, but without filled holes in the consumable rod (39%) [64]. Results showed that if placed within holes at 8 mm distance to the rod center, the particles show very little or no effect on the FS process behavior and the resulting coating geometry.
Figure 5.2 - Deposition efficiency calculated for the presented experiments.
5.2. Friction surfacing process response
was used, i.e. a constant axial velocity of the rod was applied and the axial force was a resultant parameter (as described in section 4.2.2). It was reported by Fitseva et al. that the axial force varies with the rotational speed [64]. Since the rotational speed was not changed in the current study, it was expected that the resultant axial force would be comparable in all configurations. During the first FS trials with particles it was observed that very little shortening of the rod was achieved during the initial plastification stage (when axial force was fixed), requiring very long dwell times. Therefore, the axial force during this first process stage was increased to 9 kN, while FS depositions without particles are generally accomplished using 2 kN plastification force.
Figure 5.3 - Axial force diagrams for configurations 3-A, 3-B, 3-C and without particles. The vertical dashed lines indicate the transition between initial plasticizing and deposition stage for each condition after 0.8 mm rod shortening
The axial force of various process runs was plotted over the rod consumption in Figure 5.4. The depth of the filled holes was 15 mm, i.e. beyond that depth, Ti-6Al-4V without particles was deposited. The filled rods with holes at 2 mm distance to the center (upper Figure 5.4) all display higher axial forces than the plain rod up to a shortening of 10 mm, except again for trial 3-A, in which the deposited coating was abnormally thin.
process, axial forces of unfilled rods and those with holes at 8 mm distance to the rod center all ranged at the same value of ≈ 2 kN (lower Figure 5.4).
Process runs with holes 5 mm from the rod center (1-B, 2-B and 3-B) showed comparable force evolution as the ones with one or two holes at 2 mm distance (1-A, 2-A).
vertical dashed lines indicate the transition between plasticizing and deposition stage.
Figure 5.5 – Red dashed line represents the approximate transition from the deposition with high, unstable axial forces to the deposition with stabilized 2 kN. Black arrows indicate the present of cracks on the smoother portion of the coating.
which may be less efficient at creating heat and result in longer plastification stages. Secondly, the particles may be able to roll and slip within the contact, thereby acting comparable to a solid lubricant in reducing the friction and with this the heat generation.
During the deposition stage only the particles in holes 2 and 5 mm to the rod center have a recognizable effect on the FS process. The force fluctuations and the irregular shape of the deposited layers imply that the particles cause instabilities in the heat generation and material flow. It can be further assumed that such instabilities are also causing the delay of initial plastification in those process runs. A higher amount of powder present intensifies these effects. During the periods in which the process runs as desired (depositing a thick layer of material) the particles are predominantly embedded in the soft, flowing metal surrounding them and are deposited with it. In these periods, sufficient heat generation is accomplished by the plastic shear deformation, and the axial force drops.
Hole configurations with large distance to the rod center present a very stable process behavior after the initial plastification stage. Any loose particles here may leave the contact quickly, since inertia (commonly referred to as “centrifugal force” in those situations) drives them out. In the center of the cross section, a direct metal-metal contact between rod and substrate may be possible with little disturbance from moving particles.
5.3. Particle distribution within the coatings
corresponds to the torsional shear flow of the plasticized rod material. Similar particle patterns of silicon carbide and tungsten carbide particles were also observed by Gandra et al. [11] and Rafi et al. [79], respectively.
As discussed previously, the hole placement exerted an important influence on the presence of particles within the coatings. In comparison to coatings generated from other conditions, particles were poorly mixed in for configurations with holes placed 2 mm off the center, remaining packed in large clusters. As distances increased, particles start to experience a pronounced scattering, which extends from the AS to RS. This led to a general decrease in particle volume fraction within the coatings.
According to Figure 5.6, particles take up 19% of 2-A’s cross-sectional area, comparing to 10% of 2-B’s and close to 0% of 2-C’s. Further, the particle distribution allows drawing conclusions on the material flow, assuming that they flow along when they are incorporated into the softened Ti-alloy. Their location therefore leads to the conclusion that material from a 2 mm radius of the rod during deposition flows first towards the RS, and then partially back towards the AS as the rod continues to traverse (arrow in Figure 5.6, 2-A).
Figure 5.6 – Polished cross-sections from the middle section of 2-A, 2-B and 2-C configurations. A large agglomerate of particles is present at the inner regions of the 2-A coating, whereas particles are distributed sparsely near the surface and at the edges of 2-B coating. No particles are observed in 2-C coating.
During surfacing of configurations 1-C, 2-C and 3-C (8 mm off the rod center) very little particle ejection was observed. Instead, clusters of particles were found within the flash formed around the rod tip (Figure 5.7). It can be assumed that the high relative sliding speed between rod and substrate surface close to the outer circumference of the rod cross section results in intense heat generation and fast plastification.
Therefore, particles may be incorporated within the soft material efficiently, preventing them from being ejected. As the rod material from the radius of 8 mm is not deposited, but instead forms the flash, this hole location is not suitable to generate reinforced coatings with the process parameters selected in this study. In [64] for unfilled rods the highest deposition efficiency was reported for 3000 min-1 rotational speed.
that even when changing the process parameters, particles from a hole location 8 mm from the rod center will not be deposited in the coating.
Figure 5.7 – Clusters of particles found within the flash formed around the rod tip during experiment with 1-C configuration.
Among the three different distances used in the present study, only the configurations with holes drilled 5 mm off the rod center offered the possibility of comparing thoroughly the amount of deposited particles according to the number of holes at a constant distance. This arises from the fact that 2 mm configurations did not effectively produce coatings for all sets of hole placements (3-A abnormally thin), in addition to 8 mm configurations not presenting any considerable amount of particles within the layers.
Both configurations equally suffered with intense particle ejection (see Figure 5.1), although 3-B coating had less thickness and width than 2-B.
Figure 5.8– Cross-sections of 1-B and 3-B configurations extracted from the middle section of each coating. While configuration 1-B retained less particles in comparison to 2-B due to fewer holes on the rod, configuration 3-B did not present an increase in reinforcement density in comparison to 2-B.
Particle distribution patterns along the length of the same coating were not uniform in most cases. At the beginning of the deposition stage, particles tended to be concentrated on the RS, with considerably lower amounts deposited in other frequent deposition sites, such as the top surface and the AS.
After approximately 4 to 5 cm of deposition length was achieved, the deposition patterns gradually stabilized, resembling what is displayed by Figure 5.6 and Figure 5.8. Such a tendency may be associated with the axial force during the process. At the first seconds, while the axial force was dropping to a 2 kN plateau (Figure 5.3), it was still higher in comparison to the axial force applied on the remaining process.
The decrease in coating thickness with the axial force was reported also by Gandra et al. in the FS of aluminum alloys without particle reinforcement [54]. As discussed in section 5.2, the particles initially act to reduce adhesion and friction by moving freely within the interface between rotating rod and already deposited material, and thereby limit the heat generation. In this early process stage, they are not well incorporated into the plasticized metal, and therefore few particles are present within the coatings, mainly on the RS and a small amount close to the coating surface.
As the Ti-alloy heats up and a larger volume is plasticized, particles are accommodated by the soft metal and start to follow the material flow to a greater extend, accompanied by a reduction in the required axial force. From the middle to the end of the coating length, the particle distribution remained virtually unchanged, as the applied axial force oscillates around 2 kN.
Figure 5.9 - Cross-sections extracted from the beginning of the coatings generated by 2-A configuration. The cross-sectional area is noticeably lower than the ones observed on samples extracted from the middle section of the coating, which is a product of a lower deposition efficiency during this stage of the process.
5.4. Microstructure evolution
Figure 5.10 shows the process temperature measured using thermocouples during a deposition in configuration 1-B. At the moment when the thermocouple is directly beneath the rotating rod the temperature peaks at 1127oC, dropping to 783 oC one second later (therefore with a cooling rate of
Figure 5.10 – Typical temperature evolution during deposition (configuration 1-B). In this case, peak temperature is 1127ºC.
Figure 5.11 –SEM (backscatter electron) images of the coating microstructure. The Ti-6Al-4V matrix displays Widmanstätten or martensitic alpha lamellae.
Figure 5.12 - Regions containing small equiaxed grains (mostly between 1 and 2 μm).
The formation of bands of fine, equiaxed alpha grains was observed in titanium alloys processed by other thermo-mechanical techniques, and is frequently attributed to the occurrence of shear bands [83–86]. Such a phenomenon does not depend upon the presence of reinforcement particles. The possibility of shear band formation in Ti-6Al-4V at high temperatures was discussed by Seshacharyulu et al. in a study where that alloy was deformed by compression at several different temperatures and strain rates [87]. In that particular study, it can be observed that for strain rates greater than 1 s-1, the
compression at 1100oC revealed oscillatory stress-strain flow curves, credited to
unstable deformation. In turn, such instability was credited to shear bands, found upon microstructural analysis. It is therefore reasonable to assume that such flow instabilities may also affect the FS process, whose peak temperature reached 1127oC with a strain rate of up to 102 s-1.
Shear bands constitute regions where the dislocation density is much higher than in their immediate surroundings. Such a high dislocation density reduces the activation energy for the nucleation of the alpha phase during cooling along those regions. As a result, nucleation of the alpha phase within such regions is intense [88,89], and thus the microstructure along shear bands is refined (Figure 5.12), with grains between 1 μm and 2 μm in size. The characteristic distribution in the shape of bands allows to partially visualize the material flow during the FS process, which otherwise would be concealed by the phase transformation into lamellar alpha [88].
shear banding occurred, frequently with the presence of voids, which can be observed surrounded by the aforementioned equiaxed alpha grains (Figure 5.14).
Figure 5.14 - Sequence of voids surrounded by equiaxed alpha grains.
Figure 5.15 - OM image of an etched specimen where a trail of equiaxed grains can be observed slightly protruding over the matrix surface. Surrounded by that region is a pore with diameter of 34 µm.
Figure 5.16 – Microstructure of a coating reinforced with particles (configuration 1-A). A trail of fine recrystallized α grains and a trail of deposited TiC particles can be observed in between which alpha lamellae are seen.
5.4.1. The influence of particles on dynamic recrystallization and its effect on coating hardness
The OM image of a coating’s microstructure (configuration 2-B) in Figure 5.17 shows a region containing particles located along prior beta grain boundaries. Since particle movement takes place only during the deformation, this indicates that the particles are involved in the recrystallization process of the material during the deposition. During dynamic recrystallization, the migration of high-angle grain boundaries occurs freely until a particle is reached, which locally hinders the further growth of the grain. Once the grain boundary and the particle surface are close to each other, the grain boundary movement over the particle is restrained since the particle exerts a drag force (usually referred as Zener
pinning [45], as previously mentioned) against the grain boundary. This drag force
of the particle counteracts the driving force, intermitting the grain boundary movement. Eventually, an extension of the grain boundary, as large as the diameter of the particle, is replaced by the surface of the particle.
Particle size is an important factor dictating the effectiveness of a given particle on the grain boundary arrest [46,47]. In the present case, the size of the deposited particles, even after the process (where breakage may occur, which therefore would lead to a decrease in the average particle radius) is too large to arrest grain boundaries (2nd stage of the recrystallization). Instead, particles as
big as the ones found on Figure 5.18 may aid the 1st stage of recrystallization,
that is, the nucleation of new grains due to the dislocation field formed surrounding each particle. However, even in a scenario where particle size was appropriate to promote grain boundary pinning and therefore inducing smaller grains during recrystallization, the distribution of deposited particles within the recrystallized region is not sufficiently efficient to produce a considerable grain refinement. As already mentioned, particles tended to be concentrated within specific regions following the process, leaving the rest of the deposit devoid of any reinforcement. Moreover, even at particle-rich regions, the reinforcement was deposited mostly along trails (Figure 5.16 and Figure 5.18) and therefore not randomly. During recrystallization, grain boundaries were able to move freely only until reaching one of those particle trails, where the grain growth was halted. This kind of particle distribution is not as efficient for grain refinement as particles randomly dispersed across the matrix [47].
Figure 5.18 – Microstructure of the coating (configuration 1-A) shows TiC particles mainly deposited along trails delimited by white dashed lines.
Figure 5.19 – Above, cross-sections of 2-A, 2-B and 2-C configurations and their relative hardness for each block, in comparison to regular, non-reinforced
AS
RS
coatings. Darker areas indicate the presence of particles. Below, the standard deviation for each of twelve blocks from measurements on the control group
Cases where relative hardness values stood beyond the standard deviation may be attributed to the high standard deviation of the measured grain sizes found on reinforced areas (close to 50% of the average grain size itself). However, that may not be the only factor contributing to abnormal results, as on some instances hardness measurements could be altered by reasons other than the local grain size. For example, in configuration 2-A (Figure 5.19), hardness values in an excess of 11% lower than the ones found on the control group were observed at the cross section’s inner areas (blocks VIII to IX according to Figure 4.6), which had a particle density much higher than commonly observed on other samples.
Although this result may seem counterintuitive at first, areas with densely packed particles are prone to matrix cracking, which in the present case is largely potentialized by the high cooling rates (see Figure 5.10). This subject will be further discussed in section 5.4.2.2.
Figure 5.20 - OM photo of an area of very high particle density where pores can be observed. Configuration 2-B.
Cracks and pores among reinforcement particles alter hardness measurements in such a way that this kind of test is no longer able to reliably predict the real characteristics of the sample. In this case, the graphical representation of the probabilistic distribution of hardness measurements shifts from a bell curve, typical of a Gaussian (or normal) distribution, to a multi-peak curve, which is related to a multimodal distribution.
Figure 5.21 - Distribution of hardness values from inner cross-sectional areas of samples extracted from two different configurations: 2-A (particle-rich) and 1-C (particle-free). In order to factor out oxygen absorption by outer cross-sectional areas, only the inner regions of the coatings were evaluated.
However, it is important to point out that the low hardness measurements found on densely packed areas may not be necessarily result of cracks and pores. Since the reproducibility of the process was not subject of analysis on the present study, the possibility of the abnormal results being nothing more than a fluctuation around a real value is considerable. Pores and cracks do lower hardness measurements; however, the high quantity of particles should be able to overcome any drop in the hardness value resulting from anything else.
5.4.2. Particle behavior: dissolution and fracture
In this section, particles’ behavior concerning their dissolution and breakage will be addressed. From here on, depositions using the covalent carbides B4C and SiC as reinforcement are introduced, not to further evaluate the
were employed), but instead to compare the different thermodynamic behaviors of different carbides during the process. As mentioned on the “materials and methods” section, it was expected that TiC would withstand the depositions without undergoing degradation. However, it was not clear if other carbides would remain undissolved in the same situation due to the short process time and high cooling rate, which possibly would make particle degradation not severe. In this case, particle dissolution would not be a limiting factor to the process and therefore more particle types could be deployed as reinforcement on an eventual industrial application of the FS process as studied here. This chapter aims to clarify this subject for the FS of titanium alloys.
5.4.2.1. Particle dissolution
5.4.2.1.1. Boron Carbide
B4C reinforcement particles were observed dissolving into the metal matrix
Figure 5.22 – B4C particle embedded in Ti matrix by FS (rotational speed of 3000
min-1). EDS analysis was performed on the area highlighted by the red circle.
Table 5.1 - Results of EDS analysis performed on the highlighted area indicated on Figure 5.22.
Element Weight % Atomic %
B 18.84 45.26
C 3.87 8.37
O 2.46 3.99
Al 4.48 4.31
Ti 67.48 36.60
V 2.87 1.47
At approximately 1400 K (roughly the peak temperature according to measurements, see Figure 5.10), no reaction is thermodynamically favorable between TiC particles and the titanium matrix, which explains the stability of that compound and thus the absence of reinforcement dissolution in such a case. On the other hand, titanium matrix and the B4C particles, when in contact, may
B4C + 3Ti → TiC + 2TiB2 ΔG0 = - 763 kJ/mol (5.1)
B4C + 5Ti → TiC + 4TiB ΔG0 = - 765 kJ/mol (5.2)
Both reactions 5.1 and 5.2 are favorable from the thermodynamic standpoint due to their negative ΔG0. Moreover, even in comparison to other
possible favorable reactions, (5.1) and (5.2) stand out as the ones associated with the lowest ΔG0 (Figure 5.23). Kinetically, at the mentioned temperature,
diffusion is boosted to the point that such reactions can occur even during the short process time.
Reactions 5.1 and 5.2 are exothermic (-795 and -752 kJ/mol respectively [102,103]). Despite the low reinforcement volume (approximately 0.04 cm³, which equals to 0.002 mol of B4C), if all the B4C of one hole reacted, it is estimated that
Figure 5.23 - Possible reactions involving boron, titanium and carbon, according to their Gibbs free energy of formation.
According to either (1) or (2), TiC was formed together with a boride (TiB or TiB2). However, due to the much higher diffusivity (up to 10³ times [104]) of C
in the Ti matrix in comparison to B atoms, TiC was the first component to be created. The contact between this compound and the B4C particle (not yet totally
dissolved) triggers another thermodynamically favored reaction:
B4C + 2TiC → 2TiB2 + 3C ΔG0 = - 284 kJ/mol (5.3)
in contact with the B4C particle does not react, since the reaction between both
compounds is highly unfavorable (Figure 5.23). The data obtained from EDS analysis performed on the new-born phases found around B4C particles projected
on the Ti-B-C ternary diagram indicated the formation of TiB2 (Figure 5.24) [105].
However, considering the limitations inherent to the EDS analysis and the reaction kinetics (which were not thoroughly studied here), there was an important possibility of TiC being still present around B4C particles. Moreover,
reaction 5.2 predicts the formation of TiB, which usually is produced in form of whiskers [106–108]. Such formations were also found around particles (Figure 5.25), albeit at a much smaller concentration. The low incidence of TiB whiskers in comparison to other newborn phases may suggest that reactions 5.1 and 5.2 rapidly took place, which created low quantities of TiB2 and TiB and a high
quantity of TiC. As TiC was produced, it wrapped the B4C particle around,
depriving it of contact with the Ti matrix and consequently making 5.1 and 5.2 halt. From this point, reaction 5.3 began to go off, whereby the majority of TiB2
found was formed.
Figure 5.25 - TiB whiskers appearing as a result of degradation of B4C particles
on process runs deposited with rotational speed of 3000 min-1.
While B4C particles were still present within coatings produced with a
rotational speed of 3000 min-1, the reinforcement was barely observed on
samples from 6000 min-1 process runs, which led to the conclusion that the
dissolution was more severe with increasing rotational speed.
According to [16], no significant increase in process temperature from 3000 to 6000 min-1 occurs, which rules out any possible effects a higher
temperature could have on the particle degradation. Instead, this gain in dissolution rate may be attributed to the more intense fracture of particles as the rotational speed rose up, consequence of a higher number of matrix/reinforcement interactions, induced by the higher deformation rate (particle breakage will be addressed in section 5.4.2.2). Instead of the original B4C particles, trails of a new phase were observed on samples from 6000 min-1
experiments (Figure 5.26 and Figure 5.27).
fully reacted reinforcement particles. As previously mentioned, the newborn phases arising from particles dissolution tend to precipitate in regions such as interfaces and areas with high dislocation density. The fact that those phases appeared not randomly scattered, but instead in well-defined trails is an indicative of the presence of a considerably greater amount of dislocations in such areas comparing to the neighboring regions, which reveals the heterogeneous strain distribution within the deposited material during the process. This feature was also concluded to be responsible for differences in the dynamic recrystallization process on friction-surfaced alloy 625 layers [109]. Moreover, TiB whiskers were more frequent in this case than within samples where particles did not reacted completely (Figure 5.27).
Figure 5.26 - Trail of precipitates delimited by red dashed lines (6000 min-1). EDS
Table 5.2 - Results from EDS measurements on spots (1) and (2), indicated on Figure 5.26.
1 2
Element Weight % Atomic % Weight % Atomic %
B 5.66 17.73 0.00 0.00
C 1.05 2.95 1.69 5.38
N 6.17 14.92 6.41 17.53
Al 5.22 6.55 6.16 8.74
Ti 79.25 56.07 81.72 65.32
V 2.66 1.77 4.01 3.02
Figure 5.27 - Precipitate-rich region, where TiB whiskers are indicated by black arrows. Rotational speed of 6000 min-1.
5.4.2.1.2. Silicon Carbide
![Figure 3.1 - Possible phase diagram configurations, depending upon the alloying element [17]](https://thumb-eu.123doks.com/thumbv2/123dok_br/15916085.674411/31.892.159.777.726.985/figure-possible-phase-diagram-configurations-depending-alloying-element.webp)
![Figure 3.2 - Lamellar structure on Ti-6Al-4V [17].](https://thumb-eu.123doks.com/thumbv2/123dok_br/15916085.674411/33.892.291.692.151.443/figure-lamellar-structure-on-ti-al-v.webp)

![Figure 3.8 - Relationship between hardness and temperature for group 4, 5 and 6 carbides [31]](https://thumb-eu.123doks.com/thumbv2/123dok_br/15916085.674411/38.892.263.573.155.550/figure-relationship-hardness-temperature-group-carbides.webp)
![Figure 3.10 – Friction Surfacing process applying several successive layers of aluminum [55]](https://thumb-eu.123doks.com/thumbv2/123dok_br/15916085.674411/43.892.214.745.147.443/figure-friction-surfacing-process-applying-successive-layers-aluminum.webp)
![Figure 3.12 – Visual representation of the material flow during the FS. Adapted from [66]](https://thumb-eu.123doks.com/thumbv2/123dok_br/15916085.674411/45.892.236.733.320.699/figure-visual-representation-material-flow-fs-adapted.webp)


