www.the-cryosphere.net/1/11/2007/ © Author(s) 2007. This work is licensed under a Creative Commons License.
The Cryosphere
Thresholds in the sliding resistance of simulated basal ice
L. F. Emerson and A. W. Rempel
1272 University of Oregon, Department of Geological Sciences, Eugene, OR 97403, USA Received: 18 June 2007 – Published in The Cryosphere Discuss.: 29 June 2007
Revised: 1 October 2007 – Accepted: 15 October 2007 – Published: 25 October 2007
Abstract. We report laboratory determinations of the shear resistance to sliding melting ice with entrained particles over a hard, impermeable surface. With higher particle concentra-tions and larger particle sizes, Coulomb friction at particle-bed contacts dominates and the shear stress increases linearly with normal load. We term this thesandyregime. When ei-ther particle concentration or particle size is reduced below a threshold, the dependence of shear resistance on normal load is no longer statistically significant. We term this regime slip-pery. We use force and mass balance considerations to ex-amine the flow of melt water beneath the simulated basal ice. At high particle concentrations, the transition from sandy to slippery behavior occurs when the particle size is compara-ble to the thickness of the melt film that separates the sliding ice from its bed. For larger particle sizes, a transition from
sandytoslipperybehavior occurs when the particle
concen-tration drops sufficiently that the normal load is no longer transferred completely to the particle-bed contacts. We esti-mate that the melt films separating the particles from the ice are approximately 0.1µm thick at this transition. Our labora-tory results suggest the potential for abrupt transitions in the shear resistance beneath hard-bedded glaciers with changes in either the thickness of melt layers or the particle loading.
1 Introduction
An understanding of the factors that control how ice deforms and slides is crucial for predicting how glaciers and ice sheets will respond to changing climate conditions. The inacces-sibility of glacier beds makes it particularly challenging to quantify the resistance to glacier sliding. We conducted lab-oratory experiments to examine the frictional resistance ex-erted between a hard, impermeable surface (glass) and melt-ing ice that contained known quantities and size distributions
Correspondence to:A. W. Rempel
of entrained sediment particles. As particle size or concen-tration increased we observed abrupt transitions between low resistance, fluid-dominated behavior and high shear-resistance, particle-dominated behavior. We show that geo-metric requirements for the flow of melt water from the slid-ing surface can explain these phenomena.
This study is motivated by an interest in the frictional re-sistance beneath hard-bedded glaciers. A brief review of the controlling mechanisms for sliding beneath debris-free glacier ice is in order. Of primary importance are the size and spacing of bedrock obstacles. Ice deformation accom-modates flow over large, widely spaced obstacles, whereas short-wavelength bed irregularities are traversed by the pro-cess of melting and refreezing known as regelation (Weert-man, 1957, 1964; Nye, 1969, 1970; Kamb, 1970; Lliboutry, 1968). This combination of processes implies that obsta-cles of intermediate size (e.g. typically of m-scale, Pater-son, 1994, p. 136) provide the most significant resistance to sliding. The assertion that it is the shape of the bed that con-trols sliding has served as the basis for theoretical treatments of glacial abrasion and erosion (Shoemaker, 1988; Hallet 1979a, 1981; Boulton, 1979). Laboratory demonstrations of the control exerted by bed irregularities on sliding resis-tance have helped to corroborate these theories (Chadbourne et al., 1975; Budd et al., 1979). More recent theoretical work suggests that cavitation on the lee side of bedrock obstacles may even lead to sliding instabilities by reducing glacier–bed coupling at high sliding rates (Schoof, 2005).
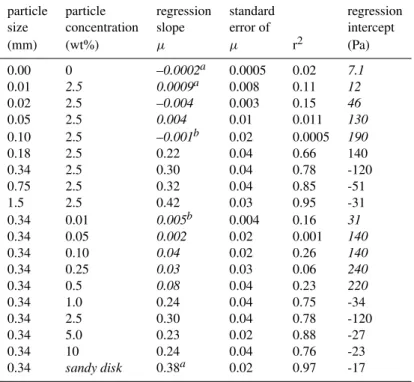
Table 1. Observed friction coefficients for each ice type (third column). Italicized friction coefficients indicate slopes that cannot be differentiated from zero at the 95% confidence interval. The regression intercept for these cases is close to the mean measured shear stress across the experiments. All regressions based on 15 datum points except where noted by superscript, a: 14 points; b: 12 points.
particle particle regression standard regression size concentration slope error of intercept
(mm) (wt%) µ µ r2 (Pa)
0.00 0 –0.0002a 0.0005 0.02 7.1
0.01 2.5 0.0009a 0.008 0.11 12
0.02 2.5 –0.004 0.003 0.15 46
0.05 2.5 0.004 0.01 0.011 130
0.10 2.5 –0.001b 0.02 0.0005 190
0.18 2.5 0.22 0.04 0.66 140
0.34 2.5 0.30 0.04 0.78 -120
0.75 2.5 0.32 0.04 0.85 -51
1.5 2.5 0.42 0.03 0.95 -31
0.34 0.01 0.005b 0.004 0.16 31
0.34 0.05 0.002 0.02 0.001 140
0.34 0.10 0.04 0.02 0.26 140
0.34 0.25 0.03 0.03 0.06 240
0.34 0.5 0.08 0.04 0.23 220
0.34 1.0 0.24 0.04 0.75 -34
0.34 2.5 0.30 0.04 0.78 -120
0.34 5.0 0.23 0.02 0.88 -27
0.34 10 0.24 0.04 0.76 -23
0.34 sandy disk 0.38a 0.02 0.97 -17
determines the effective normal stress borne by bed-particle contacts, in which case the frictional resistance should be proportional to the rate of melting and increase with the size of entrained particles. Using the subglacial access tunnel at Engabreen, Norway, Iverson et al. (2003) showed that the shear tractions imparted to the bed by sediment entrained in the overlying glacier ice can be much greater than ei-ther of these theories would predict. Cohen et al. (2005) developed a model that is consistent with the Engabreen observations, based on the hypothesis that ice deformation around entrained debris controls the effective normal stress at bed–particle contacts. Other laboratory studies have fo-cused on the ability of sediment-laden cold (<−10◦C) ice to
abrade (Mathews, 1979), and the influence of “plowing” by entrained particles on the resistance to glacier sliding over water-saturated sediments (Thomason and Iverson, 2004), but none have investigated how sediment entrained in the ice may control the resistance to sliding over hard-bedded glaciers at the pressure melting point.
These experiments explore how sliding behavior changes with variations in the size and concentration of entrained par-ticles. In the following section we describe our experimental set-up and procedure. Next, we present our results, which demonstrate abrupt changes in sliding resistance at thresh-olds of particle size and particle concentration. We interpret these results using simple models based on the conservation
laws and well-established concepts from lubrication theory (e.g., Batchelor, 1994, pp 219–222). We then discuss the rel-evance of our laboratory results to natural glacier sliding and offer a few concluding remarks.
2 Experimental method
carriage
force gauge sliding surface (glass not shown)
weights
force gauge ice holder ice A.
Travel 0.5 m
inner diameter 0.108 m
threaded rod motor
B.
Fig. 1. (A)Experimental apparatus. The motor turns a threaded rod which drives the carriage. The force-gauge height is adjusted to account for small differences in ice-disk thickness.(B)Ice disks are placed in the ice holder (240 g) and attached to the force gauge by a doubled threaded nut. Weights are used to adjust the normal force.
(0.0094 m2surface area). In addition to the simulated basal ice, we made 5 “sandy” control disks by gluing 0.34 mm par-ticles to foam-board.
We built an apparatus (see Fig. 1) to slide the ice over a pane of glass and measure the shear resistance. We con-ducted all experiments at room temperature (22±2◦C). Ice
was constantly melting and the melt-water flowed freely from beneath the ice disk. We weighed the ice when it was removed from the freezer and after the sliding experiments to determine the vertical melt rate (10µm/s (mean)±3µm/s (std. dev.)). Each disk slid in the apparatus three times: first with no additional imposed mass, second with 2.25 kg on top of the ice holder, and third with 4.5 kg. The ice holder it-self has a mass of 0.24 kg. A total displacement of∼0.3 m was traversed at a constant velocity of 8.7 mm/s. For each run, force-gauge data were collected for 40 s with a sampling frequency of 50 Hz. Each 40 s record included a short pe-riod with the ice at rest followed by approximately 35 s of sliding. The results reported here are based on 15 s sam-pling windows from 17–32 s of the recorded data, examples of which are shown in Fig. 2. The experimental procedure was repeated five times, each time with a new ice disk. This allowed for 15 shear force averages per ice type and control. To confirm that displacement history was not a controlling factor in our results the loading order was reversed for two sets of experiments and no behavioral change was observed. The large number of averaged independent data points en-sured that the standard errors in the meaen-sured shear forces were small. We note, however, that stick-slip cycles of in-creasing and dein-creasing shear stress values were observed on sub-second time scales (Fig. 2).
3 Results
For each ice type and control we plotted the shear (τ) vs. the normal (N) stress and performed linear regressions, as shown in Fig. 3. We used the slope and its standard error to calculate
0 10 20 30 40
Time (s)
04 8 12 16 20
Shear Force (N)
Sampling Window
no addtional imposed mass 4.5 kg imposed
mass 2.25 kg imposed
mass Legend
Fig. 2. Sample shear force data (5 point running average) for one of the ice disks with particle concentration 2.5 wt% and particle di-ameter 0.75 mm. The different lines correspond to measurements made with the labeled normal loads. The grey box shows the du-ration over which the data was averaged to calculateµ: 750 datum points.
0 1 2 3 4 5 6
Normal Stress (kPa)
01 2 3
Sh
e
a
r St
re
s
s
(
k
P
a
)
2.5 wt % 0.75 mm
'sandy'
2.5 wt % 0.02 mm
'slippery'
Slope of line is friction coefficient
Fig. 3.Measured shear stress as a function of normal stress for two “ice types”. One showssandybehavior (red),µ= 0.32, and the other slippery(blue),µ=−0.004. Error bars are one standard deviation of the shear stress above and below the mean.
the significance of each regression. Our data fall into two distinct regimes (see Fig. 3 and Table 1) that we term:sandy
andslippery.
0.01 0.1 1 10 a.
µ
Median Particle Diameter, d (mm) 2.5 wt % 0
0.1 0.2 0.3 0.4 0.5
b.
µ
d = 0.34 mm
0.0001 0.001 0.01 0.1 0
0.1 0.2 0.3 0.4
ψ
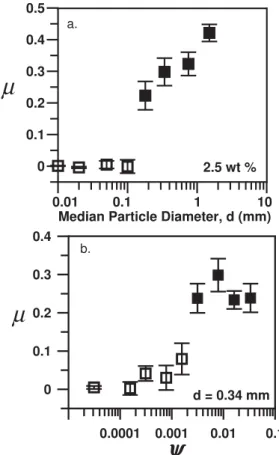
Fig. 4.Friction coefficient as a function of(a)particle diameter, and (b)particle concentrationψ. Solid boxes indicateµderived from regressions that are significant (non-zero) at the 95% confidence level, hollow boxes indicate values derived from regressions that fall below this significance threshold. Error bars are the standard error of the slope.
no significant difference in slope when regressions are forced through the origin.
The slopes of the data regressions in the slippery regime were not significantly different from zero, indicating that shear stress is independent of normal stress in these cases. This makes the calculation of a friction coefficient dubious. We do, however, for the sake of comparison display the val-ues obtained in Fig. 4. All ice types with median particle diameters≤0.1 mm and/or concentrations≤0.5 wt%, as well as the debris-free ice control, were in the slippery regime (Fig. 4, Table 1). In the slippery regime, the regression in-tercept is close to the mean measured shear stress and can be identified with cohesive behavior. At constant particle con-centration there is a clear increase in intercept with particle size. At constant particle size, the trend appears to be for higher intercept values with increased particle concentration. As shown in Fig. 4, abrupt transitions between the slip-pery and sandy regime occur when either the particle size or the particle concentration crosses a threshold. While these
thresholds are easy to identify and statistically significant, there is also some scatter in our experimental data (e.g., see Fig. 3). We attempted to keep experimental conditions as controlled and uniform as possible. However, inhomoge-neous mixing and particle settling prior to freezing of the ice disks were probably responsible for some of this scat-ter. Since the ice was melting over the course of the exper-iments, slight differences to the sliding surface undoubtedly took place as well. Some particles that began the experiments completely encapsulated by ice were introduced to the slid-ing surface later as the ice melted from beneath them. Some particles that began on the sliding surface were dislodged and left behind. Based on the short duration of each sliding ex-periment and the measured melting rates, we infer that these changes could only have affected a small fraction of the total number of particles on the sliding surface. They may, never-theless, have been responsible for some of the experimental scatter.
4 Interpretation
The resistance to basal sliding is determined by the nature of the ice-bed contact. In our experiments, the melting ice provides a continuous supply of water to the sliding surface. The low-viscosity melt film produces very little shear resis-tance, as confirmed by the low shear forces recorded for the clean ice controls (see Table 1). Hence, the low effective friction coefficients (<0.1) observed in the slippery regime suggest that water at the ice base controls the sliding behav-ior and particle-bed contacts bear only a small fraction of the normal load. By contrast, when sediment particles en-trained in the ice effectively couple to the bed, the shear re-sistance increases in proportion to the normal stress and the sandy regime is attained. Significant (non-zero) friction co-efficients (>0.2) observed in the sandy regime suggest that particle–bed contacts bear most of the normal load.
Melting Ice
Water
Bed
d/2
h
Particle
hp
Flow
Flow
Fig. 5. Schematic diagram of the sliding system in the vicinity of particle–bed contacts. We use force and mass balance considera-tions to estimate fluid thickness directly above a particle,hp, and far from particles,h, as described in the text.
that is required to support the normal stressN and maintain a steady-state configuration is
h= 3ηQD
2
8N
!1/3
, (1)
whereη=0.0018 Pa s is the liquid viscosity. This yields a value of approximately 40 microns for our typical exper-imental conditions (e.g.Q=10µm/s, D=0.1 m, N=1 kPa). This is comparable to, but somewhat smaller than the thresh-old particle size determined from our experiments. We at-tribute the difference to the formation of melt channels on the ice base that help to flush smaller particles from the sys-tem, as observed in video footage filmed through the glass sliding surface from below.
4.2 Threshold behavior with increased particle concentra-tion
Even when the particle size is large in comparison to the thickness of the melt film that separates the ice from the slid-ing surface, our experiments indicate that a significant fric-tion coefficient is only attained once the particle concentra-tionψexceeds a critical level (Fig. 4,b). At very low parti-cle concentrations, the low shear resistance we measure in-dicates that only a small fraction of the normal load is trans-ferred to the particle-bed contacts. The magnitude of stress-transfer to the particles is determined by the distribution of elevated fluid pressures in the very thin melt films, of thick-nesshp, that separate particles from the overlying ice. As shown in Fig. 5,hpis generally expected to be different from the film thicknesshthat separates the ice and sliding surface away from the particles. At low particle concentrations, we
ψ
ψ
'slippery''sandy'
0.0001 0.001 0.01 0.1
0.1 1
h
p(
mi
c
ro
n
)
h
pα
ψ
0.17h
pα
ψ
0.33d=0.34 mm
Fig. 6. The average calculated thicknesshpas a function of parti-cle concentration for each of the ice types withd=0.34 mm. Filled squares are thesandyregime ice-types with particle concentration ≥0.1 wt% (ψ=0.0031). Open squares areslipperyregime ice-types with concentration≤0.05 wt% (ψ= 0.0015). Solid lines are best-fit power-laws, with the labeled exponents. The students t-test indi-cates that the exponents are different at a>99% confidence level.
deduce that the melt films above the particles do not become thin enough for the fluid pressures to reach the high values needed to transfer the entire normal load to the particle-bed contacts.
For further insight, we consider the balance of forces on a sediment particle of diameterd that is in frictional contact with the sliding surface, as shown schematically in Fig. 5. The normal load transferred to the particle is inferred from the measured shear resistanceτ, volumetric particle concen-trationψ,and an estimate of the effective particle–glass fric-tion coefficient,µp=0.38, taken from the experiments with the sandy control disks. To a very good approximation, this normal load is balanced by the fluid pressure distribution in a thin premelted film that separates the particle from the over-lying ice. As discussed further in the appendix, the thickness of this filmhpis estimated as
hp=
µpψ ηQd τ
2!1/3
. (2)
pressure away from the particle-glass contacts must support part of the normal load, e.g.τ/µp<N. Striations produced in the glass by the harder particles suggest that the effective friction coefficient at smaller particle concentrations may ac-tually have been somewhat higher because of the additional shear resistance required to produce these indentations. If a higher value ofµpwere used at lowψ, the exponent in the power-law fit would be reduced further below its calculated low-concentration value of 0.17. This supports the hypothe-sis thathptends to a lower bound as the particle concentra-tion is reduced. The minimumhp inferred from our experi-ments is approximately 0.1µm, though a weak dependence onψdoes appear to persist to the lowest concentrations that we could reliably attain with our experimental set-up.
5 Discussion and conclusions
The abrupt thresholds that we observe in the frictional be-havior of simulated basal ice occur within the range of par-ticle sizes and concentrations that are found in glaciers (e.g., Kamb and LaChapelle, 1964). However, our experiments were performed at rates of melting and sliding that are much more rapid than those that commonly occur in nature. Both ice deformation and pressure regelation – the two mecha-nisms that enable glacier flow over rough beds – are too slow to be effective with our laboratory set-up. Nevertheless, the melt-dominated regime that we consider here improves our understanding of potential mechanisms for thresholds in fric-tional behavior within natural glacier systems.
The thicknesses of the melt films that separate glacier ice from the underlying bedrock are expected to be highly vari-able, both spatially and temporally (e.g., Hallet, 1979b). For example, with D reinterpreted as the typical distance be-tween subglacial channels or bedrock fractures that enable efficient melt-water drainage, Eq. (1) gives estimates forh ranging from 1–30µm forDbetween 10 cm and 10 m with Q=100 mm/a andN=10 kPa. This is sufficiently small that most entrained debris should easily span such ice-bed gaps. Areas of much greater ice-bed separation are likely to be en-countered on the lee-side of bedrock obstacles, and in these regions only the larger particles are expected to make fric-tional contact.
The observed dependence of frictional resistance on par-ticle concentration is more difficult to interpret. We infer that the thicknesses of the premelted films that separated the ice from the particles in our experiments were not able to thin sufficiently for the fluid pressure to transmit the en-tire load oncehp reached about 0.1µm. Equation (2) pre-dicts that films of such thickness are reached above cm-scale particles onceψ reaches about 2% whenQ=100 mm/a and τ/µp=10 kPa. The effective friction-coefficients that oper-ate beneath glaciers (e.g., Iverson et al., 2003) are typically much lower than rock-on-rock friction coefficients (e.g., By-erlee, 1978), so it is clear that the magnitude of stress-transfer
to entrained particles is not normally able to support the en-tire normal load. We have no theoretical justification for why hp=0.1µm should be a limiting film size – only the observa-tion that it seems to act as such in our experiments. At the low melt rates encountered beneath glaciers, regelation and ice deformation may well control the magnitude of stress transfer to entrained particles (e.g., Hallet, 1981; Cohen et al., 2005). In either case, the stress transfer requires elevated fluid pressures in the melt above the particles, with the im-plied presence of flow restrictions such as those that would be provided by film thicknesses that are much smaller above the particles than away from the particle-bed contacts. For comparison, the prediction of Boulton (1974) that debris-bed friction should be proportional toψis consistent with the ex-pectation that the film thicknesses above and away from par-ticles are essentially the same. Persistent variations in film thickness could be explained by the existence of persistent temperature gradients or by persistent compositional gradi-ents in the melt films (Shreve, 1984) – neither of which are easy to justify. Nevertheless, the repeatability of our exper-iments and the enhanced role of particle-bed frictional cou-pling observed in the field (e.g., Iverson et al., 2003) do raise the intriguing possibility of threshold sliding behavior in na-ture with changes in particle concentration.
Variations in the hydraulic regime under glaciers are likely to modify the distance between the ice and its bed. When the separation increases, for example, bedrock irregularities are “drowned” and a smaller percentage of the heterogeneously sized sediment carried by a glacier is capable of coupling the ice to the bed. This can lead to reduced frictional resistance through both the particle-size and particle-concentration de-pendent mechanisms observed here. Reduced frictional re-sistance may contribute to faster sliding rates that further en-large subglacial cavities and reduce particle–bed coupling. Conversely, decreases in water pressure that produce reduc-tions in melt-film thickness can enhance the frictional cou-pling and possibly lead to reductions in sliding rate. Addi-tionally, sediment concentration may vary through time as ice deforms around sediment and bedrock obstacles. When sediment loading is close to threshold values, the frictional behavior we observe suggests the potential for rapid velocity fluctuations.
Appendix A
Slippery regime film thickness
For small particles, the low shear resistance we measure is interpreted to imply that the normal load is almost entirely supported by the melt film beneath the ice and the sediment particles do not play a significant role. In our experiments, the particles only occupy a small fraction of the ice surface. We estimate the thickness of the melt film beneath the ice by considering the case of an idealized, smooth, particle-free, ice disk. Since the film is thin, we use the lubrication approx-imation to the Navier–Stokes equations, which stipulates that all flow is parallel to the ice and glass surfaces, the pressure gradients that drive flow are also radial, and inertial effects are negligible so that the equation governing fluid flow is ηd
2u
dz2 = dP
dr, (A1)
whereu is the fluid velocity, η is the viscosity, P is fluid pressure, andzandr are the vertical and radial coordinates (with the origin located immediately beneath the center of the ice disk on the glass surface). We integrate this equation twice with respect tozto get the fluid velocity profile u= − 1
2η dP
drz(h−z), (A2)
where we have substituted in for the integration constants by making use of the no-slip boundary conditions on the glass surface atz=0 and on the ice surface, wherez=h.If we con-sider a ring of radiusrthat is centered at the origin, then the total flux of fluidq that passes by is equal to the circumfer-ence of the ring times the integral of the fluid velocity over the thickness of the film
q=2π r h
Z
0
udz=−π r
6ηh 3dP
dr. (A3)
We consider a steady state in which the film thickness is con-stant so that this flux is supplied by melting. If the melt rate Qis constant over the surface of the ice then we expect that q=−π r2Q. Solving for the pressure gradient, we have that
dP dr =
6ηQ
h3 r. (A4)
The fluid pressure at the edge of the disk wherer=D/2, is atmospheric so the fluid pressure beneath the slider can be written as
P = −
r
Z
D/2 6ηQ
h3 rdr= 3ηQ
h3 D2
4 −r 2
!
. (A5)
The force imparted on the ice disk by this fluid pressure dis-tribution is equal to the normal force so
N πD 2
4 =2π D/2
Z
0
rPdr, (A6)
which implies a film thickness of
h= 3ηQD
2
8N
!1/3
. (A7)
Appendix B
Premelted film thickness over particles
A thin premelted film is assumed to separate each particle from the overlying ice. We can evaluate the thickness of the film by considering the force balance on the particle. The ex-periments give us the measured shear stressτ as a function of the normal loadN. Since the viscous resistance to shear-ing the melt film away from the particles is small (as gauged by the experiments with the clean ice control), we assume that the measured shear stress can be attributed to the fric-tional resistance at the particle–bed contacts. The effective normal load borne by particles of diameterdand volumetric concentrationψis
Fe = π d2τ 4µpψ
, (B1)
whereµpis the effective friction coefficient of the particle– bed contact. When the particles bear the entire normal load we expect thatFe=π d2N/ (4ψ ), butFe can be lower than this when the fluid pressure in the melt film distant from the particles bears a significant fraction of the load.
There are two sources of downwards forces on the particle. The first of these is probably more important in our experi-mental configuration. This is the force that is produced by the distribution of fluid pressures around the particle. The melt generated above the particle must flow around it, and the fluid pressure gradient in the film above the particle that is associated with this flow produces a net force on the parti-cle surface that can be written as (Rempel and Worster, 1999, Eq. 9)
Fµ= 3 4π d
4ηQ θc
Z
0
sinθcosθ
θ Z θc sinφ l3 dφ
dθ, (B2)
whereθc is a cut-off angle which is set to a value where the film thicknessl(θ )is much bigger than at the apex (the precise value of this angle is not important to the calculations since the dominant contributions to the integrals come from angles near zero).
here this premelting behavior suggests that the temperature above the particles is slightly lower than in regions where the film thickness ish. We assume that the temperature gradient Gis linear and the film thickness follows a power-law depen-dence on temperature (e.g., Wettlaufer and Worster, 1995; Dash et al., 2006) so that
λ3
l3 = λ3
h3 + G Tm
d
2 −h+
d
2 +h
cosθ
, (B3)
whereλis a length scale that characterizes the strength of the intermolecular interactions that cause premelting. We define the film thickness immediately above the particles ashpand consider the limit wherehp≪d/2 andhp≪hto find that
Fµ≈π d3ηQ
1−h
d
2(d+h)
4h3 p
. (B4)
As noted earlier, in many circumstances we expect thatFµ andFewill be much bigger than any other vertical forces in the problem. Equating the two, we anticipate that
hp≈
"
µpψ ηd2Q τ
1−h
d
2
1+h
d
#1/3
. (B5)
In cases whereh≪d, this simplifies further to
hp≈ µpψ ηQ d2
τ
!1/3
. (B6)
Further analysis shows that intermolecular forces produce a significant contribution to the vertical force balance that re-sults in an increase to the film thickness when the length scale
λ≫ 3d
2ηQ
4L
!1/3
, (B7)
whereL≈300 MJ/m3 is the latent heat of fusion per vol-ume. During a typical experiment with d=0.34 mm and Q=10µm/s, we are justified in neglecting the net force pro-duced by intermolecular interactions as long as λ<17 nm. Typical values are an order of magnitude or more smaller (e.g., λ=0.5 nm was reported by Wettlaufer and Worster, 1995) and we neglect these effects in our treatment.
Acknowledgements. We thank John Logan for his encouragement and support. We also thank Denis Cohen and Andrew Rathbun for helpful reviews. Funding was received from the University of Oregon and NSF OPP0440841.
Edited by: J. O. Hagen
References
Batchelor, G. K.:, An Introduction to Fluid dynamics, Cambridge University Press, Cambridge, 1994.
Boulton, G. S.: Processes and Patterns of Glacial Erosion, in: Glacial Geomorphology: London, edited by: Coates, D. R., George Allen and Unwin, p. 41–89, 1974.
Boulton, G. S.: Processes of glacier erosion on different substrata, J. Glaciol., 23(89), 15–38, 1979.
Budd, W. F., Keage, P. L., and Blundy, N. A.: Empirical Studies of Ice Sliding, J. Glaciol., 23(89), 157–170, 1979.
Byerlee, J.: Friction of Rocks, Pure. Appl. Geophys., 116, 615–626, 1978.
Chadbourne, B. D., Cole, R. M., Tootill, S., and Walford, M. E. R.: The movement of melting ice over rough surfaces, J. Glaciol., 14(71), 287–292, 1975.
Cohen, D., Iverson, N. R., Hooyer, T. S., Fischer, U. H., Jackson, M., and Moore, P. L.: Debris-bed friction of hard-bedded Glaciers, J. Geophys. Res., 110, F02007, doi:10.1029/2004JF000228, 2005.
Dash, J. G., Rempel, A. W., and Wettlaufer, J. S.: The physics of premelted ice and its geophysical consequences, Rev. Mod. Phys., 78(3), 695–741, 2006.
Hallet, B.: A theoretical model of glacial abrasion, J, Glaciol., 23(89), 39–50, 1979a.
Hallet, B.: Subglacial regelation and water film, J. Glaciol., 23(89), 321–334, 1979b.
Hallet, B.: Glacial abrasion and sliding: their dependence on the debris concentration in Basal ice, Ann. Glaciol., 2, 23–28, 1981. Iverson, N. R., Cohen, D., Hooyer, T. S., Fischer, U. H., Jackson, M., Moore, P. L., Lappegard, G., and Kohler, J.: Effects of Basal Debris on Glacier Flow, Science, 301, 81–84, 2003.
Kamb, B.: Sliding motion of glaciers: Theory and observation, Rev. Geophys. Space Ge., 8, 4, 673–728, 1970.
Kamb, B. and LaChapelle, E.: Direct observation of the mechanism of glacier sliding over bedrock, J. Glaciol., 5(38), 159–172, 1964. Lliboutry, L.: General theory of subglacial cavitation and sliding of
temperate glaciers, J. Glaciol., 7(49), 21–58, 1968.
Mathews, W. H.: Simulated Glacial Abrasion, J. Glaciol., 23(89), 51–55, 1979.
Nye, J. F.: A calculation on the sliding of ice over a wavy surface using a Newtonian viscous approximation, P. Roy. Soc. A-Math. Phys., 311, 1506, 445–467, 1969.
Nye, J. F.: Glacier sliding without cavitation in a linear viscous ap-proximation, Proc. P. Roy. Soc. A-Math. Phys., 315, 1522, 381– 403, 1970.
Paterson, W. S. B.: The Physics of Glaciers, Pergamon Press Ltd., London, 1994.
Rempel, A. W. and Worster, M. G.: The interaction between a par-ticle and an advancing solidification front, J. Cryst. Growth, 205, 427–440, 1999.
Schoof, C.: The effect of cavitation on glacier sliding, P. Roy. Soc. A-Math. Phys., 461, 609–627, 2005.
Shreve, R. L.: Glacier sliding at subfreezing temperatures, J. Glaciol., 30(106), 341–347, 1984.
Shoemaker, E. M.: On the formulation of basal debris drag for the case of sparse debris, J. Glaciol., 34(118), 259–264, 1988. Thomason, J. and Iverson, N.: Clast plowing as a potential flow
Weertman, J.: On the sliding of glaciers, J. Glaciol., 3, 33–38, 1957. Weertman, J.: The theory of glacier sliding, J. Glaciol., 5, 39, 287–
303, 1964.