* Corresponding author:
E-mail: [email protected]
Received: March 10, 2015
Approved: January 13, 2016
How to cite: Souza DM, Morais PAO, Matsushige I, Rosa LA. Development of Alternative Methods for Determining Soil Organic Matter. Rev Bras Cienc Solo. 2016;40:e0150150.
Copyright: This is an open-access article distributed under the terms of the Creative Commons Attribution License, which permits unrestricted use, distribution, and reproduction in any medium, provided that the original author and source are credited.
Development of Alternative
Methods for Determining Soil
Organic Matter
Diego Mendes de Souza(1)*
, Pedro Augusto de Oliveira Morais(2)
, Ivã Matsushige(1) and Luismar Alves Rosa(3)
(1)
Empresa Brasileira de Pesquisa Agropecuária, Embrapa Arroz e Feijão, Santo Antônio de Goiás, Goiás, Brasil. (2)
Universidade Federal de Goiás, Instituto de Química, Programa de Pós-graduação em Química, Goiânia, Goiás, Brasil.
(3)
Instituto Federal de Goiás, Graduação em Química Tecnológica, Goiânia, Goiás, Brasil.
ABSTRACT: Soil organic matter (SOM) is important to fertility, since it performs several functions such as cycling, water and nutrient retention and soil aggregation, in addition to being an energy requirement for biological activity. This study proposes new trends to the Embrapa, Walkley-Black, and Mebius methods that allowed the determination of SOM by spectrophotometry, increasing functionality. The mass of 500 mg was reduced to 200 mg, generating a mean of 60 % saving of reagents and a decrease of 91 % in the volume of residue generated for the three methods without compromising accuracy and precision. We were able to optimize conditions for the Mebius method and establish the digestion time of maximum recovery of SOM by factorial design and response surface. The methods were validated by the estimate of figures of merits. Between the methods investigated, the optimized Mebius method was best suited for determining SOM, showing near 100 % recovery.
Keywords: SOM, spectrophotometry, increase in functionality, response surface.
INTRODUCTION
Soil organic matter (SOM), which is usually estimated by total organic C content, can be understood as the collection of organic substances and complexes present in the soil (Silva and Mendonça, 2007). The stocking of these substances is dynamic, and it is decreased and replenished by mineralization and immobilization mainly observed by C and N contents (Lopes et al., 2004). Besides being essential in soil studies, the SOM parameter is the most important one in several soil properties: structure, coloring, water retention, and capacity of ion exchange. Thus, the SOM parameter becomes important in guiding soil fertilizing and irrigation, and therefore its determination is requested by fertility laboratories (Reeves, 1997; Lopes et al., 2004; Conceição et al., 2005; Roscoe, 2006; Silva and Mendonça, 2007; Madari et al., 2009).
Elemental analysis, which is a process based on combustion of the sample followed by chromatographic separation and detection of gases formed, despite being a clearer alternative and operational for the analysis of the organic C present in SOM (Ma, 2001; Harris, 2005), presents the inconvenience of adding to this inorganic C (carbonate), and is a technique that is not yet feasible for most Brazilian soil fertility laboratories. This is due to the initial and routine high cost investment of this technique. Hence, moist methods, which are simpler and accessible, are more frequently used. Even the Interlaboratory Program of Fertility Laboratories Quality Assessment (PAQLF, 2014), coordinated by the National Center of Soil Research (CNPS), currently called Embrapa Soils, adopts as standard the moist method of Embrapa (Silva, 2010).
In moist methods, SOM is oxidized by dichromate ions in an acid medium, as shown in equation 1. In molds originating from those methods, the determination is done by titrating Fe(II) solution standardized to consume the excess dichromate, as shown in equation 2, which once subtracted from the total added, determines the amount used in carbon oxidation:
2Cr2O72−(aq) + 3C 0
(s) + 16H +
(aq)→ 4Cr 3+
(aq) + 3CO2 (g)+ 8H2O Eq. 1 Cr2O72−(aq) + 6Fe2+(aq) + 14H+(aq)→ 2Cr3+(aq) + 6Fe3+(g)+ 7H2O Eq. 2 The two main moist methods for SOM analysis are Walkley and Black (1934) and Mebius (1960). The difference between them is that external heating is used in the Mebius method, i.e., the oxidation of SOM is considered complete; whereas in the Walkley-Black method the increase in temperature is given only by the release of energy in the dilution of H2SO4. That is, this method was proposed to measure SOM easily oxidizable or decomposable of soil. To compensate for this partiality, a correction factor (1.33) is applied, whereas this factor is not required for the Mebius method (Pansu and Gautheryou, 2003). In both methods, since organic C is determined, the conversion to SOM is made by van Bemmelen factor (1.724), based on the assumption that 58 % of organic matter is organic C (Raij et al., 2001).
Although it is a metal that occurs naturally in the environment in the trivalent state (Cr3+
), considered essential to living beings, when it takes the hexavalent form (Cr6+ ), it is considered toxic to humans, and may cause ulceration, irritation, and inflammation; it is also associated with the risk of cancer (Nriagu and Nieboer, 1988). Therefore, as with most chemical analysis, SOM analysis generates, at the end of the process, residues harmful to the environment, which require treatment for minimizing environmental impact (Silva et al., 2005). Although this mitigation is less harmful to the environment, it is preferable to develop alternative methods that avoid or minimize the generation of residues (Lenardão et al., 2003).
in Rice and Beans, currently called Embrapa Rice and Beans (CNPAF), for instance, a mean of 4,000 SOM determinations per year are held, resulting in over 1,000 L of sulfochromic residue; this great generation of residues is harmful to the environment. Moreover, considering the National Solid Residue Policy, instituted by Law No. 12305 (Brasil, 2010), which determines that residue management should contemplate measures for reduction of residue generation, its treatment, and its environmentally appropriate disposal. Hence, the development of alternative methods that eliminate or reduce the production of residues containing sulfuric acid and chromium is necessary, thus reducing environmental liabilities and the cost of their treatment and their disposal in landfills. This responsible practice for the generation and disposal of chemical residues is planned in Good Laboratory Practice and in ISO 24512:2007.
New propositions methods became feasible thanks to advances in instrumental techniques. They produce faster results and minimize the residues and effluents generated (Costa Filho and Poppi, 2002). In addition, these techniques are simple, and feature precision and accuracy equivalent or superior to classical methods, of the easy interpretation of results, low cost, and with broad applicability both in industry and in research (Galo and Colombo, 2009; Pereira et al., 2011; Gigante et al., 2014).
For instance, UV-VIS spectrophotometry (ultraviolet-visible) became the instrumental technique most used in analytical laboratories, thanks to its robustness and diverse applicability: characterization of chemical or biochemical reactions, determination of endpoints in titration, kinetic studies, research in new drugs and of optical properties of substances (Paim et al., 1998; Rocha and Teixeira, 2004; Gigante et al., 2014).
In theory, the determination of SOM for both moist methods mentioned could be carried out by VIS spectrophotometry, for their concentration is proportional to the Cr(III) formed that has greenish coloration. The manuals of fertility analysis of Embrapa (Silva, 2010) and the Agronomical Institute of Campinas - IAC (Raij et al., 2001) present this alternative determination using dilute sulfuric acid and soil samples with known contents by the titrametric method as standards for the calibration curve. This method results in lower quality calibration (r2
≤0.98) and other spectrophotometric methods (r2
≥0.99), which can lead to inconsistencies in studies in which the accurate SOM determination is important. This lower analytical quality can be explained by two main factors: (i) the deviation of the titrametric method is propagated with the spectrophotometric deviation (Harris, 2005); and (ii) due to the addition of a lower quantity of sulfuric acid, the titrimetric method results in less heat release and less recovery time or access to organic carbon (Chan et al., 2001).
In the Mebius method by spectrophotometry, on the other hand, pure organic substances are used as calibration standards. Reference methodology suggests the use of glucose (Pansu and Gautheryou, 2003), but other organic substances may be used, containing an appropriate amount of C, such as sucrose, EDTA, and biphthalate, which is the substance indicated for analysis of the chemical oxygen demand in water (APHA, 1995). The proportion of sulfuric acid used in the Mebius method is the same as in the Walkley-Black method. The possibility of reducing the amount of acid can be investigated, since there is compensation for external heating to the Mebius method, and this is also a parameter subject to optimization.
Chemists often use statistical tools for experimental design, such as factorial design and response surface analysis, for the optimization of experiments with several variables such as analytical procedures and industrial processes (Barros Neto et al., 2001; Bona et al., 2002; Aznar and Maduro, 2008). These tools enable relevant inferences from a reduced experiment and consider the effects of interactions between factors (Aznar and Maduro, 2008). This is important, as it was experimentally observed that level change to a factor can alter other responses with synergistic or antagonistic effect, which it was not possible to assess with univariate studies (Weinert et al., 2008; Breitkreitz et al., 2014). Therefore, factorial design has been used in a diversified way such as in the analysis of metals (Pereira Filho et al., 2002), plants (Marques et al., 2012; Souza and Sena, 2012), and soils (Dolatto et al., 2012). Although there are few results of response surface application, using this tool, it was possible to find the optimum conditions for: (i) extrusion of soybean bran (Barros et al., 1987), (ii) spectrophotometric determination in pharmaceutical formulations (Weinert et al., 2008), and (iii) fruit productivity and quality because of the use of fertilizers (Mattos et al., 2004).
This study investigated the hypothesis that acid volume and heating time are important parameters in the Mebius method. Thus, the objective of this study was to optimize SOM recovery by application of the factorial design and response surface methodology. Furthermore, this study proposed spectrophotometric methods with results statistically equivalent to Embrapa and Walkley-Black titrametric methods.
MATERIALS AND METHODS
Instrumentation
A digital automatic burette was used, with 0.01 mL resolution and precision less than 0.1 %, for titrametric Embrapa, Walkley-Black, and Mebius methods. To the new methodological propositions, the measurements were performed in the VIS spectrophotometer at 590 nm and 16 mm optical path, through cylindrical and individual buckets per sample for greater functionality and security of the analysts.
Samples
Representative samples of LAA routine were considered. Furthermore, samples provided by the PAQLF of CNPS covering different Brazilian regions were used. The selection of samples was carried out to obtain a wide physicochemical diversity, considering contrasting soil management, textural features, SOM contents, and origin. The pretreatment of samples consisted of air drying, followed by grinding and sifting in 2 mm mesh, thus obtaining thin air-dried soil samples.
Embrapa method (Silva, 2010)
Here, 0.5 g of soil samples were weighed in 250 mL Erlenmeyer flasks, with 10.0 mL of sulfochromic solution added (K2Cr2O7 dried at 105 °C at 0.0835 mol L
-1
and H2SO4 at 50 %, v:v), and then the Erlenmeyer mouth was covered with a watch glass. The samples were taken to the pre-heated electric plate and kept for 5 min after verifying soft boiling. After cooling the samples, 80 mL of deionized water, 2.0 mL of H3PO4 p.a. and four drops of the indicator solution of Ferroin 0.025 mol L-1
were added. The samples and blank tests were titrated with a solution of Fe(NH4)2(SO4)2.6H2O (or other salt containing Fe
2+ ) 0.5 mol L-1
in pH 0.3. The turning point of the titration is noticeable by the appearance of a reddish-brick coloring. The blank test is required to standardize the Fe2+
ion concentration in the titrant solution.
of the sulfochromic solution must be added, and the electric plate heating process is repeated before titration.
New spectrophotometric alternative to the Embrapa method (Spectrophotometric Embrapa)
Here, 0.5 g of soil sample was weighed in a 50 mL Erlenmeyer flask, with 4.0 mL of sulfochromic solution added (K2Cr2O7 dried at 105 °C at 0.0835 mol L
-1
and H2SO4 at 50 %, v:v) and then the Erlenmeyer mouth was covered with a watch glass. The samples were taken to the pre-heated electric plate and kept for 5 min after verifying soft boiling. After cooling the samples, 20 mL of deionized water was added. After one night of decantation, part of the supernatant was divided into aliquots, with a suggested volume between 4 and 6 mL for a cylindrical bucket with a diameter of 16 mm, which then underwent spectrophotometric reading in absorbance mode at 590 nm.
For standard solutions of the calibration curve, in a 50 mL Erlenmeyer flask, we added 4.0 mL of sulfochromic solution (K2Cr2O7 dried at 105 ºC at 0.0835 mol L-1 and H2SO4 at 50 %, v:v). Then, variable volumes of a standardized solution of Fe(NH4)2(SO4)2.6H2O 0.5 mol L
-1
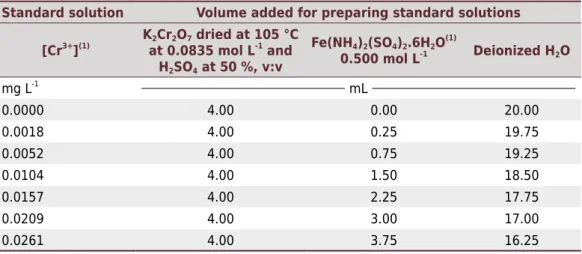
at pH 0.3 were added and a complementary volume of deionized water was added to a total volume of 24.0 mL. Standard solutions were not heated. The description of the volumes added and the expected concentration of the absorbing species Cr3+
are shown in table 1. Standard solutions were prepared on the same day that the reagents were added to samples for this method and to other spectrophotometric methods described in this study. If a bucket with an optical path other than 16 mm was used, the final volume of 24.0 mL was changed in such a way that the samples remained in the region of spectrophotometry linearity. For instance, for a 10 mm optical path, we suggest the adjustment of the final volume to 15.0 mL for the absorbances to be similar to those obtained in this study. Walkley-Black method (Walkley and Black, 1934; Pansu and Gautheryou, 2003; Silva, 2010)
Here, 0.5 g of soil sample was weighed in a 250 mL Erlenmeyer flask, with 10.0 mL 0.167 mol L-1
K2Cr2O7 added (dried at 105 °C) and then 20.0 mL of concentrated H2SO4 was added. The flasks were swirled for 1 min for homogenization, and the samples were kept static for 30 min. Then, 200 mL of deionized water, 10.0 mL of H3PO4 p.a. and four drops of the solution indicator of 0.025 mol L-1
Ferroin were added. The samples and blank tests with solution of Fe(NH4)2(SO4)2.6H2O (or other salt containing Fe
2+
) 0.5 mol L-1 at pH 0.3 were titrated.
Table 1. Preparation conditions of standard solutions used in the calibration curve of the spectrophotometric method alternative to the Embrapa method
Standard solution Volume added for preparing standard solutions
[Cr3+
](1) K2Cr2O7 dried at 105 °C
at 0.0835 mol L-1
and H2SO4 at 50 %, v:v
Fe(NH4)2(SO4)2.6H2O (1)
0.500 mol L-1 Deionized H2O
mg L-1
mL
0.0000 4.00 0.00 20.00
0.0018 4.00 0.25 19.75
0.0052 4.00 0.75 19.25
0.0104 4.00 1.50 18.50
0.0157 4.00 2.25 17.75
0.0209 4.00 3.00 17.00
0.0261 4.00 3.75 16.25
(1) [Cr3+
] indicated are for a hypothetical situation in which the result of the calculation of the standardization of Fe(NH4)2(SO4)2.6H2O solution is 0.50 mol L-1; for different values, [Cr3+
New spectrophotometric alternative to the Walkley-Black method (Spectrophotometric Walkley-Black)
Here, 0.2 g of soil sample was weighed in a 50 mL Erlenmeyer flask, with 4.0 mL of K2Cr2O7 0.167 mol L-1
added, and then 8.0 mL of H2SO4 p.a. was added, with the samples kept static for 30 min, and finally, 12.0 mL of deionized water was added. After one night of decantation, part of the supernatant was divided into aliquots, with a suggested volume between 4 and 6 mL for a cylindrical bucket with a diameter of 16 mm; spectrophotometric readings in absorbance mode at 590 nm were then performed.
For standard solutions of the calibration curve, in a 50 mL Erlenmeyer flask, we added 4.0 mL of K2Cr2O7 0.167 mol L
-1
and then 8.0 mL of H2SO4 p.a. After being kept static for 30 min, variable volumes added of a standardized solution of Fe(NH4)2(SO4)2.6H2O 0.5 mol L-1
at pH 0.3 were added and a complementary volume of deionized water was added to a total volume of 24.0 mL. The description of the added volumes and expected concentrations of the absorbing species Cr3+
are shown in table 2. Mebius method (Mebius, 1960; Pansu and Gautheryou, 2003)
Here, 0.5 g of soil sample was weighed in a 25 mL test tube, with 10.0 mL of K2Cr2O7 0.167 mol L-1
added (dried at 105 °C) and then 20.0 mL of concentrated H2SO4. The reflux during heating was obtained by sealing the tubes with screw cap with a Teflon inner part. The samples were taken to the preheated micro-Kjeldahl block digester and stabilized at 150 °C, in which they were kept for 30 min.
After cooling the samples, they were quantitatively put into 250 mL Erlenmeyer flasks, with 10.0 mL of H3PO4 p.a. to make the volume approximately 200 mL, and titrated for the tests as in the Walkley-Black method.
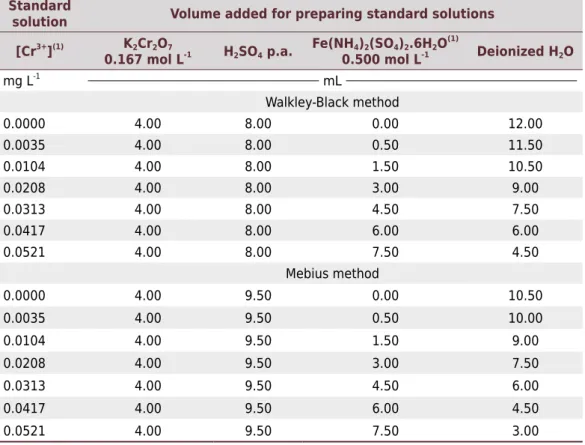
Table 2. Preparation conditions of standard solutions used in the calibration curve of the spectrophotometric method alternative to the Walkley-Black and Mebius method
Standard
solution Volume added for preparing standard solutions
[Cr3+](1) K2Cr2O7
0.167 mol L-1 H2SO4 p.a. Fe(NH4)2(SO4)2.6H2O (1)
0.500 mol L-1 Deionized H2O
mg L-1
mL
Walkley-Black method
0.0000 4.00 8.00 0.00 12.00
0.0035 4.00 8.00 0.50 11.50
0.0104 4.00 8.00 1.50 10.50
0.0208 4.00 8.00 3.00 9.00
0.0313 4.00 8.00 4.50 7.50
0.0417 4.00 8.00 6.00 6.00
0.0521 4.00 8.00 7.50 4.50
Mebius method
0.0000 4.00 9.50 0.00 10.50
0.0035 4.00 9.50 0.50 10.00
0.0104 4.00 9.50 1.50 9.00
0.0208 4.00 9.50 3.00 7.50
0.0313 4.00 9.50 4.50 6.00
0.0417 4.00 9.50 6.00 4.50
0.0521 4.00 9.50 7.50 3.00
(1) [Cr3+
] indicated are for a hypothetical situation in which the result of the calculation of the standardization of Fe(NH4)2(SO4)2.6H2O solution is 0.50 mol L-1; for different values, [Cr3+
New spectrophotometric alternative to the Mebius method (Spectrophotometric Mebius)
For this, 0.2 g of soil sample was weighed in a 25 mm test tube, with 4.0 mL of K2Cr2O7 0.167 mol L-1
(dried at 105 °C) added and then 9.5 mL of concentrated H2SO4. The tubes were sealed with a screw cap with the inner part made of Teflon. The samples were taken to the preheated micro-Kjeldahl block digester and stabilized at 140 °C, where they were kept for 5 h and 30 min. Finally, 10.5 mL of water were added. The state of rest and the transfer of the solution to the 16 mm bucket for spectrophotometric readings were performed identically to the Walkley-Black spectrophotometric method.
For standard solutions of calibration curve, in 25 mm test tube, 4.0 mL of K2Cr2O7 0.167 mol L -1
and 9.5 mL of H2SO4 p.a. were added. Then, variable volumes of a standardized solution of Fe(NH4)2(SO4)2.6H2O 0.5 mol L
-1
at pH 0.3 were added and a complementary volume of deionized water to a total added volume of 24.0 mL. Finally, the tubes were closed and homogenized. Standard solutions were not heated. The description of the added volumes and expected concentrations of the absorbing species Cr3+
are shown in table 2.
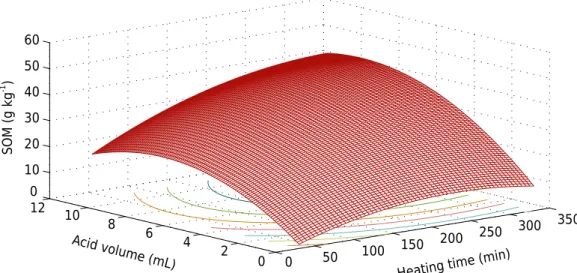
Multivariate optimization of digestion of spectrophotometric Mebius method
A 52
factorial design was adopted (Barros Neto et al., 2001), considering the volume of H2SO4 (VH2SO4) at levels of 2.0, 4.0, 6.0, 8.0, and 10.0 mL, and digestion time (T) at levels of 36, 108, 180, 252, and 324 min as factors. With the results of this design, a Response Surface (RS) was built to identify the maximum recovery region of SOM.
Validation of analytical Walkley-Black and Mebius spectrophotometric methods
For the two proposed methods, the following figures of merit: (i) linearity, and (ii) detection limit were evaluated:
100
LoD= 3.SDb.BEC Eq. 3
(iii) quantification limit,
100
LoQ=10.SDb.BEC Eq. 4
where SDb is the standard deviation of blank and BEC is the background equivalent concentration, obtained by dividing the absorbance means of the blanks by the angular coefficient of calibration; (iv) precision at repeatability level by replicates of the same sample, and at intermediate precision level by the results of the sample by different analysts in independent trials; and (v) accuracy.
Two certified reference materials of Elemental Microanalysis were used for accuracy estimation of the methods: Soil Standard Clay OAS or clay soil standard, code B2184, number 133317, NIST 143d; and Soil Standard Sandy OAS or sandy soil standard, code B2180, number 133506, NIST 143d. The known contents of organic C of these two samples were obtained by the mean of 15 determinations by the elemental analysis reference technique, carried out by the National Institute of Standards and Technology (NIST).
RESULTS AND DISCUSSION
Spectrophotometric alternatives for Embrapa and Walkley-Black methods
environmental accidents of disastrous proportions. Thus, industries and other generators, such as Embrapa, have been seeking clean alternatives that eliminate or minimize the generation of chemical residues. This trend of clean innovation was called Green Chemistry, and among its main principles, it presents: (i) the prevention of residues generation; (ii) the economy of atoms or development of synthetic processes; (iii) the design of safe products; and (iv) intrinsically safe chemistry for accident prevention (Ayres, 1949; Lenardão et al., 2003; Prado, 2003; Silva et al., 2005).
Before the excessive volume of residues generated by Embrapa and Walkley-Black methods, for alignment with green chemistry principles, pre-tests were conducted by reducing the soil mass from 0.5 to 0.2 g. Since K2Cr2O7 must be present in a stoichiometric relationship with analytes, and H2SO4 is responsible for the energy release per milliliter of solution and access to organic C (APHA, 1995), these reagents have been proportionally reduced with mass reduction. No significant differences were observed for means and variance, respectively by t and F tests at a 95 % confidence level. In addition, LAA uses
reduced mass to analyze samples of PAQLF by the Embrapa method since 2013, obtaining |Z-score| <2, indicating a satisfactory performance, for all variables analyzed. The results accumulated over two years indicate that reduced mass can be used in SOM analysis without compromising the accuracy and precision of the method. This initial adaptation enabled the study of spectrophotometric determination of SOM with reduced mass. The first significant difference between titrimetric and spectrophotometric methods for the analysis of SOM is the use of H3PO4 on the first method. This is necessary because the PO43− complexes with Fe3+
from the soil, removing their yellow coloring (Pansu and Gautheryou, 2003). This color removal facilitates the visualization of the turning point during titration with Fe2+ solution. On the other hand, for spectrophotometric analysis, the addition of this acid is not necessary, as the interfering Fe3+
does not have light absorption at 590 nm, a wavelength which is used in thespectrophotometric methods proposed here.
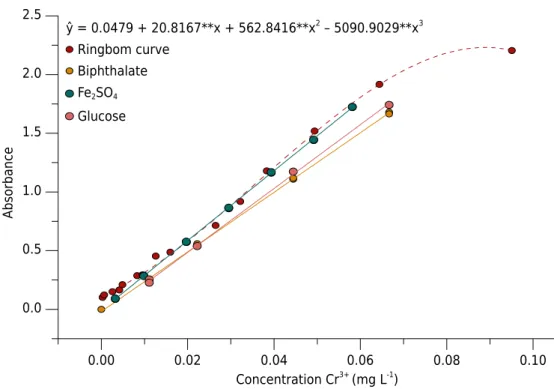
By Ringbom curve (Ayres, 1949), set for x [Cr3+] Absorbance, built with concentration samples of contrasting SOM, it was possible to identify the linear region of the method (Figure 1). Due to linearity deviations of Lambert-Beer Law at low and high concentrations (Harris, 2005), it was possible to set an equation of 3rd
order whose derivative is an equation of 2nd
order which has as the “x vertex” 0.089 mol L-1 of Cr3+
, the point of maximum sensitivity. Considering this optimum point, the linear region of reading, and the concentration range found in routine samples of LAA, we decided to increase the volume up to 24.0 mL of sample in order to optimize the use of the linear spectrophotometric range.
For the calibration of the spectrophotometer, the following: (i) soil samples with known contents by titrametric methods from Embrapa and Walkley-Black, (ii) pure organic substances, and (iii) solutions obtained by reaction between Cr2O72− and Fe2+ ions were evaluated.
The use of samples as calibration standards, suggested in the manuals of Embrapa (Silva, 2010) and IAC (Raij et al., 2001), resulted in low-quality analytical calibrations (r2
<0.98). The spread of deviations from the titrametric method to the spectrophotometric one and the heterogeneity of standard soil samples may be the main factors for the low performance of this type of calibration.
The second alternative investigated was the use of two pure substances (potassium and glucose biphthalate) for spectrophotometric calibration, which resulted in linear adjustments of satisfactory analytical quality (r2
Concentrated sulfuric acid, besides being necessary for oxidation by Cr2O72−, is the adverse factor responsible for this unwanted oxidation of part of SOM. Aromatic structures, such as the biphthalate anion, are oxidized to radicals in the presence of concentrated sulfuric acid (Bard et al., 1976). Alcohols, the organic function present in the glucose molecule, are oxidized to ethers under action of this acid and heating (Solomons and Fryhle, 2001). In addition, Nehlsen et al. (2006) found synergism between sulfuric acid and heating as oxidizing agents of aliphatic and aromatic sulfides, reducing the Gibbs free energy value for these reactions.
The use of standards prepared from the addition of increasing volumes of Fe2+
solution, standardized on fixed quantity of ions Cr2O72− were evaluated (Tables 1 and 2). This alternative resulted in linear adjustment of analytical quality (r2
>0.99), Figure 1, and with greater angular coefficient. This slope of the line resulted in SOM contents for the samples lesser than those obtained using calibration from pure organic substances. With this decrease, SOM contents and the variance obtained spectrophotometrically are statistically equivalent to the results obtained by the titrametric methods of Embrapa and Walkley-Black (Table 3), at 95 % confidence level for the t and F tests, respectively. For the statistical comparison of the methods the means for each sample and the mean standard deviation of each method were used (Table 3). This is because very low standard deviations were obtained for some samples regarding the mean standard deviation, which showed a statistical difference to the mean (t test), even when the SOM contents were very close. The only significant difference observed for the mean was from the first sample of Corumbá-MS between Embrapa and Spectrophotometric Embrapa methods, whose T calculated was of 4.8 against a critical T of 4.303. Possibly, this only difference occurred due to the difficulty in identifying the end point of heating of the method, which is subject to the observation of the beginning of soft boiling. In this study, the diversity regarding the origin and the physicochemical properties of samples resulted in the proposal of methodologies of broad applicability, with no restrictions found on soil type and origin so far.
Absorbanc
e
2.5
2.0
1.5
1.0
0.5
0.0
0.00 0.02 0.04 0.06 0.08 0.10
ŷ = 0.0479 + 20.8167**x + 562.8416**x2 – 5090.9029**x3 Ringbom curve
Biphthalate Fe2SO4
Glucose
Concentration Cr3+
(mg L-1
)
Souza et al.
Development of Alter
native Methods for Deter
mining Soil Or
ganic M
atter
10
R
ev Bras Cienc Solo 2016;40:e0150150
Origin
Clay Silt(1)
Sand E Espect. W-B W-Bspect. M. M.opt. M.
(W-B)-1 M.opt.
(W-B)-1 M.opt. (Espect.)-1
g kg-1
Italva - RJ 75 0 927 10.02±0.21 8.76±0.79 16.30±1.39 17.05±0.70 13.70±0.13 16.61±0.90 1.12 1.35 1.90
Sete Lagoas - MG 629 210 162 50.48±0.13 49.42±1.80 84.91±2.70 86.82±2.79 89.36±1.86 91.95±4.72 1.40 1.44 1.86
Corumbá - MS 321 270 409 33.84±1.17 37.45±0.45 50.01±2.65 48.19±1.17 49.95±1.49 52.59±2.57 1.33 1.40 1.40
Corumbá - MS 305 290 404 36.91±0.70 36.04±0.72 52.51±2.77 51.50±2.50 49.26±0.65 54.74±2.56 1.25 1.39 1.52
Corumbá - MS 323 266 412 34.72±0.92 36.33±0.82 45.46±2.10 46.18±1.87 50.64±0.11 56.13±2.34 1.48 1.64 1.55
Jaíba - MG 183 133 684 34.34±1.85 36.39±1.45 43.95±0.71 44.90±1.30 42.37±1.82 48.13±1.02 1.28 1.46 1.32
Santo Antônio de Goiás - GO 648 303 49 12.48±0.20 12.51±0.95 17.39±0.69 17.26±0.77 16.79±0.63 20.48±1.62 1.28 1.57 1.64
Santo Antônio de Goiás - GO 369 606 25 31.87±0.22 32.00±0.08 40.90±2.91 40.64±2.86 39.02±0.65 42.35±0.07 1.27 1.38 1.32
Santo Antônio de Goiás - GO 426 536 38 22.80±0.11 25.62±0.90 31.08±1.15 32.17±1.21 45.67±2.08 51.52±0.07 1.95 2.20 2.01
Mean standard deviation ±0.84 ±1.00 ±2.08 ±1.87 ±1.27 ±2.25
Mean 1.37 1.54 1.61
(1) Silt content was obtained by the difference between total and sum of clay and sand contents. E
Hence, the laboratory decided to adopt the spectrophotometric determination of SOM instead of the Walkley-Black reference method that was being used routinely, increasing the productivity from 200 to 500 samples/week/analyst. In addition, it enabled the economy of 60 % in the consumption of H2SO4 and K2Cr2O7, the elimination of using H3PO4, Fe(NH4)2(SO4)2.6H2O and indicator Ferroin solution, and the reduction of the mass from 0.5 to 0.2 g of sample, without changing the accuracy and precision of the analysis. By Walkley-Black method, for instance, approximately 260 mL is generated per sample, whereas only 24 mL is generated in the spectrophotometric method, reducing in 91 % of the total volume of residues generated. We should consider that in LAA the estimated cost of analysis per sample went from US$ 2.65 to US$ 0.95, still taking into consideration that US$ 0.70 is paid per kilo to a specialized company to perform the treatment and final disposal of residue, and therefore, the laboratory must save an average of US$ 9,350.00 per year.
Optimization of Mebius method and its adaptation to spectrophotometry
A soil in which biochar was incorporated at the proportion of 16 Mg ha-1
was used for the study on optimization of Mebius method conditions. Biochar is a material rich in C that features high stability and increases the soil fertility, also helping C sequestration from the atmosphere (Petter and Madari, 2012; Carvalho et al., 2013). This material is obtained by pyrolysis of biomass in the absence of oxygen. The high stability of biochar occurs by the presence of functionalized polycyclic aromatic groups that resist to SOM of the sample used (Madari et al., 2009; Zimmerman, 2010; Madari et al., 2012). This enables optimum conditions of oxidation for this soil to be applied to others, which in general will have a more labile SOM.
By factorial design 52
result (Table 4), the two factors (volume of H2SO4 and digestion time) and their quadratic contributions were considered significant, and the interaction between the two factors was insignificant, since the module was lower than the experimental deviation. From the significant factors, the response surface and adjusted equation (Figure 2) were obtained, and the VH2SO4 maximum point of 9.08 mL and T of 319.9 min were obtained by the partial derivative. This volume of optimized acid to 0.2 g of soil is slightly higher than the initial ratio of Mebius method, of 0, 5 g:20 mL. That is, you cannot reduce the sulfuric acid without reducing the efficiency of SOM recovery. However, the initial time of 30 min of the method is much lower than the optimized by RS, indicating that Mebius method in the original conditions does not assure the complete or maximum SOM oxidation of some samples.
For the results by spectrophotometry to be equivalent to those obtained by titrimetric methods, also standards prepared from the addition of Fe2+ solution standardized under fixed quantity of Cr2O72− ions were used, thus obtaining a linear adjustment of analytical quality (r2>0.99) (Figure 1). Although the effect of thermal decomposition of Cr2O72− ions is only significant above 150 °C (Pansu and Gautheryou, 2003), we did not use heating in standard solutions because the reaction between Cr2O72− and Fe
2+
is immediate and to level the conditions with the titrametric method, in which the ferrous sulfate solution is not heated.
Table 4. Soil organic matter (SOM) content in the sample of soil with biochar by Mebius method as a result of the factorial design
Time H2SO4 SOM 1 SOM 2 SOM mean Standard deviation
min mL g kg-1
36 2 13.30 13.90 13.60 0.30
108 2 21.10 17.70 19.40 1.70
180 2 19.80 25.40 22.60 2.80
252 2 28.10 22.20 25.20 3.00
324 2 22.70 26.80 24.70 2.10
36 4 17.60 24.10 20.90 3.20
108 4 27.50 18.30 22.90 4.60
180 4 24.20 30.40 27.30 3.10
252 4 29.40 25.40 27.40 2.00
324 4 25.90 30.10 28.00 2.10
36 6 22.20 20.50 21.40 0.90
108 6 32.70 30.00 31.40 1.40
180 6 37.30 34.00 35.70 1.70
252 6 40.40 42.90 41.70 1.30
324 6 42.80 39.00 40.90 1.90
36 8 18.20 23.60 20.90 2.70
108 8 35.20 35.60 35.40 0.20
180 8 42.20 41.60 41.90 0.30
252 8 40.00 44.00 42.00 2.00
324 8 40.10 46.80 43.40 3.40
36 10 22.00 20.90 21.50 0.60
108 10 32.00 25.70 28.90 3.20
180 10 32.00 38.60 35.30 3.30
252 10 40.00 40.90 40.50 0.40
324 10 36.00 42.00 39.00 3.00
0 50 100
150 200 250
300 350
0 2 4 6 8 10 12 0 10 20 30 40 50 60
Heating time (min ) Acid volume (mL)
SOM (g kg
-1 )
Validation and overview of the analytical methods proposed
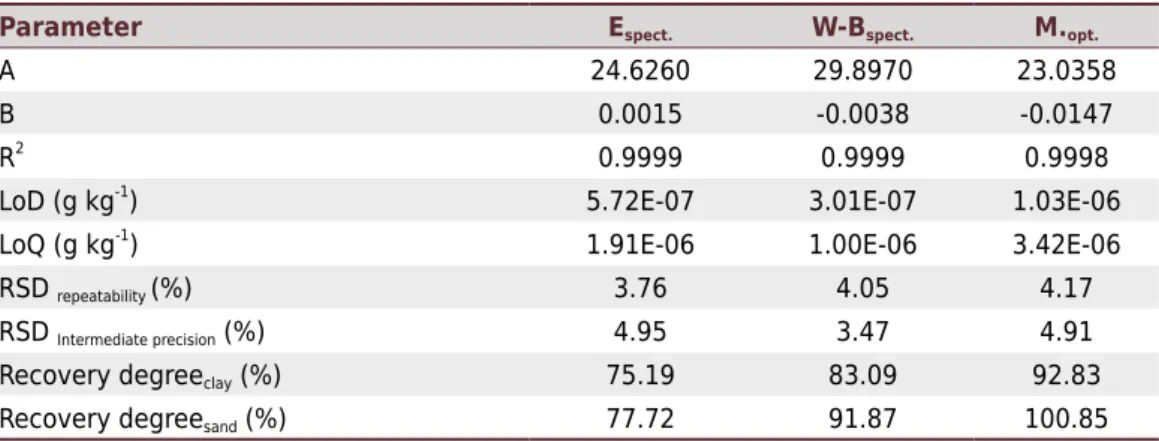
The estimated figures of merit for Embrapa and Walkley-Black spectrophotometric methods and optimized Mebius, evaluating detection (LoD) and quantification (LoQ) limits and precision are in table 5. By the ranges mentioned in the experimental part, the angular (A) and (B) linear coefficients were estimated. The calculation of the relative standard deviation (RSD) was used to estimate precision at repeatability and intermediate levels. The RSD values were below 5.0 %.
The NIST certified reference materials allowed to estimate the accuracy by the degree of recovery for the three spectrophotometric methods proposed. The method of Embrapa presented 75.19 and 77.72 %, the Walkley-Black method 83.09 and 91.87 %, and the method of Mebius 92.83 and 100.85 %, respectively, for loamy and Sandy reference materials (Table 5). The largest recalcitration of clay soil can be justified by the formation of micro-aggregates between clay and SOM (Rheinheimer et al., 2008); therefore, the methods presented lower recoveries for this material.
Although the Embrapa method presented satisfactory precision, its degrees of recovery were the lowest and furthest from 100 % for the three methods validated. This poor performance to accuracy is due to the non-use of an inefficiency factor, as even though this method uses external heating, the heating time is short, and therefore insufficient for the maximum recovery of SOM. Embrapa method cites other manuals and books of soil analysis, but when investigating these sources, it is possible to identify that Embrapa method had contributions from the Schollenberger methods (Schollenberger 1927, 1945), which uses external heating, and the Walkley-Black method (Walkley and Black, 1934), which does not use external heating. The satisfactory reproducibility of the Embrapa method and its use at a national level enhanced by PAQLF inter-laboratory program, which features more than 100 fertility laboratories, demonstrates that this method should be considered a way to determine the SOM content of Brazilian soils. However, the lack of a factor to correct its inefficiency will often produce underestimated SOM contents. Therefore, based on the results obtained here, we suggest that SOM content according to the Embrapa method should be corrected by a factor of 1.61 (Table 3).
The Walkley-Black method showed better accuracy, 83.09 and 91.87 % (Table 5), than the Embrapa method. However, there was no overestimation for the two certified NIST standards when the correction factor of inefficiency of 1.33 was applied, raising recovery degrees to 110.52 and 122.19 %. Nevertheless, these results are closer to 100 % when compared to the Embrapa method. Overestimation may occur by great variation of the “inefficiency factor” (Table 4), which featured relative standard deviations of 17.35 and 17.32 % when compared to conventional and optimized Mebius methods, respectively.
Table 5. Figures of merit estimated for both methods proposed
Parameter Espect. W-Bspect. M.opt.
A 24.6260 29.8970 23.0358
B 0.0015 -0.0038 -0.0147
R2
0.9999 0.9999 0.9998
LoD (g kg-1) 5.72E-07 3.01E-07 1.03E-06
LoQ (g kg-1
) 1.91E-06 1.00E-06 3.42E-06
RSD repeatability (%) 3.76 4.05 4.17
RSD Intermediate precision (%) 4.95 3.47 4.91
Recovery degreeclay (%) 75.19 83.09 92.83
Recovery degreesand (%) 77.72 91.87 100.85
However, considering that the inefficiency factor is fixed and mean between a diverse set of samples, this factor, in a large amount of samples, will produce high errors in both directions, i.e., it will underestimate or overestimate the SOM content. The Walkley-Black method, as well as the Embrapa method, is fairly applied in Brazilian fertility laboratories, and is the suggested method, with some adaptations, in the IAC manual (Raij et al., 2001). However, its inefficiency in SOM recovery was intensified when its results were compared to the optimized Mebius method. Therefore, based on the set of samples, we suggested that the SOM content determined by the Walkley-Black method should be corrected by a factor of 1.54 (Table 4). Inefficiency factors can be more effective in SOM estimation when calculated for a restricted set of samples or to a specific region which features soils with approximate physicochemical characteristics.
Despite not using external heating, Walkley-Black method, even without using the 1.33 factor, showed higher degree of recovery regarding Embrapa method. This is due to the proportion of sulfuric acid being higher in the Walkley-Black method for the same mass of the sample, and this factor was predominant, in the case of the two reference materials, for greater access to SOM organic carbon (Chan et al., 2001). However, the slight external heating used in the Embrapa method can, in some cases, be the predominant factor of access to the C. For instance, the sample of Jaíba-MG (Table 4), featured an SOM content of 36.39 g kg-1
for the Embrapa method against 33.05 g kg-1
(without the 1.33 factor) for the Walkley-Black method. Thus, although both factors, external heating and sulfuric acid, contribute to increase the recovery degree, the predominance in relation to the other will depend on each sample, or, more specifically, on the features of the collection of organic substances present in each soil.
Finally, the optimized Mebius method presented the best recoveries of the three validated methods: 92.83 and 100.85 % (Table 5). We did not use a correction factor of inefficiency for this method because its recoveries are close to 100 %, which prevents serious distortions of SOM estimate, as previously discussed. Therefore, despite the minor operation, the Mebius method, using oxidation in closed system, proved to be the most effective for SOM determination, in agreement with the results obtained by Angelova et al. (2014), which indicate the tube digestion at 150 °C as the more appropriate for SOM recovery. For certified sandy material, the SOM recovery was complete, indicating that organic substances of this type of soil are more accessible. On the other hand, for the certified clay material, the recovery was satisfactory, greater than 92 %, but this result indicates that a small fraction of the organic C was not oxidized. This oxidation resistance happened even after optimizing the heating time, which was quite high compared to the original method and the amount of sulfuric acid. That is, some soils contain highly resistant micro-aggregates (Rheinheimer et al., 2008), making it impossible for the oxidation of this SOM fraction by dichromate and sulfuric acid action. Thus, for the moist methods here investigated, we should not use the term total organic C, but oxidizable organic C. Therefore, in the optimization of the Mebius method, the vertex of the response surface indicates the SOM maximum recovery, and not complete recovery.
CONCLUSIONS
The replacement of the Walkley-Black method by the new spectrophotometric Walkley-Black method proposed here enabled a mean annual economy of US$ 9,350.00 in LAA spent on reagents and the treatment of toxic residues.
The Embrapa and Walkley-Black methods demonstrated satisfactory precision, but the results point to the need of using correction factors of inefficiency of 1.61 and 1.54, respectively. These factors, which are mean, can cause errors in most samples. Despite the minor functionality, the optimized Mebius method does not demand the use of a correction factor and is the most effective for SOM recovery, showing degrees of recovery close to 100 %.
Finally, the results of this study are of great relevance to Embrapa, which coordinates the PAQLF interlaboratory program by Embrapa Soils and develops projects for the production of certified samples. We intend to disclose them at a corporate level in the National Meeting on Lab Methodologies and Management (MET).
REFERENCES
American Public Health Association - APHA. Standard Methods for the Examination of Water and Waster. 19th
. ed. Washington, DC: 1995.
Angelova VR, Akova VI, Ivanov KI, Licheva PA. Comparative study of titimetric methods for determination of organic carbon in soils, compost and sludge. J Int Sci Public: Ecol Safety. 2014;8:430-40.
Ayres GG. Evaluation of accuracy in photometric analysis. Anal Chem. 1949;21:652-7. doi:10.1021/ac60030a002
Aznar M, Maduro RM. Optimization of the liquid-liquid extraction of nicotine in ternary solvent. Cienc Eng. 2008;17:51-5.
Bard AJ, Ledwith A, Shine HJ. Formation, properties, and reactions of cation radicals in solution. In: Gold V, Bethell D, editors. Advances in physical organic chemistry. New York: Academic; 1976. p.155-278.
Barros Neto B, Scarminio IS, Bruns RE. Como fazer experimentos, pesquisa e desenvolvimento na ciência e na indústria. 2ª. ed. Campinas: Unicamp; 2001.
Barros RMC, Silva RSF, Borsato D, Arêas JAC. Otimização das condições de extrusão de Farelo de soja pelo emprego da metodologia de superfície de resposta. Bol CEPPA. 1987;5:61-70.
Bona E, Borsato D, Sérgio R. Planejamento e otimização de sistemas mistos controlados por variáveis qualitativas e quantitativas. Acta Sci. 2002;24:1843-50. doi:10.4025/actascitechnol.v24i0.2561
Brasil. Lei nº 12.305 - Institui a Política Nacional de Resíduos Sólidos e dá outras providências.
Diário Oficial [da] União. Brasília, DF, de 2 de ago. de 2010.
Breitkreitz MC, Souza AM, Poppi RJ. Experimento didático de quimiometria para planejamento de experimentos: avaliação das condições experimentais na determinação espectrofotométrica de ferro II com o-fenantrolina. Um tutorial, parte III. Quim Nova. 2014;37:564-73.
doi:10.5935/0100-4042.20140070
Carvalho MTM, Madari BE, Bastiaans L, Oort PAJV, Heinemann AB, Silva MAS, Maia AHN, Meinke
H. Biochar improves soil fertility of a clay soil in the Brazilian Savannah: short term effects and
impact on rice yield. J Agric Rural Develop Trop Subtrop. 2013;114:101-7.
Chan KY, Bowman A, Oates A. Oxidizible organic carbon fractions and soil quality
changes in a Paleustalf under different pasture leys. Soil Sci. 2001;166:61-7.
doi:10.1097/00010694-200101000-00009
Costa Filho PA, Poppi RJ. Aplicação de algoritmos genéticos na seleção de variáveis em espectroscopia no infravermelho médio. Determinação simultânea de glicose, maltose e frutose. Quim Nova. 2002;25:46-52. doi:10.1590/S0100-40422002000100009
Dolatto RG, Messerschmidt I, Ferreira BF, Silveira CAP, Abate G. Determination of phenol and
o-cresol in soil extracts by flow injection analysis with spectrophotometric detection. J Braz
Chem Soc. 2012;23:970-6. doi:10.1590/S0103-50532012000500001
Galo AL, Colombo MF. Espectrofotometria de longo caminho óptico em espectrofotômetro de duplo-feixe convencional: uma alternativa simples para investigações de
amostras com densidade óptica muito baixa. Quim Nova. 2009;32:488-92. doi:10.1590/s0100-40422009000200036
Gigante AC, Pezza L, Pezza HR. Determinação espectrofotométrica de ácido glicólico com ácido cromotrópico assistida por forno de microondas. Ecletica Quim. 2014;27:2-7. doi:10.1590/S0100-46702002000100019
Harris DC. Análise química quantitativa. 6ª. ed. Rio de Janeiro: LTC; 2005.
Lenardão EJ, Freitag RA, Dabdoub MJ, Batista ACF, Silveira CC. “Green Chemistry”: os 12 princípios da química verde e sua inserção nas atividades de ensino e pesquisa. Quim Nova. 2003;26:123-9. doi:10.5902/2236117012918
Lopes AS, Wietholter S, Guilherme LRG, Silva CA. Sistema de plantio direto: bases para o manejo da fertilidade do solo. São Paulo: Associação Nacional para Difusão de Adubos; 2004.
Ma TS. Elemental analysis organic compounds. In: Meyers RA, editor. Encyclopedia of physical science and technology. Orlando: Academic Press; 2001. p.393-405.
Madari BE, Cunha TJF, Novotny EH, Milori DMBP, Martin Neto L, Benites VM, Coelho MR, Santos GA. Matéria orgânica dos solos antrópicos da Amazônia (Terra Preta de Índio: suas características e papel na sustentabilidade da fertilidade do solo). In: Teixeira WG, Kern DC, Madari BE, Lima HN, Woods W, editores. As terras pretas de índio da Amazônia: sua caracterização e uso deste conhecimento na criação de novas áreas. Manaus: Embrapa Amazônia Ocidental; 2009. p.172-88.
Madari BE, Maia CMBF, Novotny EH. Context and importance of biochar research. Pesq Agropec Bras. 2012;47:i-ii. doi:10.1590/S0100-204X2012000500001
Marques GS, Monteiro RPM, Leão WF, Lyra MAM, Peixoto MS, Rolim Neto PJ, Xavier HS,
Soares LAL. Avaliação de procedimentos para quantificação espectrofotométrica de
flavonoides totais em folhas de Bauhinia forficata Link. Quim Nova. 2012;35:517-22.
doi:10.1590/S0100-40422012000300014
Mattos Jr D, Quaggio JA, Cantarella H, Carvalho SA. Superfícies de resposta do tangor “murcott” à fertilização com N, P e K. Rev Bras Frutic. 2004;26:164-7. doi:10.1590/S0100-29452004000100043
Mebius LJ. A rapid method for the determination of organic carbon in soil. Anal Chim Acta. 1960;22:120-4. doi:10.1016/S0003-2670(00)88254-9
Nehlsen J, Benziger J, Kevrekidis I. Oxidation of aliphatic and aromatic sulfides using sulfuric
acid. Ind Eng Chem Res. 2006;45:518-24. doi:10.1021/ie050901m
Nriagu JO, Nieboer E. Chromium in the natural and human environments. Ontario: Wiley Inter-Science; 1988.
Paim APS, Kronka EAM, Reis BF, Korn M. Determinação espectrofotométrica de ácido ascórbico
em fármacos empregando amostragem binária em fluxo. Quim Nova. 1998;21:47-50.
doi:10.1590/S0100-40421998000100008
Pansu M, Gautheryou J. Handbook of soil analysis: Mineralogical, organic and inorganic methods. Berlin: Springer-Verlag; 2003.
Pereira Filho ER, Poppi RJ, Arruda MAZ. Emprego de planejamento fatorial para a otimização das temperaturas de pirólise e atomização de Al, Cd, Mo e Pb por ETAAS. Quim Nova. 2002;25:246-53. doi:10.1590/S0100-40422002000200013
Petter FA, Madari BE. Biochar: Agronomic and environmental potential in Brazilian savannah soils. Rev Bras Eng Agríc Amb. 2012;16:761-8. doi:10.1590/S1415-43662012000700009
Prado AGS. Química verde, os desafios da química do novo milênio. Quim Nova.
2003;26:738-44. doi:10.1590/S0100-40422003000500018
Programa de Análise de Qualidade de Laboratórios de Fertilidade - PAQLF. [acesso em: 15 Agosto 2014]. Disponível em: www.embrapa.br/solos/busca-de-produtos-processos-e-servicos/-/ produto-servico/878/programa-de-analise-de-qualidade-de-laboratorios-paqlf/.
Raij Bvan, Andrade JC, Cantarella H, Quaggio JA. Análise química para avaliação da fertilidade de solos tropicais. Campinas: Instituto Agronômico de Campinas; 2001.
Reeves DW. The rule of soil organic matter in maintaining soil quality in continuous cropping systems. Soil Till Res. 1997;43:131-67. doi:10.1016/S0167-1987(97)00038-X
Rheinheimer DS, Campos BC, Giacomini SJ, Conceição PC, Bortoluzzi EC. Comparação de métodos de determinação de carbono orgânico total no solo. Rev Bras Cienc Solo. 2008;32:435-40. doi:10.1590/S0100-06832008000100041
Rocha FRP, Teixeira LSG. Estratégias para aumento de sensibilidade em espectrofotometria UV-VIS. Quim Nova. 2004;27:807-12. doi:10.1590/S0100-40422004000500021
Roscoe R. Dinâmica da matéria orgânica do solo em sistemas conservacionistas: modelagem matemática e métodos auxiliares. Dourados: Embrapa Agropecuária Oeste; 2006.
Schollenberger CJ. A rapid approximate method for determining soil organic matter. Soil Sci. 1927;24:65-8. doi:10.1097/00010694-192707000-00008
Schollenberger CJ. Determination of soil organic matter. Soil Sci. 1945;59:53-6.
Silva FC. Manual de análises químicas de solos, plantas e fertilizantes. 2ª. ed. Brasília, DF: Embrapa Comunicação para Transferência de Tecnologia; 2010.
Silva FM, Lacerda PSB, Jones Junior J. Desenvolvimento Sustentável e Química Verde. Quim Nova. 2005;28:103-10. doi:10.1590/S0100-40422005000100019
Silva IR, Mendonça ES. Matéria orgânica do solo. In: Novais RF, Alvarez VVH, Barros NF, Fontes RLF, Cantarutti RB, Neves JCL, editores. Fertilidade do solo. Viçosa, MG: Sociedade Brasileira de Ciência do Solo; 2007. p.275-374.
Solomons TWG, Fryhle CB. Química orgânica. 7ª. ed. Rio de Janeiro: Livros Técnicos e
Científicos; 2001.
Souza DM, Sena MM. Aplicação de métodos quimiométricos na otimização da extração de Ca, Mg, K, Fe, Zn, Cu E Mn em folhas de braquiária. Quim Nova. 2012;35:175-9. doi:10.1590/S0100-40422012000100030
Walkley A, Black IA. An examination of the Degtjareff method for determining soil organic matter and a proposed modification of the chromic acid titration method. Soil Sci.
1934;37:29-38. doi:10.1097/00010694-193401000-00003
Weinert PL, Pezza L, Pezza HR. Determinação espectrofotométrica de citrato
de sildenafil em formulações farmacêuticas. Quim Nova. 2008;31:1112-6.
doi:10.1590/S0100-40422008000500033