Engineering
ISSN: 1809-4430 (on-line)
_________________________
2 Universidade Federal de Santa Maria, Campus Frederico Westphalen/ Frederico Westphalen - RS, Brasil. 3 Distribuidor Oficial John Deere, IPESA S.A.C/Lima, Peru.
4 Universidade Federal de Santa Maria/ Santa Maria - RS, Brasil.
5 Department of Agri Food Engineering and Biotechnology, Universitat Politècnica de Catalunya/ Barcelona, Spain.
PERFORMANCE AND EMISSION OF POLLUTANTS OF AN AGRICULTURAL ENGINE WITH TWO POWER TAKE-OFF SETTINGS
Doi:http://dx.doi.org/10.1590/1809-4430-Eng.Agric.v37n2p277-285/2017
JOSÉ F. SCHLOSSER1*, MARCELO S. DE FARIAS2, JAVIER S. ESTRADA3,
GUSTAVO O. DOS SANTOS4, EMILIO GIL5
1*Corresponding autor. Universidade Federal de Santa Maria/ Santa Maria - RS, Brasil.
E-mail: [email protected]
ABSTRACT: Farming operations are usually performed implements driven by a power take-off (PTO) from tractors. Some manufacturers offer PTO settings named as economic (540E). Such configuration drives implements at lower tractor’s engine rotation, thus providing lower fuel consumption. An engine performance using standard (540) or 540E settings are different and poorly studied. The amounts of pollutants emitted by engines vary mainly with the applied load and rotation. The aim of this study was to compare the performance and exhaust emissions of a farming tractor engine under different PTO loads, using both standard (540) and 540E settings. Specific fuel consumption using 540E was an average 14.7% less than the standard setting. However, 540E
promoted increasing levels of gas opacity, CO, CO2, NOx, and HC for the highest PTO power
demands.
KEYWORDS: fuel consumption, exhaust gases, agricultural tractor, 540E setting.
INTRODUCTION
The growing societal concern related to the environment has placed increased pressure on the use of fossil fuels. These propellant materials raise costs of production and are responsible for polluting gas emissions. Since the last century, world energy consumption and environmental pollution have significantly augmented, and there are projections of future progressive increases (JANULEVICIUS et al., 2013).
Fuel consumption and environmental pollution intensity are directly related to the number of diesel engines in trucks, farming tractors, and automotive machines, as well as light-duty vehicles as well. Energy, transportation, and agriculture are economic sectors in dire need for reductions of pollution and fuel consumption (PÉREZ-MARTÍNEZ, 2012).
As energy demand has risen, adverse environmental effects have also emerged, such as
emissions of CO (carbon monoxide), CO2 (carbon dioxide), NOx (nitrogen monoxide and nitrogen
dioxide), HC (hydrocarbons), and PM (particulate matter) from fuel burn (LEBEDEVAS et al., 2013).
Tractors are the most widely used machine in farms, with about 29 million tractors worldwide (BILSKI, 2013). These machines have a diversified use; therefore, optimization of their performance is justified (VALE et al., 2011). A tractor transmission system consists of a set of elements ensuring transfer of power from tractor's engine to other systems such as hydraulic, power take-off (PTO), and driving wheels (MÁRQUEZ, 2004), thus providing useful power to farm equipment.
Sumer et al. (2010) stated that 540E and standard PTO rotations are related to a given tractor engine speed, varying according to its brand, model, and power range. According to the same authors, engine rotations to achieve a standard PTO rotation generate varied fuel consumptions, and any further fuel saving between 540 standard and 540E will vary with the loads applied to the system as well.
Agricultural tractor performance tests are conducted using standard PTO (OECD, 2008). By these tests, specific fuel consumption values are estimated at certain points of engine operation (SILVEIRA et al., 2008).
This study aimed to compare performance parameters and emissions of pollutant gases from a farming tractor's engine subjected to different loads on the PTO, using standard and 540E settings.
MATERIAL AND METHODS
A TL 75E tractor (New Holland, Curitiba, Brazil) equipped with a four-stroke diesel cycle engine with 12 hours of operation, from the same manufacturer, was used in the experiment. The engine model consisted of an FPT (Fiat Power Train), series F5, with four cylinders and conveyed the volume of 3,908 cm³ induced by natural aspiration. According to the manufacturer, the engine maximum power is of 57.4 kW (78 hp) at 2400 rpm. Fuel supply system has rotary type mechanical injection pump (Delphi, DP150). Diesel oil was purchased from a local automobile supply network,
with a specific mass of 0.875 kg L-1 at 18.3 °C. This tractor features both standard and 540E PTO.
PTO torque and power, as a function of engine speed, were estimated by an electric dynamometer (EGGERS, PT 301 MES) with a braking force of up to 551 kW (750 hp). Fuel consumption was measured by an EGGERS flowmeter (FM3-100). Two sensors measured the amount of consumed fuel, which was also used for specific fuel consumption. One of them measures the content of fuel entering the injection pump. The other sensor measures the return, i.e. after passing through injection nozzles. The difference between both of them indicates the total fuel consumption. Engine performance data were gathered using EGGERS Power Control computer software, which controls both the dynamometer and the flowmeter.
The main engine exhaust gases, O2 (% volume), CO2, (% volume), CO (ppm), NOx (ppm),
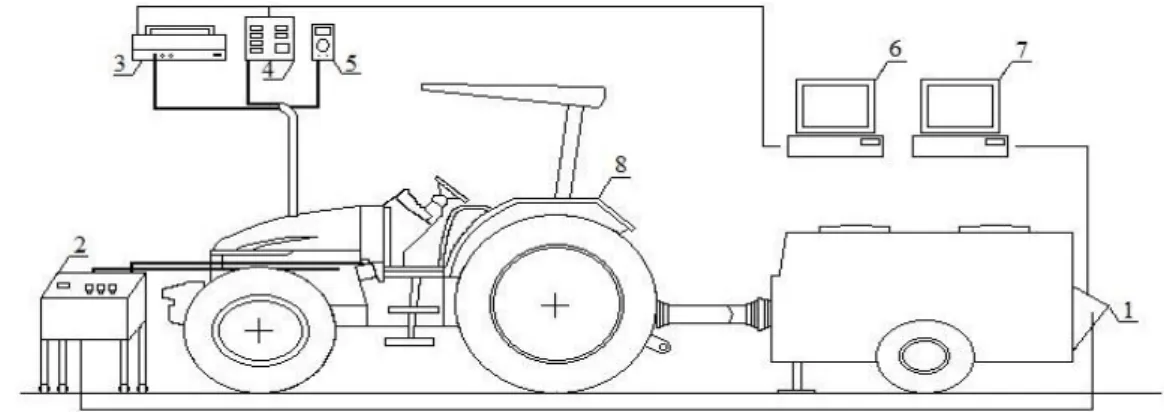
and HC (ppm) were measured by a gas analyzer (SAXON, Infralyt ELD). Exhaust gas opacity was measured by the light absorption coefficient of smoke (k value), using an opacimeter (SAXON, Opacilyt 1030). Control and acquisition of data from both devices were made through MW IELD 01030 software. Additionally, gas temperature values (ºC) were collected by a type k thermocouple. Figure 1 displays a diagram of the experiment.
FIGURE 1. Diagram of the experiment (1. electric dynamometer - EGGERS, PT 301 MES model; 2. flowmeter - EGGERS, FM3-100 model; 3. opacimeter - SAXON, Opacilyt 1030 model; 4. gas analyzer - SAXON, Infralyt ELD, model; 5. type k thermocouple - 6 MW IELD 01030 software; 7. Power Control software; 8. Farming engine testing).
In order to reach an optimum operating temperature, the engine was loaded by the dynamometer for twenty minutes.
Once this was done for each of the evaluated settings, tractor engine was speed up until reaching the PTO standard rotation. Later, after dynamometric brakes were manually activated, eight increasing loads were applied. Each 5-kW power increment in PTO was considered a measurement point where torque, hourly and specific fuel consumption, gas emissions, and opacity were recorded. Each measurement point was maintained for five minutes to stabilization of emission values, and the last 20 seconds were used to collecting the analyzed parameters.
By setting PTO draft speed at 540 rpm, the engine was able to withstand loads until reaching a maximum power of 45 kW at PTO shaft with an engine speed of 1950 rpm. For the 540E setting, the engine could withstand loads of up to a maximum power of 40 kW at PTO shaft working at 1550 rpm. Therefore, comparisons between both settings, 540 and 540E, were made considering loads applied to provide a power of 40 kW at PTO shaft.
For statistical analysis, a two-phase design was used, in which the evaluated factors were PTO setting (540 and 540E) and engine-applied loads (5, 10, 15, 20, 25, 30, 35, and 40 kW). Treatments were set in a completely randomized design with three replicates. Afterward, with the aid of SISVAR software, version 5.3, (FERREIRA, 2011), data underwent analysis of variance (ANOVA) and Tukey's test was applied for mean comparisons at 5% error probability.
RESULTS AND DISCUSSION
Table 1 shows the analysis of variance. The results of torque and specific fuel consumption for both PTO settings (Factor A) and for engine-applied loads (Factor B) demonstrate statistically significant variations.
TABLE 1. Analysis of variance (ANOVA) for the assessed parameters: torque (N m) and specific
fuel consumption (g/kW h-1).
Sources of variation Degrees of freedom Mean squares
Torque Specific fuel consumption
Factor A 1 10710.19 38576.98
Factor B 7 27480.83 148988.67
A x B 7 445.24 5626.04
Residue 32 0.04 61.84
Fc (A x B) 10685.64 90.98
C.V. (%) 0.17 2.18
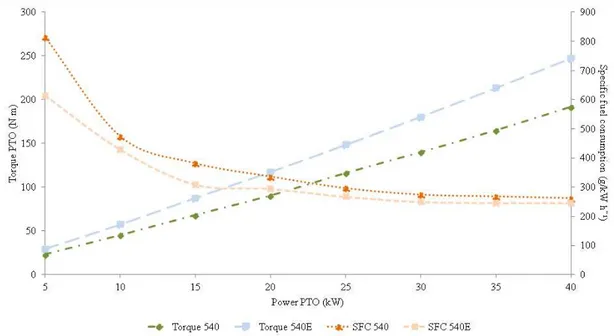
FIGURE 2. PTO torque and engine specific fuel consumption (SFC) according to the power provided to the tractor PTO for both evaluated settings.
Torque values found for the 540E setting were higher than were those of the standard one. The difference between them was similar to all applied loads, being higher than 26.0% and reaching 29.52% for a power of 20 kW at PTO shaft. For 540E, torque values ranged from 29 N m to 247 N m, for power from 5 to 40 kW at PTO shaft, and from 23 N m to 192 N m for the standard setting, within the same power range.
Specific fuel consumption decreased as the power at PTO shaft increased. Engine specific consumption at 540E was lower than were those at the standard setting. The average specific consumption was 14.68% lower when using the setting 540E. Assessing a New Holland tractor, model TD85 (62.5 kW), using an economical PTO setting, SUMER et al. (2010) obtained a 15.88% average saving of specific fuel consumption.
For both settings, the findings could be explained by engine rotation values. When using the 540E, engine presented higher torque values, which was because of a lower engine speed working in this setting. In order to provide a certain power, torque values have to be increased to offset the lower rotation. In addition, since this setting operates at low engine speeds, there is less specific fuel consumption and, thus, providing fuel saving.
FIGURE 3. Engine hourly fuel consumption (L h-1) using standard (540) and 540E settings
according to the power provided to PTO.
According to the smoke opacity of exhaust gases, both settings presented a similar behavior. It is important to highlight that the highest powers at PTO shaft reached a marked increase in the economic setting (Figure 4).
FIGURE 4. Smoke opacity of exhaust gases for standard (540) and 540E settings according to the power at PTO shaft.
In comparison to the 540E, the standard setting significantly reduced the smoke opacity of exhaust gases, in operations requiring power above 25 kW at PTO shaft. Providing a power of 35
kW, using this configuration, smoke opacity was reduced by 3.75 times, from 0.6 m-1 to 0.16 m-1.
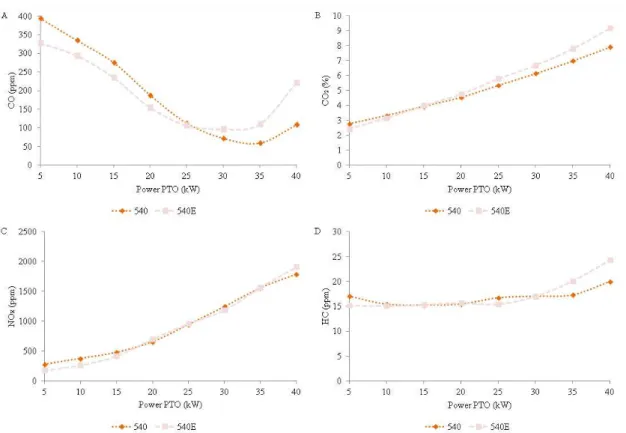
Figure 5A shows that CO emissions within a power range from 5 to 25 kW were reduced 0.87 times, on average, by using the setting 540E. However, for power above 25 kW, CO emissions when using the 540E were higher, being that, for a 40-kW power demand, such a difference was 2.05 times greater.
The greatest amount of CO emitted by an engine operating at high power demand and using
the 540E setting can be explained by a small amount of O2 delivered by it (Figure 6B). Using this
pump, and trying to offset falls in rotation, it injects a greater amount of diesel oil inside combustion chamber, increasing the ratio between air and fuel and, thus, emitting more CO whether compared to the standard setting. These results corroborate those of AN et al. (2013) and YUSAF et al. (2010), who concluded that reductions of CO emissions in exhaust gases derives from a complete combustion.
For both settings, CO2 emissions increased as power demand at PTO shaft was higher (Figure
5B). When power was 40 kW, CO2 emitted by the engine set at 540E was 1.16 times superior
compared to the standard setting. Such an increase in CO2 emissions points to an improved fuel
burn and hence a better exploitation of O2 entering the burning chamber, reducing its exhaust
(Figure 6B). The greatest amount of CO2 emission indicates an efficient fuel burn within the
burning chamber of the engine (SAYIN, 2010).
FIGURE 5. Variation of exhaust emissions: A) CO; B) CO2; C) NOx and D) HC, as a function of
the power provided to the PTO, for both settings.
As for engine emissions of NOx (NO+NO2), averages of 87.54% and 88.16% NO were
reached for all analyzed powers, in both 540 and 540E, respectively. The highest values of NOx
emissions for both settings were achieved when the power demand at PTO shaft was of 40kW
(Figure 5C). According to BUYUKKAYA (2010), engine-applied loads favored NOx emissions,
and as loads were raised, the higher the emissions of these gases.
NOx emissions for both PTO settings showed the same trend. These emissions increased as
exhaust gas temperature of the engine rose (Figure 6A). By setting PTO at 540E and providing 40 kW power, exhaust temperature of the engine reached the highest values, coinciding with the
highest NOx emission (1909.68 ppm). Still, in this setting, the lowest gas temperature was found for
a power of 5 kW, when the lowest NOx emission was recorded (175.38 ppm). According to
MURILLO et al. (2007), NOx emissions are sensitive to combustion temperature, which generally
increases with higher engine-applied loads.
for the highest averages of emission, nearly 22.21 ppm, while the standard one emits around 18.63 ppm.
As above mentioned, the greatest HC emissions can be explained by a low content of oxygen emitted by the engine using the 540E setting (Figure 6B). For these powers, engine works at low rotations, making the fuel injection pump to supply larger volumes of diesel oil, generating an inefficient fuel burning with less oil being used. HC emissions come from problems in the mixing of fuel with air, being mostly affected by a rich mixture formation (CHALLEN & BARANESCU, 1999).
Table 2 presents the best-fit regression equations and the adjusted coefficients of determination (R²) for both PTO settings.
TABLE 2. Regression equations and respective adjusted R² for smoke opacity and emissions for
CO2, CO, NOx, and HC for 540 and 540E settings.
Gas 540 540E
Smoke opacity Y = 0.0005p² – 0.0137p + 0.113
R² = 0.7719 Y = 0.0017p² – 0.0496p + 0.349 R² = 0.9432
CO2 Y = 0.0013p² + 0.0879p + 2.299
R² = 0.9999
Y = 0.0018p² + 0.1081p + 1.878 R² = 0.9993
CO Y = 0.3246p² – 24.2678p + 531.981 R² = 0.9635 Y = 0.4634p² – 25.9094p + 480.849 R² = 0.8833
NOx Y = 0.7701p² + 10.7905p + 178.357
R² = 0.9941
Y = 0.7939p² + 14.8315p + 56.583 R² = 0.9977
HC Y = 0.0081p² R² = 0.8994 – 0.2774p + 17.821 Y = 0.0142p² R² = 0.9579 – 0.4133p + 17.514
p = power at PTO shaft (kW).
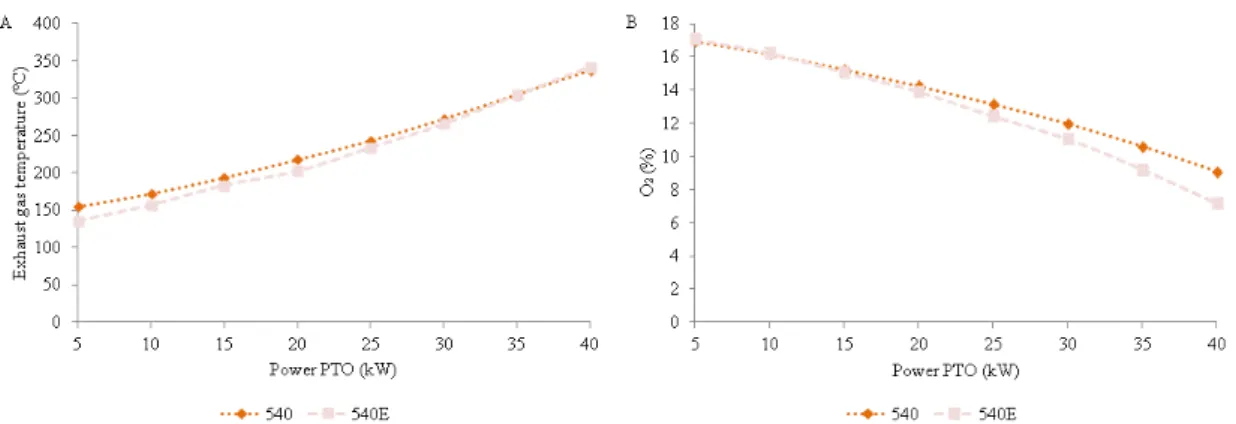
Exhaust gas temperature increased as the power demand at PTO shaft was higher for both settings (Figure 6A). Gas average temperatures for both 540 and 540E were 236.67 ºC and 227.67 ºC, respectively. AGRAWAL et al. (2004), observing the behavior of exhaust gas temperature, claimed that increases, while loads were applied to the engine, were larger.
FIGURE 6. A) Exhaust gas temperature and B) engine emission of O2 for 540 and 540E as a
function of the power provided to the PTO.
Figure 6B shows the behavior of O2 emissions as a function of engine-applied loads. In
contrast, it is noted that until a power of 20 kW, the emissions are decreasing and similar for both settings, 540 and 540E, being on average of 15.65% and 15.58%, respectively. From that point on,
O2 emissions were further reduced and when power demand at PTO shaft was 40 kW when the
CONCLUSIONS
Torque averages measured for both PTO settings tended to increase as a function of the engine-applied load. However, using the 540E, higher values were obtained.
Fuel savings, for both PTO settings, were inversely proportional to the increasing loads applied to the engine and, when using the 540E, engine consumed less fuel if compared to the standard PTO setting.
Exhaust smoke opacity values increased when there was a high power demand. By using the 540E, the opacity levels were accentuated for higher powers.
Emissions of CO, CO2, NOx, and HC had similar behaviors. For low power demands at PTO
shaft, emissions were superior when the standard setting was used. However, for high power demands, the emissions were higher when using the setting 540E.
REFERENCES
AGRAWAL, A. K.; SINGH, S. K.; SINHA, S.; SHUKLA, M. K. Effect of EGR on the exhaust gas temperature and exhaust opacity in compression ignition engines. Proceedings of the Indian Academy of Science, Bangalore, v.29, p.275-284, jun. 2004. Disponível em:
<http://link.springer.com/article/10.1007%2FBF02703777>.
AN, H.; YANG, W. M.; MAGHBOULI, A.; LI, J.; CHOU, S. K.; CHUA, K. J. Performance, combustion and emission characteristics of biodiesel derived from waste cooking oils. Applied Energy, Barking, v.112, p.493-499, dec. 2013. Disponível em:
<http://www.sciencedirect.com/science/article/pii/S030626191200935X>. doi: 10.1016/j.apenergy.2012.12.044.
BILSKI, B. Exposure to audible and infrasonic noise by modern agricultural tractors operators. Applied Ergonomics, Oxford, v.44, p.210-214, aug. 2013. Disponível em:
<http://www.ncbi.nlm.nih.gov/pubmed/22877701>. DOI: 10.1016/j.apergo.2012.07.002. BUYUKKAYA, E. Effects of biodiesel on a DI diesel engine performance, emission and combustion characteristics. Fuel, London, v.89, p.3099-3105, oct. 2010. Disponível em: <http://www.sciencedirect.com/science/article/pii/S0016236110002590>. DOI:
10.1016/j.fuel.2010.05.034.
CHALLEN, B.; BARANESCU, R. Diesel engine reference book. 2nd ed. Woburn: SAE and Butterworth Heinemann, 1999. 675p.
FERREIRA, D. F. Sisvar: A computer statistical analysis system. Ciência e Agrotecnologia, Lavras, v.35, n.6, p.1039-1042, nov./dez. 2011. Disponível em:
<http://www.scielo.br/pdf/cagro/v35n6/a01v35n6.pdf>. DOI: 10.1590/S1413-70542011000600001. FRANTZ, U. G.; SCHLOSSER, J. F.; FARIAS, M. S.; FERIGOLO, L. F.; EBERT, L. C.
Eficiência energética de um trator agrícola utilizando duas configurações de tomada de potência. Ciência Rural, Santa Maria, v.44, n.7, p.1219-1222, jul. 2014. Disponível em:
<http://www.scielo.br/pdf/cr/v44n7/0103-8478-cr-44-07-01219.pdf>. DOI: 10.1590/0103-8478cr20130175.
JANULEVICIUS, A.; JUOSTAS, A.; PUPINIS, G. Tractor’s engine performance and emissions characteristics in the process of ploughing. Energy Conversion and Management, v.75, p.498-508, nov. 2013. Disponível em:
LEBEDEVAS, S.; MAKAREVICIENE, V.; SENDZIKIENE, E.; ZAGLINSKIS, J. Oxidation stability of biofuel containing Camelina sativa oil methyl esters and its impact on energy and environmental indicators of diesel engine. Energy Conversion Management, Oxford, v.65, p.33-40, jan. 2013. Disponível em:
<http://www.sciencedirect.com/science/article/pii/S0196890412002968>. DOI: 10.1016/j.enconman.2012.07.010.
MÁRQUEZ, L. Las transmisiones: el escalonamiento de las marchas. AgroTécnica, Madrid, n.10, p.55-62, 2004.
MURILLO, S.; MÍGUEZ, J. L.; PORTEIRO, J.; GRANADA, E.; MORÁN, J. C. Performance and exhaust emissions in the use of biodiesel in outboard diesel engines. Fuel, London, v.86, p.1765-1771, aug. 2007. Disponível em:
<http://www.sciencedirect.com/science/article/pii/S0016236106004753>. DOI: 10.1016/j.fuel.2006.11.031.
OECD - ORGANIZATION FOR ECONOMIC CO-OPERATION AND DEVELOPMENT. Code 2: Standart Codes for the Official Testing of Agricultural and Forestry Tractors. Paris, 2008. PÉREZ-MARTÍNEZ, P. J. Energy consumption and emissions from the road transport in Spain: a conceptual approach. Transport, Colchester, v.27, n.4, p.383-396, dec. 2012. Disponível em: <http://www.highbeam.com/doc/1G1-317781046.html>. DOI: 10.3846/16484142.2012.751051. SAYIN, C. Engine performance and exhaust gas emissions of methanol and ethanol-Diesel blends. Fuel, London, v.89, n.11, p.3410-3415, Nov. 2010. Disponível em:
<http://www.sciencedirect.com/science/article/pii/S0016236110000669>. DOI: 10.1016/j.fuel.2010.02.017.
SILVEIRA, G. M.; SIERRA, J. G.; CAÑAVATE, J. O. Classificação dos tratores agrícolas de pneus em função de sua eficiência energética. Engenharia na Agricultura, Voçosa, MG, v.16, n.2, p.208-214, abr./jun. 2008. Disponível em:
<http://www.seer.ufv.br/seer/index.php/reveng/article/viewFile/18/8>. DOI: 10.13083/1414-3984.v16n02a0.
SUMER, S. K.; KOCABIYIK, H.; SAY, S. M.; CICEK, G. Comparisons of 540 and 540e PTO operations in tractors through laboratory tests. Bulgarian Journal of Agricultural Science, Sofia, v.16, n.4, p.526-533, 2010. Disponível em: <http://www.agrojournal.org/16/04-16-10.pdf>.
VALE, W. G.; GARCIA, R. F.; JUNIOR, D. C.; GRAVINA, G. A.; SOUZA, F. S. Desempenho operacional e energético de um trator agrícola durante a operação de roçagem. Global Science and Technology, Rio Verde, v.4, n.2, p.68-75, mai./ago. 2011. Disponível em:
<http://rioverde.ifgoiano.edu.br/periodicos/index.php/gst/article/view/422>.
YUSAF, T. F.; BUTTSWORTH, D. R.; SALEH, K. H.; YOUSIF, B. F. CNG-diesel engine performance and exhaust emission analysis with the aid of artificial neural network. Applied Energy, Barking, v.87, p.1661-1669, May. 2010. Disponível em: