ISSN: 1809-4430 (on-line)
_________________________
1 Parte da Dissertação de Mestrado da primeira autora apresentada ao Programa de Pós-Graduação em Engenharia de Sistemas
Agrícolas (PPGESA/ESALQ/USP).
2 Engª Agrícola e Ambiental, Doutoranda em Ciências (Energia Nuclear na Agricultura e no Ambiente), Divisão de Funcionamento
de Ecossistemas Tropicais do CENA/Universidade de São Paulo, Av. Centenário, nº 303, Caixa Postal 96, CEP: 13400- 970, Piracicaba/SP, Fone (19) 34294716, [email protected].
3 Engº Agronômo, Prof Associado 2, Departamento de Engenharia de Biossistemas da Escola Superior de Agricultura "Luiz de EFFECT OF COMPANION ION ON NITRATE DISPLACEMENT THROUGH
TRANSPORT PARAMETERS ANALYSIS
Doi:http://dx.doi.org/10.1590/1809-4430-Eng.Agric.v35n1p 51-62/2015
LÍVIA P. DA SILVA2, JARBAS H. DE MIRANDA3, LUCIANO A. OLIVEIRA4,
JEFFERSON V. JOSÉ5
ABSTRACT: Nitrate is the main form of nitrogen associated with water contamination; the high mobility of this species in soil justifies the concern regarding nitrogen management in agricultural soils. Therefore, the objective of this research was to assess the effect of companion cation on nitrate displacement, by analyzing nitrate transport parameters through Breakthrough Curves (BTCs) and their settings made by numerical model (STANMOD). The experiment was carried out in the Soil and Water Quality Laboratory of the Department of Biosystems Engineering, "Luiz de Queiroz" College of Agriculture in Piracicaba (SP), Brazil. It was performed using saturated soil columns in steady-state flow condition, in which two different sources of inorganic nitrate Ca(NO3)2 and NH4NO3 were applied at a concentration of 50 mg L-1 NO3-. Each column was filled with either a Red-Yellow Oxisol (S1) or an Alfisol (S2). Results are indicative that the companion ion had no effect on nitrate displacement. However, nitrate transport was influenced by soil texture, particle aggregation, solution speed in soil and organic matter presence. Nitrate mobility was higher in the Alfisol (S2).
KEYWORDS: breakthrough curves, solute dynamics, leaching
EFEITO DO ÍON ACOMPANHANTE NO DESLOCAMENTO DO ÍON NITRATO
MEDIANTE ANÁLISE DOS PARÂMETROS DE TRANSPORTE1
RESUMO: O nitrato é a principal forma de nitrogênio associada à contaminação ambiental, e sua elevada mobilidade no solo justifica a preocupação em relação ao manejo da adubação nitrogenada em solos agrícolas tropicais. Portanto, objetivou-se com este trabalho verificar o efeito do íon acompanhante no deslocamento do íon nitrato, mediante a análise dos parâmetros de transporte do nitrato, por meio da elaboração de Breakthrough Curves (BTC) e seus respectivos ajustes pelo modelo de ajuste numérico STANMOD. O experimento foi conduzido no Laboratório de Solos e Qualidade de Água, no Departamento de Engenharia de Biossistemas da Escola Superior de Agricultura “Luiz de Queiroz”, Piracicaba - SP, com amostras de solo deformadas, saturadas e em regime permanente, via aplicação de nitrato, por duas diferentes fontes inorgânicas, Ca(NO3)2 e NH4NO3, na concentração de 50 mg L-1 de NO3-, e em duas classes de solos tropicais: Latossolo Vermelho-Amarelo (S1) e Nitossolo Vermelho (S2). Pelos resultados obtidos, pôde-se verificar que não houve influência do íon acompanhante no deslocamento do nitrato, porém verificou-se que houve influência da textura do solo, agregação das partículas do solo, velocidade da solução no solo e a presença de matéria orgânica, havendo maior mobilidade do nitrato no Nitossolo Vermelho (S2).
INTRODUCTION
Fertilization via irrigation water is commonly known as fertigation, which is a more cost-effective way to provide fertilizers to plants (FREIRE FILHO et al., 2008). Optimized input use in various irrigated crops are possible, keeping water and nutrient availability at ideal levels for a good crop yield (ANDRIOLLO et al., 2011); being considered more effective in drip irrigation systems (OLIVEIRA & VILLAS BOAS, 2008).
Through miscible displacement studies, it is possible to know the characteristic of certain chemicals, such as its interaction with environment, mobility and persistence in soil (SOUZA et al., 2011). Knowing such characteristics and soil hydrodynamics and hidrodispersive, which associated with simulation models, provides a better understanding of solute displacement processes in soil. Therefore, these concepts are characterized as important tools for contamination risk assessment to the environment and its further impacts, besides preventing future damages (CARMO et al., 2010; SOUZA et al., 2011).
Among chemicals, nitrogen is one of major importance for plant growth (RICO-GARCÍA et al., 2009); however, it is transformed into nitrate, which is the oxidized form in soil, and may be absorbed by plants and/ or leached to groundwater after heavy rain or intense irrigation (NAKAGAWA et al., 2012). CERETTA (1997) stated that NO3- leaching is a physical phenomenon favored by its adsorption energy involved to soil particles and high solubility in water, making the anion to follow soil wetting profile; thus, nitrate may move downward when under intense rain or irrigation or upward by capillarity during dry seasons (MUCHOVEJ & RECHCIGL, 1994). Nitrate leaching is strongly related to soil texture and moisture and to its availability (HE et al., 2011).
Retrieved contents of various chemicals within percolated solution through soil columns have been used in some studies to measure their movement (ANAMI et al., 2008; GONÇALVES et al., 2008; DOLTRA & MUÑOZ, 2010; SILVA et al., 2012). According to van GENUCHTEN & WIERENGA (1986), many theoretical models were developed to describe solute transport in soil, which come from differential equations of solute transport in soil with regards to advanced interface between displacer and displaced liquid, and are based on three components that describe solute transport (convection, diffusion and dispersion).
A trend towards the use of mathematical models was noted to predict water and solute transport, being a practical alternative in agricultural and environmental management; however, it has to be taken into account the local specificities and management procedures of intensive agriculture areas (JADOSKI et al., 2010). On the other hand, these models would succeed if transport parameter, which are input values, could be quantified (SOUZA et al., 2011).
Thus, the present research aimed to, through obtention and analysis of transport parameters for the anion nitrate from disturbed soil samples, verify and evaluate the influence of the companion ions (calcium and ammonium), applied in two soil types (different textural classes) [Red-Yellow Oxisol (S1) and Red Alfisol (S2)], whose numerical adjustment was made through STANMOD software.
MATERIAL AND METHODS
The experiment was carried out in the Soil and Water Quality Laboratory of the Department of Biosystems Engineering, "Luiz de Queiroz" College of Agriculture (ESALQ) – USP, in Piracicaba (SP), Brazil (22° 43’ 33” S and 47° 38’ 00” W, at 511 m altitude).
Breakthrough Curves (BTCs) were set by applying various inorganic nitrate sources [calcium nitrate – Ca(NO3)2 and ammonium nitrate – NH4NO3] into two different soil classes, from disturbed soil samples; whose solutions with 50 mg L-1 nitrate; so, it was prepared 16 BTCs, being 4 calcium nitrate columns and 4 ammonium nitrate columns for each soil class.
collected, soil samples were dried, crushed and sieved through a 0.002 m screen resulting in an air-dried fine earth (ADFE). Then, they were submitted to particle size, physical and chemical analysis to generate information on soil at initial conditions.
Soil physical characteristics is presented in Table 1, which are important to understand water movement, and also solute movement. S1 is classified as medium texture and S2 as clayey, according to classification proposed by EMBRAPA (2006). Moreover, it can be seen a greater amount of sand in S1, being superior to S2, while the latter has higher amount of silt.
TABLE 1. Soil physical characterization.
Characteristics S1 S2
Particle size (g kg-1)
Clay (< 0.002 mm) 198 402
Silt (0.053 – 0.002 mm) 32 138
Total sand 770 460
Coarse sand (2.00 – 0.210 mm) 320 210 Fine sand (0.210 – 0.053 mm) 450 250 Soil Textural Class* Medium Clayey Soil Bulk Density (kg d m-3) 1.23 1.23
Particle Density (kg d m-3) 2.60 2.73
Porosity (%) 52.69 54.94
* Classification according to EMBRAPA (2006)
Table 2 shows the chemical characterization of the soil samples.
TABLE 2. Soil chemical characterization.
Parameters S1 S2 Parameters S1 S2
pH (CaCl2) 6.2 6.2 Al (mmolc d m-3) 0 0
O.M. (g d m-3) 13 27 Base sum (mmol
c d m-3) 34 60
P (mg d m-3) 3 3 CEC (mmo l
c d m-3) 49 78
K (mmo lc d m-3) 2.0 2.8 Base Saturation (V%) 69 77
Ca (mmo lc d m-3) 22 34 Al Saturation (m%) 0 0
Mg (mmolc d m-3) 10 23 S (mg d m-3) 14 15
H+Al (mmolc d m-3) 15 18
It was observed in Table 2 for both soils, pH values higher than 6.0, which is considered by RAIJ et al. (1996) a very high value. Base saturation is also within high and very high levels, respectively for S1 and S2.
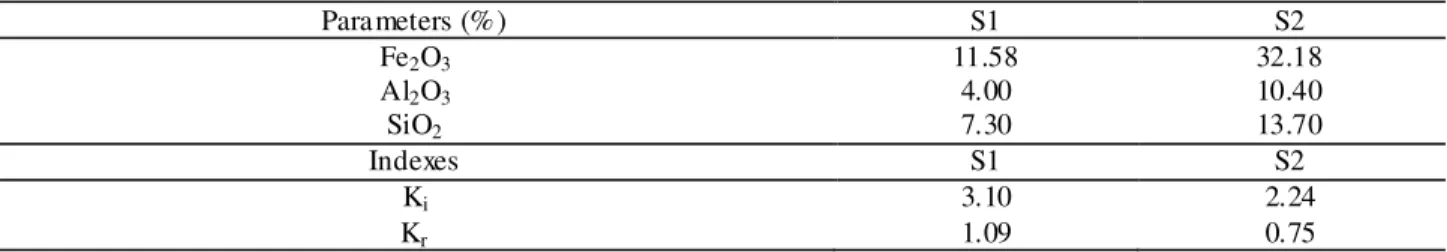
TABLE 3. Soil sulphuric acid attack analysis.
Parameters (%) S1 S2
Fe2O3 11.58 32.18
Al2O3 4.00 10.40
SiO2 7.30 13.70
Indexes S1 S2
Ki 3.10 2.24
Kr 1.09 0.75
Columns were uniformly filled with disturbed soil material, and soil has been previously measured, using the same soil amount for the columns; then, soil was added in layers, and a wooden disc with a smaller diameter than the column lightly compressed each overlay.
The used columns had on the bottom a synthetic fabric circle over a screen fixed by a screw threaded cap. To maintain a constant hydraulic pressure of 0.1 m, a drain was installed at the top of the column to remove water excess, since the volume of solution applied was greater than the ground water flow; and thus, there was no absence of hydraulic head. The soil column had the following dimensions 0.205 m of height and 0.05 m in diameter.
To start the test, it was first necessary to saturate the soil column with distilled water slowly, by capillarity, aiming to expel air out of micropores. The column was placed into a bucket and then distilled water was poured by dripping along the bucket sidewalls to cover two thirds of the column height. Thereafter, the set was left to stand for 24 hours to complete saturation. After 24 hours (saturation period), starts the soil "washing out" with distilled water through the column for a period of at least 24 hours, and all ions present in the soil solution and the exchange complex would be removed by percolating water.
After washing, it was observed in each experimental unit whether flow was under steady-state flow condition. Once proven this condition, solutions of different nitrate sources were passed through the soil columns at a concentration of 50 mg L-1 NO3-, using a Mariotte flask so that nitrate solution flow was kept constant.
From that moment on, effluents were collected sequentially in acrylic bo ttles with sequential numbering, in volumes of 15 mL, wherein pore volumes are function of column volume and soil porosity [eq. (1)].
(1)
where,
– pore volume (L3); – soil porosity (L3 L-3); – column volume (L3)
After collecting effluents, NO3- concentrations were obtained by nitrate determination method in water through spectrophotometer (YANG et al., 1998).
With the values of nitrate concentration of each soil column data, nitrate distribution curves were developed for each soil type and solute used. It was obtained, by a numerical fitting, nitrate transport parameters for each situation, with aid of STANMOD software, which has as input data the relative solute concentration and pore volume. Transport parameters determined by the software are referred to retardation factor (R) eqs. (2) and (3) and Peclet number (P) [eq. (4)], and from these are determined the dispersion coefficient (D) and dispersivity (). Water speed throughout the soil was calculated by sampling time and sampled effluent volume.
where,
– dispersion coefficient (L2 T-1); – solution speed in soil (L T-1);
– retardation factor (non-dimensional).
Retardation factor is defined as:
(3) where,
– soil bulk density (M1 L-3)
– empirical distribution constant (L3 M-1).
If there is interation between solute and soil, k is zero and R is equal to 1 (one).
Peclet number is defined as:
(4) where,
– column length (L).
Results of transport parameters from BTCs, for both soils and solutes, are analyzed and interpreted by behavior and BTC slope, evaluating soil adsorption as well as companion ion effects.
Initially, Shapiro-Wilk (p > 0.05) and Levene statistics were used to check normality and homoscedasticity of nitrate transport data, respectively. Based on normality, it was checked the need to apply the Box-Cox transformation. Parameter data were analyzed by variance analysis, being the qualitative variables analyzed by mean multiple test based on Tukey test (p > 0.05). A possible correlation between Peclet number and solution speed in soil was checked through Pearson correlation coefficient (r) (p > 0.05). Statistical analysis were performed using R language and environment for statistical computing (version 2.2.1).
RESULTS AND DISCUSSION
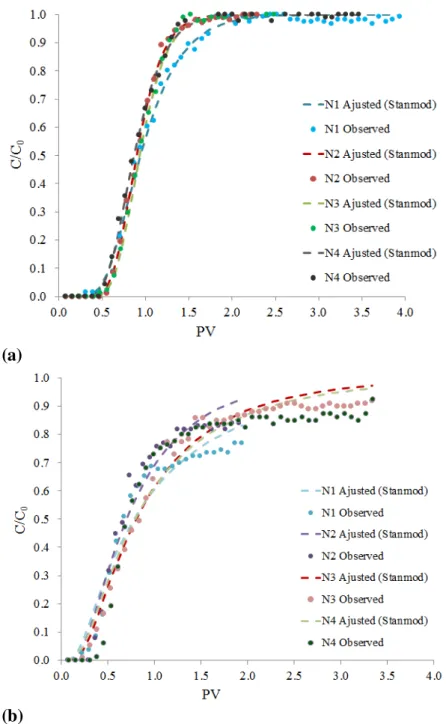
Figures 1a and 1b represent calcium nitrate distribution curves for S1 and S2 disturbed soil samples. By their numerical fitting, it was possible to reach the values of the transport parameters Peclet number (P), retarding factor (R), dispersivity (λ), dispersion coefficient (D); as well as solution speed ( ) and flow within the soil, soil bulk density and porosity.
(a)
(b)
FIGURE 1. Nitrate Breakthrough Curves for Ca(NO3)2, (a) S1; (b) S2.
ROSSI et al. (2007) evaluated a nitrate distribution curve in disturbed and undisturbed samples from two different soil textures (medium-textured and clayey Red-Yellow Oxisol); the authors found a lower rate of nitrate adsorption on clayey soil, which may be due to a larger number of negative charges.
TABLE 4. Nitrate transport parameters for Ca(NO3)2 applied at a concentration of 50 mg L-1 NO3
-Soil BTC P ± SD* R ± SD*
(cm min-1) (cm)
D (cm2 min -1)
q (cm min-1)
ρ
(kg d m-3)
α
(m3 m-3)
S1
N1 12.97 ± 1.96 1.01 ± 0.02 0.68 1.58 1.08 0.32 1.37 0.4731 N2 28.40 ± 1.96 0.93 ± 0.01 0.60 0.72 0.43 0.28 1.37 0.4721 N3 28.87 ± 2.83 0.96 ± 0.01 0.62 0.71 0.44 0.29 1.39 0.4647 N4 19.92 ± 1.56 0.91 ± 0.01 0.68 1.03 0.70 0.33 1.34 0.4836 Mean 16.04 0.95 0.64 1.01 0.66 0.30 1.37 0.4734
S2
N1 1.79 ± 0.74 1.19 ± 0.16 0.08 11.44 0.92 0.04 1.37 0.4997 N2 3.44 ± 1.11 0.90 ± 0.07 0.14 5.96 0.81 0.07 1.34 0.5074 N3 2.98 ± 0.57 1.06 ± 0.05 0.13 6.88 0.89 0.06 1.39 0.4916 N4 2.50 ± 0.86 1.09 ± 0.10 0.11 8.21 0.91 0.05 1.39 0.4907 Mean 2.68 1.06 0.11 8.12 0.88 0.05 1.37 0.4974 * SD standard deviation given by STANMOD software in parameters’ estimate.
The smaller values of solution flow in soil column 2 (N2) and 3 (N3) of S1, 1 (N1) of S2 for Ca(NO3)2 (Table 4); and the greater values from soil column 1 (N1) and 2 (N2) of S1 and 2 (N2) of S2 for NH4NO3 comparing to the remaining columns, both smaller and greater can be attributed to column fulfilling process.
Figures 2a and 2b represent the ammonium nitrate distribution curves. In S1 BTCs, ammonium nitrate application (Figure 2a) has reached relative concentration faster than S1, near 1.5 PV. With respect to S2 (Figures 2b), it was close to 2.0 PV to reach the applied concentration. For calcium nitrate, it was needed more than 2.0 PV for S1 (Figure 1a); while S2 (Figure 1b), in some cases, even after long application, collected effluent has not reached the applied concentration. A possible explanation for that is the NH4+ transformation into NO3- in the ammonium nitrate solution. The lower solution volume required by S1 to reach the concentration is rela ted to lower solution speed in S1 for both cases compared to S2.
Nitrate retardation factor (R) values for Ca(NO3)2 (Table 4) and NH4NO3 (Table 5), in both soil types, were below 1, indicating a high mobility of this anion. According to van GENUCHTEN & WIERENGA (1986), when R is lower than the unit value indicates that solely a fraction of the liquid phase works in the transport process, what may be the case in which the chemical substance is subjected to anionic exclusion or when there is relative stationary water regions that do not take part in the convective transport. Anionic exclusion comes from anion repelling from negative charged surfaces, which is associated with clay and ionizable organic compounds (JAMES & RUBIN, 1986). NAKAGAWA et al. (2012) concluded that NO3- was repelled electrostatically due to the amount of negative charges.
(a)
(b)
FIGURE 2. Nitrate Breakthrough Curves for NH4NO3, (a) S1; (b) S2.
TABLE 5. Nitrate transport parameters for NH4NO3 applied at a concentration of 50 mg L-1 NO3
-Soil BTC P ± SD* R ± SD*
(cm min-1) (cm) (cm2 min D -1) (cm minq -1) (kg d mρ -3) (m3α m-3)
S1
N1 18.30 ± 3.35 0.87 ± 0.02 0.85 1.12 0.95 0.41 1.33 0.4969 N2 21.98 ± 2.70 0.96 ± 0.01 0.76 0.93 0.71 0.37 1.33 0.4973 N3 22.22 ± 2.40 0.97 ± 0.01 0.66 0.92 0.61 0.31 1.36 0.4847 N4 17.13 ± 1.81 0.91 ± 0.01 0.64 1.20 0.77 0.31 1.35 0.4908 Mean 19.91 0.93 0.73 1.04 0.76 0.35 1.34 0.4924
S2
N1 9.25 ± 1.20 0.80 ± 0.02 0.16 2.22 0.35 0.08 1.37 0.4834 N2 4.14 ± 0.52 0.98 ± 0.03 0.42 4.95 2.06 0.21 1.34 0.4957 N3 12.22 ± 0.92 0.81 ± 0.01 0.15 1.68 0.26 0.08 1.37 0.4841 N4 2.24 ± 0.74 0.93 ± 0.08 0.11 9.14 1.00 0.05 1.37 0.4836 Mean 6.96 0.88 0.21 4.49 0.92 0.11 1.36 0.4867
* SD standard deviation given by STANMOD software in parameters’ estimate.
Analyzing the Tables 4 and 5, it was verified for both Ca(NO3)2 and NH4NO3, P values of S1 superior to S2. This fact attests a greater convection speed for S1 on the account of the predominance of macrospores, which are directly responsible for water transport in infiltration process. Furthermore, dispersivity (λ) and dispersion coefficient (D) were greater for S2.
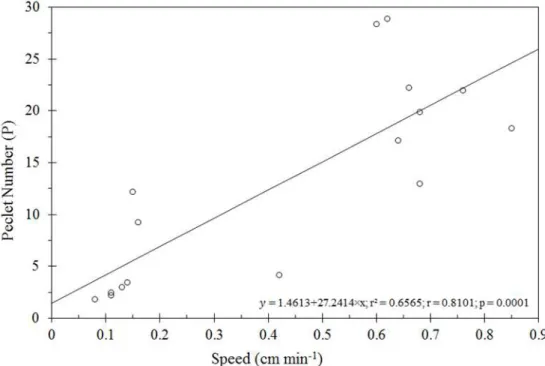
Figure 3 shows the correlation (p > 0.05 and r > 0) between P and , corroborating that Peclet number depends on solution speed in the soil.
FIGURE 3. Relationship between Peclet number (P) and solution speed ( ) in the soil and linear correlation parameters.
Variance analysis summary among treatments can be seen in Table 6. It is observed that only dispersion coefficient of the main nitrate transport parameters did not differ at 5 % probability.
TABLE 6. Variance analysis summary (mean square) of the nitrate transport parameters in soil.
Sources of variation D.F. P R λ D
Treatment 3 375.64* 0.02* 0.38* 2.29* 0.10ns Residue 12 21.45 0.01 0.01 0.11 0.29 General mean - 13.02 0.96 0.42 3.67 0.81 C.V. (%) - 35.57 8.51 21.04 53.02 162.09 *Significant (p < 0.05) and ns – non-significant (p > 0.05), by F-test. (D.F.) Degrees of Freedom; (C.V.) Coefficient of Variation.
TABLE 7. Mean test comparing the main nitrate transport parameters in soil.
Treatment P Treatment R Treatment Treatment λ
S1 Ca(NO3)2 22.54 a S2 Ca(NO3)2 1.06 a S1 NH4NO3 0.73 a S2 Ca(NO3)2 8.12 a
S1 NH4NO3 19.91 a S1 Ca(NO3)2 0.95 ab S1 Ca(NO3)2 0.65 a S2 NH4NO3 4.50 a
S2 NH4NO3 6.96 b S1 NH4NO3 0.93 ab S2 NH4NO3 0.21 b S1 NH4NO3 1.04 b
S2 Ca(NO3)2 2.68 b S2 NH4NO3 0.88 b S2 Ca(NO3)2 0.12 b S1 Ca(NO3)2 1.01 b
Means followed by same lowercase letters in the columns do not differ from each other by Tukey test at 5% probability.
Nitrate high mobility in soils justifies researches on the application of different sources of nitrate; thus, evaluating their behavior. SAMPAIO et al. (2010) evaluated the ion leaching dynamics along soil columns of disturbed and undisturbed dystroferric Red Oxisol samples, which is typical for drip fertigation with swine wastewater, and found greater mobility of nitrate. SANTOS et al. (2009) analyzed the nitrate distribution within soil columns of Arenosol and Red Oxisol fertigated with calcium nitrate using TDR and observed the influence of soil physical and chemical characteristics on nitrate adsorption. ANDRADE et al. (2009) found that in irrigated crops, nitrate leaching was enhanced by soil physical properties, intensive agricultural practices and high water amount for irrigation.
As suggested by JADOSKI et al. (2010), some studies demonstrate nitrate-leaching problems in high production lands. With this respect, BECERRA & BRAVO (2010) reported that research play an important role to generate knowledge on agricultural management to reduce impacts of intensive cropping such as water contamination by nitrate.
CONCLUSIONS
Facing the outcomes, it was noted that mainly, regarding the low interactions between clay surface and solute, a greater nitrate mobility was observed, highlighting the Alfisol (S2).
In addition, it can be stated through the analysis of nitrate transport parameters, from STANMOD numerical model adjustment, that calcium and ammonium did not have influence on nitrate mobility along the soil profile.
ACKNOWLEDGEMENTS
These authors are grateful to the São Paulo Research Foundation (FAPESP Research Project #2011/16438-0) for the scholarship granted to the first author (Master Degre).
REFERENCES
ANDRADE, E.M.; AQUINO, D. N.; CRISÓSTOMO, L.A.; RODRIGUES, J.O.; LOPEZ, F.B. Impacto da lixiviação de nitrato e cloreto no lençol freático sob condições de cultivo irrigado. Ciência Rural, Santa Maria, v.39, n.1, p.88-95, 2009.
ANDRIOLO, J.L.; ERPEN, L.; CARDOSO, F.L.; COCCO, C.; CASAGRANDE, G.S.; JÄNISCH, D.I. Nitrogen levels in the cultivation of strawberries in soilless culture. Horticultura Brasileira, Brasília, v.29, p.516-519, 2011.
ANAMI, M.H.; SAMPAIO, S.C.; SUSZEK, M.; GOMES, S.D.; QUEIROZ, M.M.F. Deslocamento miscível de nitrato e fosfato proveniente de água residuária da suinocultura em colunas de solo. Revista Brasileira de Engenharia Agrícola e Ambiental, Campina Grande, v.12, n.1, p.75–80, 2008. BECERRA, A. T.; BRAVO, X. L. La agricultura intensiva del poniente almeriense - Diagnóstico e instrumentos de gestión ambiental. Revista Eletrónica de medioambiente – M+A, Madrid, v.8, n.1, p.18-40, 2010.
CARMO, A.I.; ANTONINO, A.C.D.; NETTO, A.M; CORRÊA, M.M. Caracterização
CERETTA, C.A. Manejo da adubação nitrogenada na sucessão aveia/milho, no sistema de plantio direto. In: FRIES, M.R.; DALMOLIN, R.S.D. Atualização em recomendação de adubação e calagem: ênfase em plantio direto. Santa Maria: Universidade Federal de Santa Maria, 1997. p.112-124.
DOLTRA, J.; MUÑOZ, P. Simulation of nitrogen leaching from a fertigated crop rotation in a Mediterranean climate using the EU-Rotate_N and Hydrus-2D models. Agricultural Water Management, Amsterdam, v. 97, p.277-285, 2010.
EMBRAPA. Centro Nacional de Pesquisa de Solos. Sistema brasileiro de classificação de solos. 2.ed. Rio de Janeiro: Embrapa Solos, 2006. 306 p.
FREIRE FILHO, J.J.P.; SANTOS, M.S.; BARROS, H.M.M.; LIMA, V.L.A. Uso da fertirrigação na cultura da uva na região do sub-médio vale do São Francisco no Nordeste do Brasil. Ciência e Técnica Vitivinícola, Runa, v.23, n.2, p.75-80, 2008.
GONÇALVES, A.D.M.C.; MIRANDA, J.H.; ROSSI, P.; SABADIN, J.F.G; KAMOGAWA, M.Y. Temperature effect in potassium and nitrate ions in soil transport. Engenharia Agrícola, Jaboticabal, v.28, n.3, p.438-447, 2008.
HE, B.; KANAE, S.; OKI, T.; HIRABAYASHI, Y.; YAMASHIKI, Y.; TAKARA, K. Assessment of global nitrogen pollution in rivers using and integrated biogeochemical modelling frame work. Water Research, Exeter, v.45, n.8, p.2573–2586, 2011.
JADOSKI, S.O.; SAITO, L.R.; PRADO, C.; LOPES, E.C.; SALES, L.L.S.R. Characteristics of the Nitrate leaching in intensive farming areas. Pesquisa Aplicada & Agrotecnologia, Guarapuava, v.3, n.1 p.193-200, 2010.
JAMES, R.V; RUBIN, J. Transport of chloride ion in a water-unsaturated soil exhibiting anion exclusion. Soil Science Society of America Journal, Madison, v.50, p.1142-1149, 1986.
MUCHOVEJ, R.M.C.; RECHCIGL, J.E. Impacts of nitrogen fertilization of pastures and
turfgrasses on water quality. In: LAL, R.; STEWART, B.A. (Ed). Soil processes and water quality. Lewis Publication, 1994. p.91-135.
NAKAGAWA, F.K.; FORTI, G.B.S.; ALVES, M.E.; LAVORENTI, A.; MIRANDA, J.H. Estimating subsoil resistance to nitrate leaching from easily measurable pedological properties. Revista Brasileira de Ciência do Solo, Viçosa, MG, v.36, p. 1491-1498, 2012.
OLIVEIRA, M.V.A.M.; VILLAS BÔAS, R.L. Uniformidade de distribuição do potássio e do nitrogênio em sistema de irrigação por gotejamento. Engenharia Agrícola, Jaboticabal, v.28, n.1, p.95-103, 2008.
PIOVESAN, R.P.; FAVARETTO, N.; PAULETTI, V.; MOTTA, A.C.V. REISSMAN, C.B. Perdas de nutrientes via subsuperfície em colunas de solo sob fertilização mineral e orgânica. Revista Brasileira de Ciência do Solo, Viçosa, MG, v.33, n.1, p. 757-766, 2009.
RAIJ, B. VAN; CANTARELLA, H.; QUAGGIO, J.A.; FURLANI, A.M.C. Recomendações de
adubação e calagem para o estado de São Paulo. 2.ed. Campinas: Instituto Agronômico; Fundação IAC, 1996. 285p. (Boletim Técnico, 100).
RICO-GARCÍA, E.; CASANOVA-VILLAREAL, V.E.; MERCADO-LUNA, A.;
SOTO-ZARAZÚA, G.M.; GUEVARA-GONZALEZ, R.G.; HERRERA-RUIZ, G.; TORRES-PACHECO, I.; VELAZQUEZ-OCAMPO, R.V. Nitrate content on summer lettuce production using fish culture water. Trends in Agricultural Economics, v.2, n.1, p.1-9, 2009.
SAMPAIO, S.C.; CAOVILLA, F.A.; OPAZO, M.A.U.; NÓBREGA, L.H.P.; SUSZEK, M.; SMANHOTTO, A. Lixiviação de íons em colunas de solo deformado e indeformado. Revista Engenharia Agrícola, Jaboticabal, v.30, n.1, p.150-159, 2010.
SANTOS, M.R.; MARTINEZ, M.A.; MATOS, A.T.; OLIVEIRA, R.A.; ZONTA, J.H. Uso da reflectometria do domínio do tempo para avaliar a distribuição de nitrato em colunas de solos fertirrigados. Revista Ambiente & Água – An Interdisciplinary Journal of Applied Science, Taubaté, v.4, n.3, 2009.
SILVA, N.F.; NETO, J.A.L.; TEXEIRA, M.B.; CUNHA, F.N.; MIRANDA, J.H.; COELHO, R.D. Distribuição de solutos em colunas de solo com vinhaça. Irriga, Botucatu, p.340-350, 2012. Edição Especial.
SOUZA, A.L.; MATSURA, E.E.; MIRANDA, J.H.; COLOMBO, A. Ajuste de parâmetros de transporte de solutos no solo utilizando MATLAB 6.5. Revista Engenharia Agrícola, Jaboticabal, v.31, n.6, p.1064-1074, 2011.
VAN GENUCHTEN, M.Th.; WIERENGA, P.J. Solute dispersion coefficients and retardation factors. In: BLACK, C.A. (Ed.). Methods of soil analysis. Madison: Soil Science Society of America pt. 1: Physical and mineralogical methods, 1986. p.1025-1054 (American Society of Agronomy, 9).
YANG, J.E.; SKOGLEY, E.O.; SCHAFF, B.E.; KIM, J.J. A simple spectrophotometric