__________________________________
1Agrícola, Universidad Nacional de Colombia, Sede Bogotá, Facultad de Ingeniería, Departamento de Ingeniería Civil y Agrícola,
2 Profesor Asistente, Universidad Nacional de Colombia, Sede Bogotá, Facultad de Ingeniería, Departamento de Ingeniería Civil y
Agrícola, [email protected].
3 Profesor, Universidad de Ciencias Aplicadas y Ambientales, Facultad de Ingeniería Agronómica, Bogotá, [email protected].
Recebido pelo Conselho Editorial em: 26-4-2011
GEOSTATISTICAL METHODS
CECILIA MEDINA1, JESÚS H. CAMACHO-TAMAYO2, CÉSAR A. CORTÉS3
ABSTRACT: The penetration resistance (PR) is a soil attribute that allows identifies areas with restrictions due to compaction, which results in mechanical impedance for root growth and reduced crop yield. The aim of this study was to characterize the PR of an agricultural soil by geostatistical and multivariate analysis. Sampling was done randomly in 90 points up to 0.60 m depth. It was determined spatial distribution models of PR, and defined areas with mechanical impedance for roots growth. The PR showed a random distribution to 0.55 and 0.60 m depth. PR in other depths analyzed showed spatial dependence, with adjustments to exponential and spherical models. The cluster analysis that considered sampling points allowed establishing areas with compaction problem identified in the maps by kriging interpolation. The analysis with main components identified three soil layers, where the middle layer showed the highest values of PR.
KEYWORDS: compaction, cluster analysis, principal components, Andisol.
ANÁLISIS DE LA RESISTENCIA A LA PENETRACIÓN DEL SUELO MEDIANTE MÉTODOS GEOESTADÍSTICOS Y MULTIVARIADOS
RESUMEN: La resistencia a la penetración (RP) es un atributo del suelo que permite identificar zonas con restricciones debido a la compactación, que se traduce en impedancia mecánica para el desarrollo de las raíces y en una menor productividad de los cultivos. El objetivo del presente trabajo fue caracterizar la RP de un suelo agrícola, mediante análisis geoestadístico y multivariado. El muestreo se realizó de manera aleatoria en 90 puntos, hasta una profundidad de 0,60 m. Se determinaron los modelos de distribución espacial de la RP y se delimitaron áreas con problemas de impedancia mecánica de las raíces. La RP presentó distribución aleatoria a 0,55 y 0,60 m de profundidad. La RP en las otras profundidades analizadas mostraron dependencia espacial, con ajustes a modelos exponenciales y esféricos. El análisis jerárquico que consideró puntos de muestreo, permitió establecer zonas con problemas de compactación, identificadas en los mapas obtenidos mediante interpolación por kriging. El análisis de componentes principales permitió identificar tres capas de suelo, donde la capa intermedia fue la que presentó los mayores valores de RP.
PALABRAS CLAVE: compactación, análisis jerárquico, componentes principales, Andisol.
INTRODUCTION
The penetration resistance (PR) is an appropriate index to evaluate soil compaction problems, limiting plant root development. PR is a physical property of soil, which represents the behavior and effects of different soil properties such as bulk density, moisture content, porosity and permeability, which, result from the particles size distribution, the structure, and the mineral and organic content of soil (SOANEN et al., 1981).
Soil compaction is a detrimental factor that has been evaluated because it causes poor emergency capacity of the plants, affecting soil characteristics such as: availability of nutrients (CONTE et al., 2007), and water storage, causing inefficient use of water resources (SERAFIM et al., 2008) and reducing directly crop yield (STELLUTI et al., 1998).
The PR is an index that can be evaluated through a simple, fast and punctual determination, made directly on the field, by penetrometer or recording penetrometer that are effective and fast (BOWEN, 1981). The PR determined in this way is an indirect measure of the force exerted by the roots to penetrate the pores of the channels, or to deform the soil structure.
Usually, the analysis of this information is performed by univariate techniques that only allow characterizing on time the PR behavior and other soil properties. Therefore, it requires a considerable number of measurements at different locations and depths, to obtain an accurately estimate (LIPIEC & HATANO, 2003). For the analysis of data thus generated, it recommended the use of geostatistical tools, that allow evaluate and understand the spatial variability of soil variables (RAMIREZ-LOPEZ et al., 2008), looking to solve problems such as variability of morphological properties (SALVADOR-BLANES et al., 2006), variability in physical properties (CRUZ et al., 2010, MARTINS et al., 2010), determination of management units and analysis of crop yield (CUCUNUBA-MELO et al., 2011).
Although the geostatistics permit to identify the spatial dependence of a soil property, the multivariate analysis permit to classify an attribute, from the same data set, into groups with common characteristics or similar behaviors, allowing a "natural division" (GRUNWALD et al, 2001), useful to identify management zones in crop areas.
Given the importance of this physical property in the crop growth and development, the aim of this research is to characterize the PR spatial variability in the ‘Silvania’ county (Cundinamarca, Colombia), in an area planted with tomato tree ( Cyphomandra betacea) with the use of
geostatistical tools and multivariate analysis.
MATERIALS AND METHODS
The research area is located in the Silvania county (Cundinamarca, Colombia), in a production lot under tomato tree (Cyphomandra betacea), with 74°21'53, 46'' WL, 4 ° 28 '14, 24''
NL, with 2.025 (m elevation), with bimodal rainfall distribution, located in a region with high agricultural vocation. The soil of the area is an ‘Andisol’, with clay loam texture, volcanic ash, and organic matter (7.72%), humidity (15.00%), and mean values: sand (15.12%), silt (40.24), and clay (44.64 %).
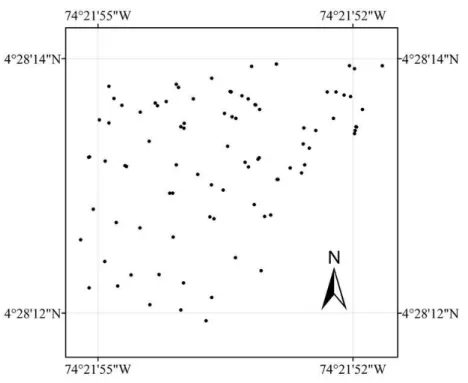
The sampling was performed in an area of 0.5 ha, in March 2010, ending the in dry period, in which 90 points were established following a randomly alternate course with a spacing of 3.0 m between plants in alternate rows (Figure 1). To obtain the PR values it was used an Eijkelkamp recording penetrometer, measuring at each point, reaching up to 0.6 m. depth. For the measuring was used a B penetrometer tip (ASAE S313.3, 2009), with an accuracy of 0.05 MPa. At each net site the measurements were made with constant speed, obtaining three curves, which shows the PR behavior trough the depth. Subsequently, it was generated the data set or database, taking the values at different soil depths: 1, 3, 6, 10, 15, 20, 25, 30, 35, 40, 45, 50, 55 and 60 cm.
normality test, that is sensitive to values close to the median and the edges of the distribution. In this way, it was verified both empirically and numerically the normality fit to each variable, although not essential, provides better predictions when combined with geostatistical techniques (DIGGLE & RIBEIRO, 2000). For analysis of the CV it was taken the criteria of WARRICK & NIELSEN (1980), with low variability for CV under 12%, mean variability between 12 to 60%, and high variability above 60%.
FIGURE 1. Sampling grid distribution.
Then spatial dependence of the attributes was established using the theory of regionalized variables (WEBSTER & OLIVER, 2007), in which the data set were fitted by semivarigram theoretical models (h), defined by:
(01) where z (x) is the variable value at a site x, z (xi + h) another sample value separated at the h distance, and N the number of separated pairs by an h distance. The semivariograms is the arithmetic mean of all squared differences between experimental pairs of values separated by an h distance, or the variance increases of the regionalized variable at locations separated by an h distance.
(02)
(03)
(04)
The spherical model has a high growth rate, although for large distances, marginal increments decrease until it becomes zero. Exponential and Gaussian models are applied when the spatial dependence shows a steady increase in proportion to the distance between observations, where the spatial dependence vanishes for a distance that tends to infinity.
For the geostatistical analysis was used GS + v. 9 software (Gamma Design Software, LLC, Plainwell, MI), determining the theoretical model of semivariogram, whose selection is based on the lower value of the sum of residuals squared, the R 2 of the fitting equation and the similar values obtained between the actual value and the estimated value, that are obtained in the cross validation (FARAC et al., 2008, JOHANN et al., 2010). It also established the degree of spatial dependence (DSD) as the ratio between the nugget effect and the plateau (100 * C/C0 + C), which is classified
as strong if it exceeds 75%, moderate with values between 25% and 75%, and weak when it less than 25% (CAMBARDELLA et al., 1994). When the DSD is close to zero, the fitted model to the experimental semivariogram is called nugget pure effect (NPE) (WEBSTER & OLIVER, 2007) and is defined by (h) = C0, for h> 0, denoting a random spatial distribution of the variable.
Interpolation was subsequently performed by the classic method of Kriging, which is considered the best linear neutral estimator and with minimum variance, presenting results by digital elevation maps. This procedure was performed with the Sufer v. 9 software (Golden Software Inc., Golden, CO).
To improve the understanding of spatial behavior determined through the geostatistical methods it was applied multivariate statistics using SPSS v.17 software (SPSS Inc., Chicago, IL), for the purpose to identify the behavior by the depth and by the PR point , by hierarchical cluster analysis (HCA) and principal component analysis (PCA). In this study it was considered that PR values were correlated both horizontally and vertically (multicollinearity), for which the univariate analysis provides redundant information. This can be eliminated by the use of PCA, because this method reduces the dimensionality and shows the different basic components, which are called principal components. Each principal component (PC) is described in terms of new components, defined as a linear combination from the original variables. The first component represents the maximum value of the total variance and is associated with the largest auto data. The second component is the second linear combination, uncorrelated with the first, which represents the maximum residual variance, and so on, until totally account the variance. It is desirable that a small number of components explain the higher percentage of the total variance, it means, the data set can be described in a lower dimensional space (RAMOS et al., 2007).
On the other hand, the HCA allows to group variables that have similarities. The difference between groups is an estimated distance, which separates a set of variables or attributes in groups. The results are obtained using different algorithms, which calculate the distance through the sum of the squares between two groups, rising over all variables. In each estimate, the sum of squares between groups is minimized over the partitions, through the combination of two groups, estimated in a previous step (RAMOS et al., 2007).
calculates the distance through the sum of the squares between two groups. PCA was then carried out for the different depths considered, using Varimax's rotation.
RESULTS AND DISCUSSION
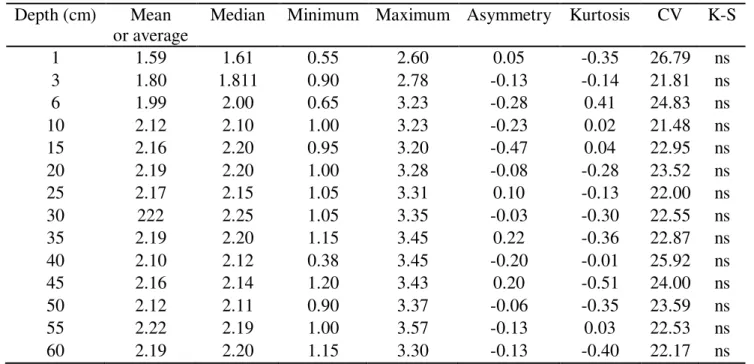
The results obtained from descriptive statistics analysis to demonstrate that it has a symmetric distribution, with similar average and median values for each depth analyzed with a rising trend, associated with this kurtosis values (Table 1). The data set tend to a normal distribution, which is confirmed by the results of the Kolmogorov –Simonov’s test.
In the PR averages is observed that for the soil surface layers is given a lower rank up to six centimeter deep, caused by the recent agricultural management performed in these layers, plus the effect of slope that does not allow the soil stabilization by the effect of dragging of sediments in the area under study. Furthermore, these trends are similar in other studies (VERONESE JUNIOR et al., 2006; RAMIREZ-LOPEZ et al, 2008).
TABLE 1. Descriptive statistics for soil penetration resistance (MPa) at different depths.
Depth (cm) Mean
or average
Median Minimum Maximum Asymmetry Kurtosis CV K-S
1 1.59 1.61 0.55 2.60 0.05 -0.35 26.79 ns
3 1.80 1.811 0.90 2.78 -0.13 -0.14 21.81 ns
6 1.99 2.00 0.65 3.23 -0.28 0.41 24.83 ns
10 2.12 2.10 1.00 3.23 -0.23 0.02 21.48 ns
15 2.16 2.20 0.95 3.20 -0.47 0.04 22.95 ns
20 2.19 2.20 1.00 3.28 -0.08 -0.28 23.52 ns
25 2.17 2.15 1.05 3.31 0.10 -0.13 22.00 ns
30 222 2.25 1.05 3.35 -0.03 -0.30 22.55 ns
35 2.19 2.20 1.15 3.45 0.22 -0.36 22.87 ns
40 2.10 2.12 0.38 3.45 -0.20 -0.01 25.92 ns
45 2.16 2.14 1.20 3.43 0.20 -0.51 24.00 ns
50 2.12 2.11 0.90 3.37 -0.06 -0.35 23.59 ns
55 2.22 2.19 1.00 3.57 -0.13 0.03 22.53 ns
60 2.19 2.20 1.15 3.30 -0.13 -0.40 22.17 ns
CV: coefficient of variation, KS: Kolmogorov – Smirnov´s test, ns: not significant
According to WARRICK & NIELSEN (1980) criteria, CV values show variability average for all depths, getting greater dispersion the first superficial layer, which may be due to soil and climatic conditions to the area and the agricultural management of land under study.
The PR average values higher than 2 MPa for depths evaluated, except the first one, can argue that is a soil that has a potential restriction on the crop roots growth by compaction levels (CARR et al., 2007; RAMIREZ-LOPEZ et al., 2008); however, there are areas with lower values close to 0 MPa and higher values close to 4 MPa.
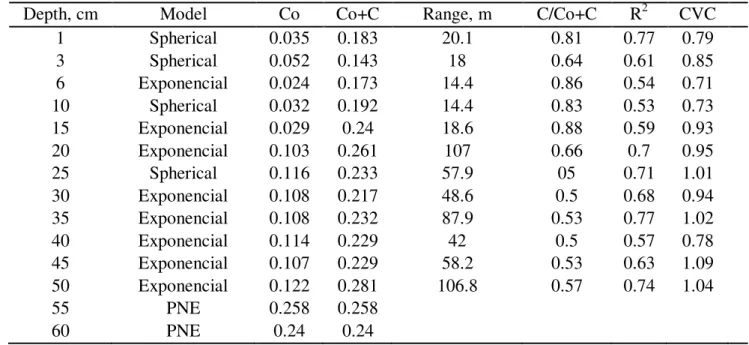
The spatial dependence evaluated with semivariograms indicates that most of the PR of different depths fit to exponential models, followed by the spherical model (Table 2). The depths at 0.55 and 0.60 m did not show spatial dependence; it indicates that the spatial distribution was random, showing a pure nugget effect (PNE). C0 values for the variables that showed spatial
TABLE 2. Parameters of the theoretical semivariograms of soil penetration resistance adjusted to different depth.
Depth, cm Model Co Co+C Range, m C/Co+C R2 CVC
1 Spherical 0.035 0.183 20.1 0.81 0.77 0.79
3 Spherical 0.052 0.143 18 0.64 0.61 0.85
6 Exponencial 0.024 0.173 14.4 0.86 0.54 0.71
10 Spherical 0.032 0.192 14.4 0.83 0.53 0.73
15 Exponencial 0.029 0.24 18.6 0.88 0.59 0.93
20 Exponencial 0.103 0.261 107 0.66 0.7 0.95
25 Spherical 0.116 0.233 57.9 05 0.71 1.01
30 Exponencial 0.108 0.217 48.6 0.5 0.68 0.94
35 Exponencial 0.108 0.232 87.9 0.53 0.77 1.02
40 Exponencial 0.114 0.229 42 0.5 0.57 0.78
45 Exponencial 0.107 0.229 58.2 0.53 0.63 1.09
50 Exponencial 0.122 0.281 106.8 0.57 0.74 1.04
55 PNE 0.258 0.258
60 PNE 0.24 0.24
PNE: pure nugget effect; CVC: cross-validation coefficient
The determination coefficient (R2) was always greater than 0.53 for properties that showed spatial dependence, being the depth of 0.15 m the best fit. These values of R2, with values close to one (1) of the cross-validation coefficient (CVC) for all properties, indicate appropriate confidence of the results. Studies carried out by different authors obtained theoretical adjustments semivariograms models with higher tendency to exponential models (RAMIREZ-LOPEZ et al., 2008; VERONESE JUNIOR et al., 2006), suggesting that PR is commonly adjusted to this model.
The lower ranges were obtained for the first depths, which in turn present the lowest values of C0 and higher values of DSD, which shows that for future sampling this distance can be lower,
indicating that the sampling distance is considered appropriate for the majority of measurements and the predictions for not sampled points by the Kriging method are reliable (VALVUENA CALDERON et al., 2008).
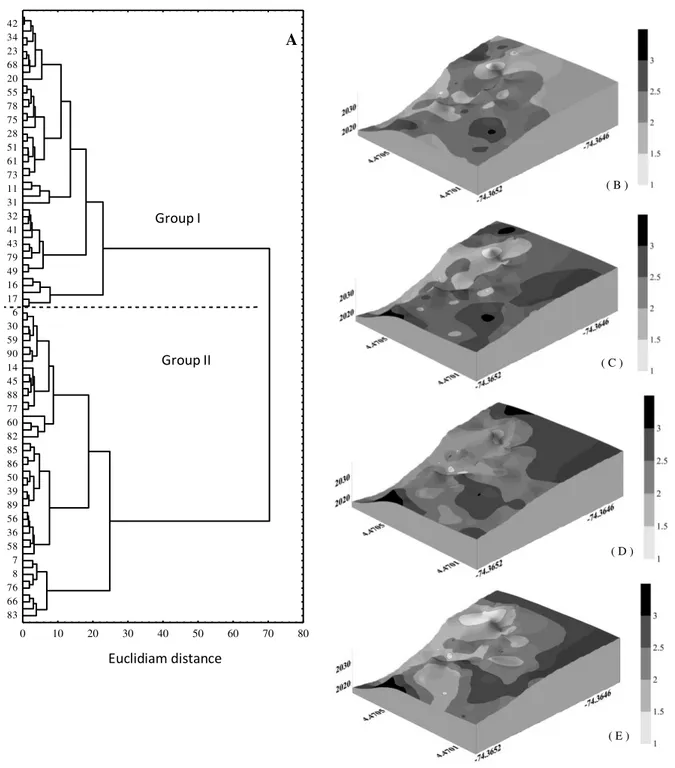
The use of hierarchical cluster analysis (HCA) allows identified management zones, based on different values of PR, both in space and depth. While it is possible to define several areas, in addition to the Euclidean distance is also considered the PR value which occur limiting crop root development for different depths. This value is very controversial and may vary between 1.5 and 3.0 MPa, depending on soil texture and crop. Whereas the crop of the study area is a medium-sized tree, for the present study a value of 2.0 MPa is assumed, a value that is commonly accepted by researchers (HAMZA & ANDERSON, 2005). Based on these criteria, it was defined two management zones, considering a breakpoint Euclidean distance of 30 (Figure 2A).
The first group corresponds to sites with PR low values, while group II show high values, which may be a limitation to root development and consequently for crop productivity, presumably those that do not represent mechanical constraints for plants. The maps obtained at different depths (Figures 2B, 2C, 2D and 2E), have in common that most limiting areas are located in the center and in the upper right and lower left of the study area, associated with the groups obtained in the HCA
3B) and confirm different behavior for each depth considered (WERICH NETO et al., 2006), which also allows subsequent decisions related to soil preparation and partly depends on the crop root system to be establish.
0 10 20 30 40 50 60 70 80
Distancia Euclidiana 83
66 76 8 7 58 36 56 89 39 50 86 85 82 60 77 88 45 14 90 59 30 6 17 16 49 79 43 41 32 31 11 73 61 51 28 75 78 55 20 68 23 34 42
P
unt
o
de
M
ue
st
re
o
A
Grupo I
Grupo II
( B )
( C )
( D )
( E )
FIGURE 2. Points clustering dendrogram (A), and maps of penetration resistance at 10, 20, 30 and 40 cm deep (B, C, D and E; respectively).
S
am
pl
e
P
o
int
Euclidiam distance Group I
0 5 10 15 20 25 30 Distancia Euclidiana 60 55 50 45 40 35 30 25 20 15 10 6 3 1 P rof undi da d ( cm ) A Grupo I Grupo II 0 10 20 30 40 50 60
0.0 1.0 2.0 3.0 4.0
Profundidad (cm)
Resistencia a la penetración (MPa)
RP16 RP Media RP71
B 1 3 6 10 15 20 25 30 35 4045 50 55 60
0.0 0.2 0.4 0.6 0.8 1.0
Componente Principal 1 (53,39%) -0.2 0.2 0.6 1.0 Componente Principal 2 (18, 27%) C
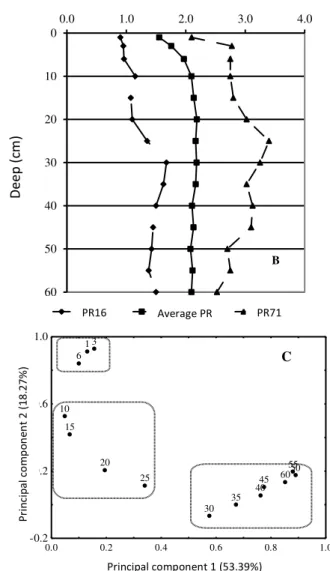
FIGURE 3. Penetration resistance dendrogram grouping (A), Penetration resistance curves (B) and principal components (C), for different depths.
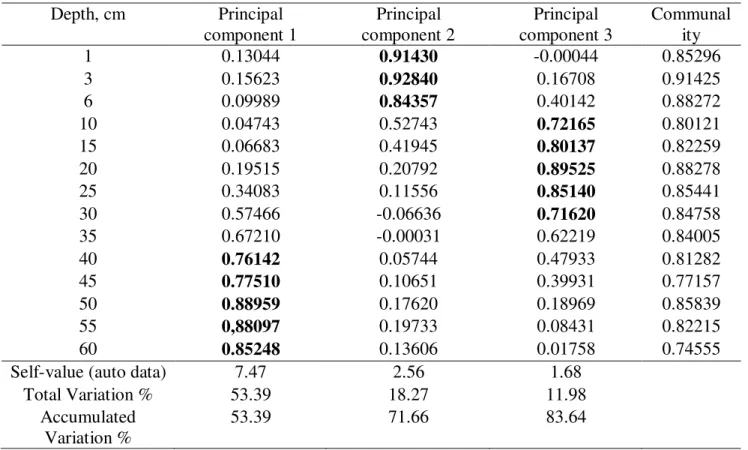
To facilitate the analysis of the PR using multivariate techniques, it was considered as independent of PR variables measuring at each depth. In addition, it was analyzed the principal components with auto data greater than one (1), which for this study was considered an appropriate interval, since the first three principal components explain more than 80% of the total variance (Table 3), and as indicated by KAISER & RICE (1974), it is desirable that the main components analyzed to explain at least 75% of the total variance.
Communality values close to one (1), for the PR at different depths, showing the representative of the components analyzed for this study. Each principal component is directly related to a soil layer, where the first component (PC1), accounting for 53.39% of the total variance, corresponds to the depth of the soil where they presented the highest values of PR located between 0,40 and 0.60 m, an area that is less influenced by the natural processes of soil weathering and where the tillage and machinery traffic probably had little effect, since in this area are not used heavy equipment, obeying this behavior mainly to natural features and drainage conditions, as also reported by WERICH NETO et al. (2006).
Penetration resistance (MPa)
Euclidiam distance De ep ( cm ) Group I Group II D ee p ( cm )
Principal component 1 (53.39%)
Pr in ci p a l co m p o n e n t 2 (1 8 .2 7 % ) Average PR
TABLE 3. Coefficients of the first three principal components of soil penetration resistance at different depths.
Depth, cm Principal
component 1
Principal component 2
Principal component 3
Communal ity
1 0.13044 0.91430 -0.00044 0.85296
3 0.15623 0.92840 0.16708 0.91425
6 0.09989 0.84357 0.40142 0.88272
10 0.04743 0.52743 0.72165 0.80121
15 0.06683 0.41945 0.80137 0.82259
20 0.19515 0.20792 0.89525 0.88278
25 0.34083 0.11556 0.85140 0.85441
30 0.57466 -0.06636 0.71620 0.84758
35 0.67210 -0.00031 0.62219 0.84005
40 0.76142 0.05744 0.47933 0.81282
45 0.77510 0.10651 0.39931 0.77157
50 0.88959 0.17620 0.18969 0.85839
55 0,88097 0.19733 0.08431 0.82215
60 0.85248 0.13606 0.01758 0.74555
Self-value (auto data) 7.47 2.56 1.68
Total Variation % 53.39 18.27 11.98
Accumulated Variation %
53.39 71.66 83.64
In sequence, the second component is related to the surface layer, which presents the major changes, both agronomic management and soil formation processes. This layer shows the lowest values of PR and higher reconsolidation processes occurring in agricultural soils after being subjected to external forces, such as tillage. The third component (PC3) accounts for 11.98% of the total variance and it is represented mainly by the soil layer between 0.10 and 0.30 m, which is the transition zone between A and B horizons of soils of the study area, also showing the side effect of soil preparation labor.
Moreover, most of the resulting coefficients for each component, allow to verify a positive correlation between the different PR between different depths, showing relative continuity between adjacent soil layers, behavior also reported by STELLUTI et al. (1998), because when pressure is exerted on the soil surface, it is transmitted to subsurface layers, dissipating its effect at 0.50 m depth, primarily depending on the texture and soil moisture content (SOANA et al., 1981).
CONCLUSIONS
The study of soil penetration resistance by and multivariate analysis characterized this property both vertically and horizontally, which it identified correlation of penetration resistance independently to each soil depth, and thus allows identifying areas with limitations for crop development.
The multivariate analysis helps to establish management zones, by grouping areas that have similarities both vertically and horizontally, which makes this tool an appropriate complement to classify and divide an attribute, according to the characteristics of the study area.
REFERENCES
BOWEN, H.D. Alleviating mechanical impedance. In: ARKIN, G.F., TAYLOR, H.M. Modifying the root environment to reduce crop stress. St. Joseph : American Society of Agricultural
Engineers, 1981. p.21-57.
CAMBARDELLA, C.A.; MOORMAN, T.B.; NOVAK, J.M; PARKIN, T.B.; KARLEN, D.L.; TURCO, R.F.; KONOPKA, A.E. Field-scale variability of soil properties in Central Iowa Soils.
Soil Science Society of American Journal, Madison, v.58, n.5, p.1501-1511, 1994.
CARRARA, M.; CASTRIGNANÒ, A.; COMPARETTI, A.; FEBO, P.; ORLANDO, S. Mapping of penetrometer resistance in relation to tractor traffic using multivariate geostatistics. Geoderma,
Amsterdam, v.142, n.3-4, p.294-307, 2007.
CONTE, O.; LEVIEN, R.; TREIN, C.R.; CEPIK, C.T.C.; DEBIASI, H. Demanda de tração em haste sulcadora na integração lavoura-pecuária com diferentes pressões de pastejo e sua relação com o estado de compactação do solo. Engenharia Agrícola, Jaboticabal, v.27, n.1, p. 220-228,
2007.
CRUZ, J.S.; ASSIS JÚNIOR, R.N.; MATIAS, S.S.R.; CAMACHO-TAMAYO, J.H. TAVARES, R.C. Análise espacial de atributos físicos e carbono orgânico em argissolo vermelho-amarelo cultivado com cana-de-açúcar. Ciência e Agrotecnologia, Lavras, v.34, n.2, p. 271-278, 2010.
CUCUNUBÁ-MELO, J.L.; ÁLVAREZ-HERRERA, J.G.; CAMACHO-TAMAYO, J.H.
Identification of agronomic management units based on physical attributes of soil. Journal of Soil Science and Plant Nutrition, Temuco, v.11, n.1, p.87- 99, 2011.
DIGGLE, P.J.; RIBEIRO, J.R. Model Based Geostatistics. 1ed. São Paulo: Associação Brasileira de
Estatística. 2000. 129 p.
FARACO, M.A.; URIBE-OPAZO, M.A.; SILVA, E. A.; JOHANN, J.A.; BORSSOI, J.A. Seleção de modelos de variabilidade espacial para elaboração de mapas temáticos de atributos físicos do solo e produtividade da soja. Revista Brasileira de Ciência do Solo, Viçosa-MG, v.32, n.2, p
463-476, 2008.
GRUNWALD, S.; McSWEENEY, K., ROONEY, D.J.; LOWERY, B. Soil layer models created with profile cone penetrometer data. Geoderma, Amsterdam, v.103, n.1-2, p.181-201, 2001.
HAMZA, M.A.; ANDERSON, W.K. Soil compaction in cropping systems: A review of the nature, causes and possible solutions. Soil and Tillage Research, Amsterdam, v.82, n.2, p.121-145, 2005.
JOHANN, J.A.; SILVA, M.C.A.; URIBE-OPAZO, M.A.; DALPOSSO, G.H. Variabilidade Espacial da rentabilidade, perdas na colheita e produtividade do Feijoeiro. Engenharia Agrícola,
Jaboticabal, v.30, n.4, p.700-714, 2010.
KAISER, H.F.; RICE, J. Little Jiffy Mark IV. Educational and Psychological Measurement, Durham, v.34, n.1, p.111-117, 1974.
LIPIEC, J.; HATANO, H. Quantification of compaction effects on soil physical properties and crop growth. Geoderma, Amsterdam, v.116, n.1-2, p.107-136, 2003.
MARTINS, A.L.S.; MOURA, E.G.; CAMACHO-TAMAYO, J.H. Spatial variability of infiltration and its relationship to some physical properties. Ingeniería e Investigación, Bogotá, v.30, n.2,
p.116-123, 2010.
RAMÍREZ-LÓPEZ, L.; REINA-SÁNCHEZ, A.; CAMACHO-TAMAYO, J.H. Variabilidad espacial de atributos físicos de un Typic Haplustox de los Llanos Orientales de Colombia.
Engenharia Agrícola, Jaboticabal, v.28, n.1, p.55-63, 2008.
RAMOS, M. C.; COTS-FOLCH, R.; MARTÍNEZ-CASASNOVAS, J. A. Effects of land terracing on soil properties in the Priorat region in Northeastern Spain: A multivariate analysis. Geoderma,
Amsterdam, v.142, n.3-4, p.251 – 261, 2007.
SALVADOR-BLANES, S.; CORNU, S.; COUTURIER, A.; KING, D.; MACAIRE, J.J.
Morphological and geochemical properties of soil accumulated in hedge-induced terraces in the Massif Central, France. Soil and Tillage Research, Amsterdam, v.85, n.1-2, p.62-77, 2006.
SERAFIM, M.E.; VITORINO, A.C.T.; PEIXOTO, P.P.P.; SOUZA, C.M.A.; CARVALHO, D.F. Intervalo hídrico ótimo em um latossolo vermelho distroférrico sob diferentes sistemas de
produção. Engenharia Agrícola, Jaboticabal, v.28, n.4, p.654-665, 2008.
STELLUTI, M.; MAIORANA, M.; GIORGIO, D. Multivariate approach to evaluate the
penetrometer resistance in different tillage systems. Soil and Tillage Research, Amsterdam, v.46,
n.3-4, p.145-151, 1998.
SOANE, B.D.; BLACKWELL, P.S.; DICKSON, J.W.; PAINTER, D.J. Compaction by agricultural vehicles: a review 1. Soil and wheel characteristics. Soil and Tillage Research, Amsterdam, v.1, n.1,
207-237, 1981.
VALBUENA CALDERÓN, C.A.; MARTÍNEZ and MARTÍNEZ, L.J.; GIRALDO HENAO, R. Variabilidad espacial del suelo y su relación con el rendimiento de mango (Mangifera indica L.).
Revista Brasileira de Fruticultura, Jaboticabal, v.30, n.4, p.1146-1151, 2008.
VERONESE JÚNIOR, V.; CARVALHO, M.P.; DAFONTE, J.; FREDDI, O.S.; VIDAL VÁZQUEZ, E.; INGARAMO, O.E. Spatial variability of soil water content and mechanical resistance of Brazilian ferralsol. Soil and Tillage Research, Amsterdam, v.85, n.1-2, p.166-177,
2006.
WARRICK, A.W.; NIELSEN, D.R. Spatial variability of soil physical properties in the field. In: HILEEL, D. Applications of soil physics. New York: Academic Press, 1980. p 319 -44.
WEIRICH NETO, P.H.; BORGUI. E.; SVERZUT, C.B.; MANTOVANI, E.C.; GOMILDE, R.L.; NEWES, W.L.C. Análise multivariada da resistência do solo à penetração sob plantio direto.
Ciência Rural, Santa Maria, v.36, n.4, p.1186-1196, 2006.
WEBSTER, R., OLIVER, M.A. Geostatistics for environmental scientists. Hoboken: John Wiley &