Skull shape and size variation within and between
mendocinus
and
torquatus
groups in the genus
Ctenomys
(Rodentia: Ctenomyidae) in chromosomal
polymorphism context
Rodrigo Fornel
1,2, Pedro Cordeiro-Estrela
1,3and Thales Renato O. de Freitas
1,4 1Departamento de Genética, Universidade Federal do Rio Grande do Sul, Porto Alegre, RS, Brazil.
2Universidade Regional Integrada do Alto Uruguai e das Missões – Campus de Erechim, Erechim, RS,
Brazil.
3
Departamento de Sistemática e Ecologia, Centro de Ciências Exatas e da Natureza – Campus I,
Universidade Federal da Paraíba, João Pessoa, PB, Brazil.
4Programa de Pós-Graduação em Genética e Biologia Molecular, Universidade Federal
do Rio Grande do Sul, Porto Alegre, RS, Brazil.
Abstract
We tested the association between chromosomal polymorphism and skull shape and size variation in two groups of the subterranean rodentCtenomys. The hypothesis is based on the premise that chromosomal rearrangements in small populations, as it occurs inCtenomys, produce reproductive isolation and allow the independent diversification of populations. Themendocinus group has species with low chromosomal diploid number variation (2n=46-48), while species from thetorquatus group have a higher karyotype variation (2n=42-70). We analyzed the shape and size variation of skull and mandible by a geometric morphometric approach, with univariate and multivariate statisti-cal analysis in 12 species frommendocinus and torquatus groups of the genus Ctenomys. We used 763 adult skulls in dorsal, ventral, and lateral views, and 515 mandibles in lateral view and 93 landmarks in four views. Although we expected more phenotypic variation in thetorquatus than the mendocinus group, our results rejected the hypothesis of an association between chromosomal polymorphism and skull shape and size variation. Moreover, thetorquatus group did not show more variation thanmendocinus. Habitat heterogeneity associated to biomechanical constraints and other factors like geography, phylogeny, and demography, may affect skull morphological evolution in Ctenomys.
Keywords: Cranium, geometric morphometrics, phenotypic evolution, subterranean rodent.
Received: May 6, 2017; Accepted: November 23, 2017.
Introduction
The genusCtenomysis composed of approximately 70 species that are found in South America (Bidau, 2015; Freitas, 2016). These subterranean rodents show the largest chromosomal polymorphism among mammals, with dip-loid numbers varying from 2n=10 inC. steinbachito 2n=70 inC. pearsoni (Reig et al., 1990; Ortells and Barrantes, 1994). Because of this large karyotype variation, chromo-somal speciation has been proposed as a probable, or pri-mary mechanism of cladogenesis within the genus Cte-nomys(King, 1993; Ortells and Barrantes, 1994). Adaptive radiation caused by key innovations to the underground niche (Nevo, 1979) and patchy population structure (Reig
et al., 1990) have been proposed as alternative or concur-rent mechanisms to explain high rates of diversification. However, most of these mechanisms have been seriously challenged by analyses based on molecular data. The mere fact thatCtenomyspresents high rates of diversification has failed to receive significant support when compared to
Hystricognathoussister lineages (Cook and Lessa, 1998). Tomasco and Lessa (2007) have shown that chromosomal populations are polyphyletic relative to mitochondrial DNA inC. pearsoni. Adding to this fact, no sign of nega-tive heterosis has been found in hybrid zones ofCtenomys
(Freitas, 1997; Gava and Freitas, 2002, 2003). Negative heterosis would be required in traditional models of chro-mosomal speciation to disrupt gene flow between popula-tions. Thus, its absence seriously undermines these tradi-tional models as a primary mechanism of diversification in
Ctenomys. However, Navarro and Barton (2003) and Rieseberg and Livingstone (2003) have proposed that the
Send correspondence to Thales Renato O. de Freitas. Depar-tamento de Genética, Universidade Federal do Rio Grande do Sul, Avenida Bento Gonçalves 9500, 91501-970 Porto Alegre, RS, Brazil. E-mail: thales.freitas@ufrgs.br.
reduced recombination of rearranged chromosomes might favor the accumulation of adaptive differences on rear-ranged regions. In this article, we analyze an adaptive struc-ture, the skull, within two clades ofCtenomysthat differ radically in number of chromosomal rearrangements.
Studies based on morphological, cytogenetic, and molecular data have proposed different lineages or main groups within the genusCtenomys(Lessa and Cook, 1998; Contreras and Bidau, 1999; D’Eliaet al., 1999; Mascheretti
et al., 2000; Slamovitset al., 2001; Parada et al., 2011). Two of these groups,mendocinusandtorquatus, are very different in chromosomal polymorphism.
Themendocinusgroup, suggested by Massariniet al.
(1991), is known for its low variation in chromosomal dip-loid number. The majority of species have from 2n=46 to 2n=48, the exception beingC. rionegrensiswith 2n=48-56 (Reiget al., 1992). This group is formed by seven species:
C. mendocinus(2n=47-48),C. azarae(2n=46-48),C. cha-siquensis(2n=47-48),C. rionegrensis(2n=48-56),C. por-teousi(2n=47-48),C. australis(2n=48), andC. flamarioni
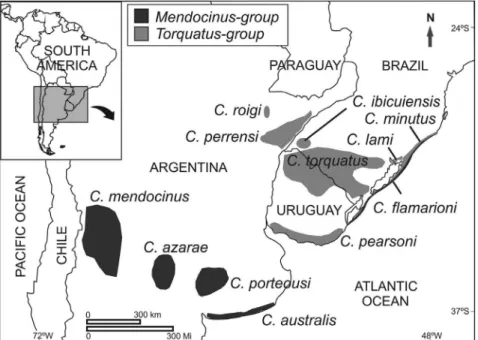
(2n=48) (Massariniet al., 1991; Reiget al., 1992; Freitas, 1994; Massariniet al., 1998; D’Eliaet al., 1999; Massarini and Freitas, 2005). All species from this group present the asymmetric sperm form (Vitulloet al., 1988; Freitas, 1994, 1995; Massarini et al., 1998). The mendocinusgroup is found in centralwestern Argentina, western Uruguay, and in the coastal plain of southern Brazil (Massariniet al., 1991, Massarini and Freitas, 2005) (Figure 1).
The torquatus group, proposed by Parada et al.
(2011), shows a high chromosomal diploid number varia-tion, from 2n=40 to 2n=70. It is formed byC. torquatus
with 2n=40-46 (Freitas and Lessa, 1984; Fernandeset al., 2009a,b),C. lamiwith 2n=54-58 (Freitas, 2001, 2007),C. minutuswith 2n=42-50 (Freitas, 2006), C. perrensi with 2n=50-58 (Ortellset al., 1990, Reiget al., 1992),C. pear-soniwith 2n=56-70 (Novello and Altuna, 2002),C. roigi
with 2n=48 (Ortellset al., 1990), andC. ibicuiensiswith 2n=50 (Freitaset al., 2012). All species from this group present symmetric sperm form (Vitulloet al., 1988; Freitas, 1995). Thetorquatusgroup occurs in Northern and South-ern Uruguay, SouthSouth-ern Brazil, and NortheastSouth-ern Argentina (Freitas, 1994, 2006; Paradaet al., 2011) (Figure 1).
Both groups occupy heterogeneous habitats, from dunes in the Atlantic coast to low valleys in the West (Reig
et al., 1990) (Figure 1). Molecular phylogenetic analyses support themendocinusandtorquatusgroups as two mono-phyletic clades (D’Eliaet al., 1999; Castilloet al., 2005; Paradaet al., 2011). Contreras and Bidau (1999) proposed that chromosomal rearrangements could play an important role in the source of reproductive isolation in small popula-tions (common in several species of genus Ctenomys). Thus, if chromosomal rearrangements act in reproductive isolation and allow populations to evolve independently of each other (by natural selection or genetic drift), we ex-pected that thetorquatusgroup, which has high chromo-somal polymorphism, would show more variable skull shapes and sizes than themendocinusgroup, which has low chromosomal polymorphism.
Geometric morphometrics is more efficient in captur-ing information related to the shape of the organisms and presents a greater statistical robustness than traditional measurements. In addition, it allows for the reconstruction
of changes in shape and statistical inference, which is very important for the visualization of shape differences (Rohlf and Marcus, 1993). Some studies used the geometric mor-phometric approach to investigate the relationship between chromosomal polymorphism and morphological skull vari-ation inCtenomysat an intraspecific level (Fernandeset al., 2009a; Fornelet al., 2010). Therefore, at the interspecific level (among species) there is a lack of information on the role of chromosomal rearrangements in morphological evolution ofCtenomys.
Much controversy remains on the role of chromo-somal diploid number variation related to speciation in the genusCtenomys. Therefore, the aim of this study was to in-vestigate the variation in skull shape and size within and be-tween themendocinusandtorquatusgroups and test the association of chromosomal polymorphism and skull mor-phological variation in these two groups.
Material and Methods
Sample
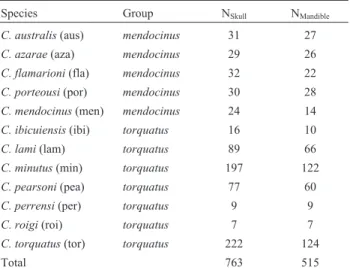
We analyzed 763 skulls and 515 mandibles of adults representing 12 species from themendocinusandtorquatus
groups (Table 1). The skulls and mandibles were obtained from the following museums and scientific collections: Departamento de Genética, Universidade Federal do Rio Grande do Sul, Porto Alegre, Brazil (UFRGS); Museo Nacional de História Natural y Antropología, Montevideo, Uruguay (MUNHINA); Museo Argentino de Ciencias Na-turales “Bernardino Rivadavia”, Buenos Aires, Argentina (MACN); Museo de La Plata, La Plata, Argentina (MLP); Museo de Ciencias Naturales “Lorenzo Scaglia”, Mar del Plata, Argentina (MMP); Museum of Vertebrate Zoology, University of California, Berkeley, USA (MVZ); American Museum of Natural History, New York, USA (AMNH); and Field Museum of Natural History, Chicago, USA
(FMNH). We assumed that sexual dimorphism was negli-gible for the present study. Interspecific differences are in general greater than sexual differences, so we used males and females together in all analyses.
Geometric morphometrics
Each cranium was photographed in the dorsal, ven-tral, and left lateral views of the skull and on the left side of the mandible with a digital camera, at a resolution of 3.1 megapixels (2048´1536), using the macro function
with-out flash. We used 29 two-dimensional landmarks for dor-sal, 30 for ventral, and 21 for lateral views of the skull, as proposed by Fernandeset al.(2009a), though Fornelet al.
(2010) added another 13 landmarks for the lateral view of the mandible (Figure 2; Supplementary Table S1).
Ana-Table 1- Sample size of skulls and mandibles of 12 species ofCtenomys
frommendocinusandtorquatusgroups.
Species Group NSkull NMandible
C. australis(aus) mendocinus 31 27
C. azarae(aza) mendocinus 29 26
C. flamarioni(fla) mendocinus 32 22
C. porteousi(por) mendocinus 30 28
C. mendocinus(men) mendocinus 24 14
C. ibicuiensis(ibi) torquatus 16 10
C. lami(lam) torquatus 89 66
C. minutus(min) torquatus 197 122
C. pearsoni(pea) torquatus 77 60
C. perrensi(per) torquatus 9 9
C. roigi(roi) torquatus 7 7
C. torquatus(tor) torquatus 222 124
Total 763 515
tomical landmarks were positioned for each specimen us-ing TPSDig version 1.40 software (Rohlf, 2004). All land-marks were captured by the same person (R.F.). Coordinates were superimposed using a generalized Pro-crustes analysis (GPA) algorithm (Dryden and Mardia, 1998), since GPA removes differences unrelated to the shape, such as scale, position, and orientation (Rohlf and Slice, 1990; Rohlf and Marcus, 1993; Bookstein, 1996a, 1996b; Adamset al., 2004). We symmetrized landmarks on both sides of the skull’s dorsal and ventral views, and only the symmetric part of the variation was analyzed (Kent and Mardia, 2001; Klingenberget al., 2002; Evinet al., 2008). The size of each skull was estimated using its centroid size, the square root of the sum of squares of the distance of each landmark from the centroid (mean of all coordinates) of the configuration (Bookstein, 1991).
Statistical analysis
For testing skull size differences we used analysis of variance (ANOVA) of the centroid size. For multiple com-parisons of centroid size, we used Tukey’s test and Box plots to visualize its variation. For skull shape we used prin-cipal component analysis (PCA), canonical variate analysis (CVA), and multivariate analysis of variance (MANOVA) of the principal components (PCs). To choose the number of PCs to be included in the linear discriminant analysis (LDA), we computed correct classification percentages with each combination of PCs (Baylac and Friess, 2005). We selected the subset of PCs giving the highest overall correct classification percentage. We then used a leave-one-out cross validation procedure that allows for an unbiased estimate of classification percentages (Ripley, 1996; Baylac and Friess, 2005). Cross validation is used to evaluate the performance of classification by LDA. We
used LDA for computed correct classification percentages among groups and species. The Mahalanobis’s D2 dis-tances were used to generate phenograms with the neigh-bor-joining method. Finally, we used Procrustes distances to measure the variation in skull shape within the men-docinusandtorquatusgroups, and used Levene’s test to as-sess the equality of variances in different groups.
For all statistical analyses, as well as for generating graphs we used the R language and environment version 2.9.0 for Windows (R Development Core Team, http://www.R-project.org) and the following libraries: MASS (Venables and Ripley, 2002), ape version 1.8-2 (Paradiset al., 2004), stats (R Development Core Team), and ade4 (Dray and Dufour, 2007). Geometric morpho-metric procedures were carried out using the Rmorph pack-age, a geometric and multivariate morphometrics library for R (Baylac, 2008).
Results
Size
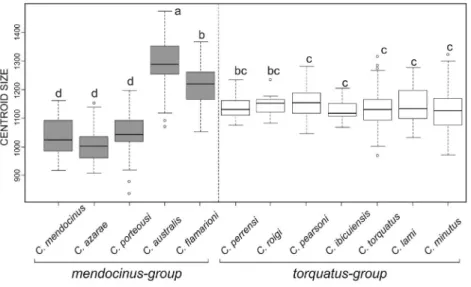
The two groups,mendocinusandtorquatus, did not differ significantly in skull centroid size (P > 0.05). We found significant differences among species for size (dor-sal:F= 42.94,P< 0.001; ventral:F= 39.24,P< 0.001; lat-eral:F = 38.96,P< 0.001; and mandible: F= 38.7,P< 0.001). However, the Tukey test showed no significant dif-ference among species belonging to thetorquatusgroup (P> 0.05) (Figure 3). The species from the mendocinus
group were more varied in skull centroid size than the
torquatusgroup, withC. australisbeing significantly big-ger than the other species in both groups (Tukey:P< 0.001 in all pairwise comparisons) (Figure 3).
Shape – two groups
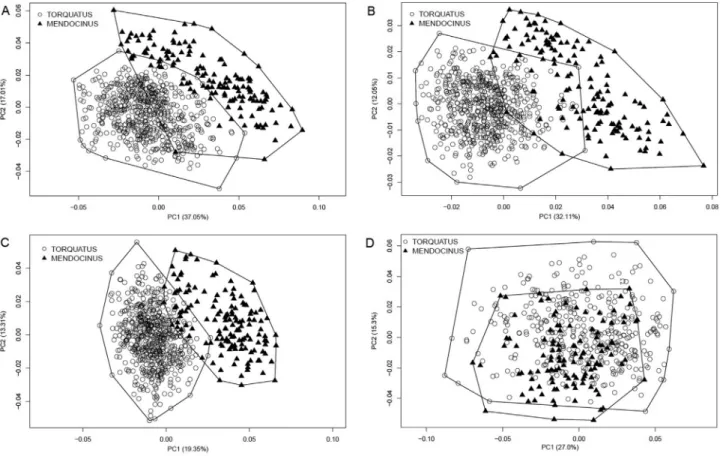
PCA for the three views of the cranium showed two structured groups with low superimposition corresponding to themendocinusandtorquatusgroups (Figure 4A-C). Re-garding the mandible, there was no difference between groups (Figure 4D). The LDA for three views of the skull and mandible showed higher percentages of correct classi-fication for thetorquatusgroup (Table 2). The lateral view of the skull had the highest (100%) and the mandible the lowest (94.87% formendocinusand 97.16% fortorquatus) percentage of correct classification in LDA (Table 2). Comparison between the two groups was significant for all views of the skull (dorsal:lWilks = 0.17,F = 365.4,P <
0.001; ventral:lWilks= 0.18,F= 246.68,P< 0.001; lateral: lWilks= 0.21,F= 555.57,P< 0.001; and mandible:lWilks=
0.31,F= 84.22,P< 0.001).
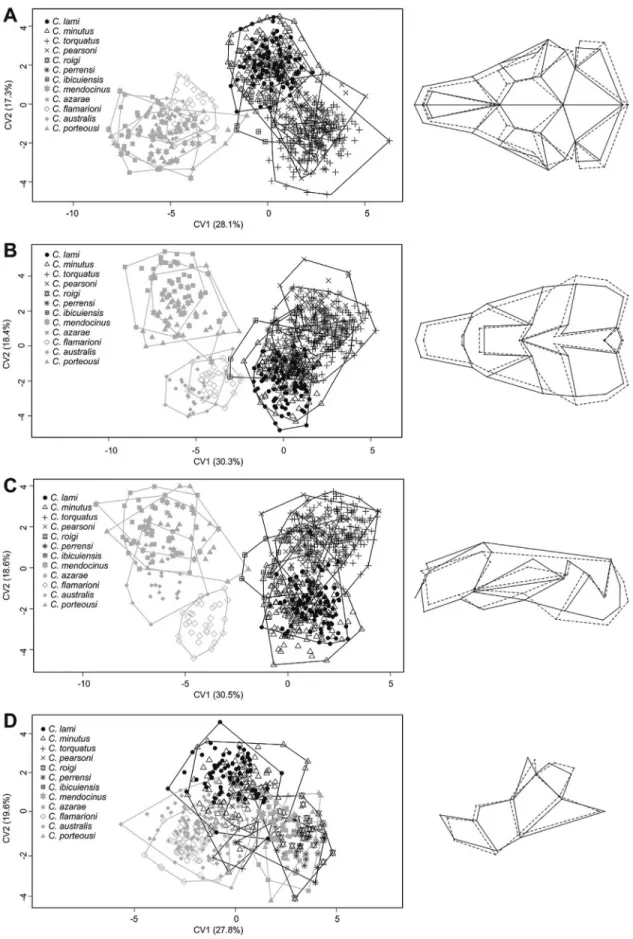
Skull shape differences between the two groups and among species are given in a CVA scatterplot (Figure 5). In the mendocinus group, the skull’s three views provided similar results, while thetorquatusgroup showed separa-tion in the 1stcanonical axes (Figure 5A-C). Thetorquatus
had a proportionally bigger rostrum, larger zygomatic arch, deeper skull, and a proportionally larger coronoid process in the mandible than themendocinus(Figure 5A-C). The
mendocinusgroup animals have longer nasals and a larger
tympanic bulla than those of thetorquatusgroup (Figure 5A-C). For the mandible, CVA did not show separation be-tween the two groups (Figure 5D).
Shape – species
There was a significant difference among species (dorsal: lWilks = 0.002, F = 30.41, P < 0.001; ventral: lWilks= 0.002,F= 32.8,P< 0.001; lateral:lWilks= 0.002,
F= 33.33,P< 0.001; mandible:lWilks= 0.017,F= 16.68,
P< 0.001).
The LDA for dorsal views of the skull showed the highest percentage of correct classification forC. australis,
C. flamarioni, andC. roigi(100%, Table 3). The speciesC. mendocinusandC. perrensishowed the lowest values of
Figure 4- Scatterplot of principal component analysis (PCA) show the two first PCs for two groups ofCtenomys, themendocinusandtorquatusgroups for dorsal (A), ventral (B), and lateral (C) views of the skull and lateral view of the mandible (D). Variance percentages for PC1 and PC2 are given in pa-renthesis.
Table 2 - Percentage of correct classification for mendocinus and
torquatusgroups using linear discriminant analysis (LDA) for dorsal, ven-tral, and lateral views of the skull, and lateral view of the mandible.
Group
mendocinus torquatus
Dorsal 99.31 100
Ventral 98.63 100
Lateral 100 100
Figure 5- Scatterplot of canonical variate analysis (CVA) show the two first canonical axis for 12 species ofCtenomysfrom themendocinusand
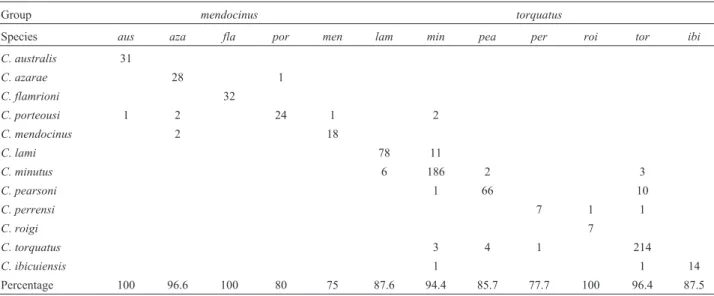
correct classification (75% and 77.7%, respectively, Ta-ble 3). Almost all specimens were classified in the correct group, the only exception beingC. porteousi, which be-longs to the mendocinusgroup and had two individuals classified erroneously in thetorquatusgroup (Table 3). The other views of the skull and mandible showed lower per-centages of classification than the dorsal view of the skull (data not shown).
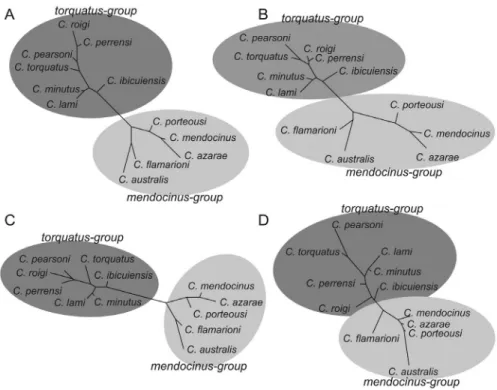
The phenogram using morphological data for dorsal, ventral, and lateral views of the skull showed a larger sepa-ration betweenmendocinusandtorquatusgroups (Figure 6A,B,D) than those of the mandible (Figure 6D). More-over, the Mahalanobis distances in the cladogram indicate a subdivision in themendocinusgroup, with a strong mor-phological association between C. australis and C. fla-marioni, separated fromC. mendocinus,C. porteousi, and
C. azarae (Figure 6). In the same way, in the torquatus
group,C. lamiandC. minutuswere strongly associated.
Intragroup variation
The variation amplitude of Procrustes distances did not differ significantly between themendocinus and tor-quatusgroups for dorsal, ventral, and lateral views of the skull and mandible (Levene’s test:F= 0.221,P= 0.64;F= 0.005,P= 0.94;F= 0.083,P= 0.77;F= 0.082,P= 0.78, re-spectively).
Discussion
We analyzed skull and mandible shape and size varia-tion within and between the mendocinus and torquatus
groups of the genusCtenomys. Our results agree with other studies in determining that the two groups have very differ-ent skull morphologies. There is no evidence of conver-gence among species from different groups.
Contreras and Bidau (1999) suggested that chromo-somal rearrangements could reduce gene flow and even promote isolation among populations. Nevertheless, some works demonstrated the occurrence of hybrid zones be-tween different chromosomal rearrangements (Freitas, 1997; Gava and Freitas, 2002, 2003). Moreover, Fernandes
et al.(2009a) found that chromosomal evolution and phe-notypic variation are not necessarily related. We reject the hypothesis that a high chromosomal polymorphism is asso-ciated to a high morphological variation at the interspecific level in themendocinugroup. Our data showed that besides
mendocinusandtorquatusgroups displaying very different chromosomal polymorphisms, there is no evidence of asso-ciation between chromosomal diploid number and skull shape variation. Rieseberg and Livingstone (2003) pro-posed that the reduced recombination of rearranged chro-mosomes might favor the accumulation of adaptive differ-ences on rearranged regions. Our data did not support this hypothesis in the genusCtenomys, because themendocinus
group with low chromosomal polymorphism showed skull shape variation (amplitude of variation) like thetorquatus
group, which presented high chromosomal polymorphism. These results agree with Tomasco and Lessa (2007) who argue that chromosomal speciation might not be the main factor inCtenomysdiversification.
Themendocinusgroup occurs in heterogeneous habi-tats, from coastal dunes to the proximity of the Andes. Sev-eral species of Ctenomys are characterized as scratch (claws) and chisel-tooth (incisors) diggers. These incisors can be used for building tunnel systems, and soil hardness could influence the incisor procumbency and affect skull morphology (Vassallo, 1998; Moraet al., 2003; Verzi and Olivares, 2006). In the species of themendocinusgroup we found a pattern in skull centroid size. Populations near the
Table 3- Classification of 12 species ofCtenomysfrommendocinusandtorquatusgroups for dorsal view of the skull using linear discriminant analysis (LDA). The diagonal line shows the samples that were correctly classified. The percentage of correct classification is given in the last line. The species ab-breviations follow the same order in the first column and Table 1.
Group mendocinus torquatus
Species aus aza fla por men lam min pea per roi tor ibi
C. australis 31
C. azarae 28 1
C. flamrioni 32
C. porteousi 1 2 24 1 2
C. mendocinus 2 18
C. lami 78 11
C. minutus 6 186 2 3
C. pearsoni 1 66 10
C. perrensi 7 1 1
C. roigi 7
C. torquatus 3 4 1 214
C. ibicuiensis 1 1 14
ocean coasts are bigger than those inland (see Figures 1 and 3). Thus, different types of soil hardness could play a role in biomechanical constraints and diversification in skull mor-phology of theCtenomys: smaller skulls for hard soils and lager skulls for soft soils. Nevertheless, this size difference between regions could affect skull morphology due to dif-ferent dietary types.Ctenomysare herbivorous and feed on a variety of grasses, eating both the subterranean and subaereal parts of gramineae (Reiget al., 1990; Lopeset al., 2015). Thus, primary productivity, food quality, and abundance may influence body size (Medinaet al., 2007). Nevertheless, we do not have knowledge on the ecology of allmendocinusgroup species, such as data about vegetable richness, in order to completely explain the difference in skull size. Themendocinus group occupies a larger area than thetorquatusgroup and its distribution is more frag-mented (Figure 1). This more intensive isolation of the
mendocinusspecies could allow for a larger differentiation among them. In this regard, we found a strong association betweenC. australisandC. flamarioni: both are found in the sand dunes of the Atlantic coast and are more distant from othermendocinusspecies (Figure 6). Thus, both eco-logic and phylogenetic constraints permitC. australisand
C. flamarionito be very close.
Mandible shape and size were less variable than skull in the twoCtenomysgroups, making for a rather weak dis-criminatory structure. A more confined amount of morpho-logical variation was observed in the mandible of C. minutus(Fornelet al., 2010). This is probably the result of stabilizing selection, since the functions of the mandible are
more restricted than in the rest of the skull (Borgeset al., 2017).
Medinaet al.(2007) found that the genusCtenomys
follows the converse of Bergmann’s rule. This agrees with our data: larger species occupy warm areas while smaller species occupy cold and inner continent areas near the An-des mountain range. Thus, thermoregulation may not be a great constraint to subterranean species, because tunnel systems protect from the outside weather.
New studies on the association between morphologi-cal and geographimorphologi-cal distances and on several aspects of ecological, demographic, as well as historical factors of the differentCtenomysspecies will help understand the evolu-tion and the explosive cladogenesis seen in this group of ro-dents in Neotropical regions.
Acknowledgments
We are very grateful to Fabiano A. Fernandes, Daniza Molina-Shiller, and Gisele S. Rebelato for their help with skull photographs. We thank Michel Baylac for providing the Rmorph package. Thanks as well to all curators and col-lection managers who provided access toCtenomys speci-mens: Enrique Gonzáles (MUNHINA); Olga B. Vacaro and Esperança A. Varela (MACN); Diego H. Verzi and A. Itatí Olivares (MLP); A. Damián Romero (MMP); James L. Patton, Eileen A. Lacey, and Christopher Conroy (MVZ); Eileen Westwig (AMNH); and Bruce D. Patterson (FMNH). This work was supported by the Conselho Nacio-nal de Desenvolvimento Científico e Tecnológico (CNPq);
Figure 6- Phenogram using neighbor-joining method and Mahalanobis distances from lateral view of the skull for 12 species ofCtenomysfrom the
Coordenação de Aperfeiçoamento de Pessoal de Nível Su-perior (CAPES); Fundação de Amparo à Pesquisa do Rio Grande do Sul (FAPERGS); Departamento de Genética – UFRGS; and Projeto Tuco-tuco. P.C-E. was supported by the CNPq/CAPES PROTAX Program for Taxonomy. R. F. was supported by a Doctoral fellowship from CNPq (grant proc. No. 142953/2005-9).
References
Adams DC, Rohlf FJ and Slice DE (2004) Geometric morpho-metrics: Ten years of progress following the “revolution”. Ital J Zool 71:5-16.
Baylac M and Friess M (2005) Fourier descriptors, Procrustes su-perimposition and data dimensionality: An example of cra-nial shape analysis. In: Slice DE (ed) Modern Morpho-metrics in Physical Anthropology. Springer-Verlag, New York, pp 145-166.
Baylac M (2008) Rmorph: A R geometric and multivariate mor-phometrics library. Available from the author: baylac@mnhn.fr.
Bidau CJ (2015) Family Ctenomyidae Lesson, 1842. In: Patton JL, Pardiñas UFJ and D’Elía G (eds) Mammals of South America. The University of Chicago Press, Chicago, pp 818-877.
Bookstein FL (1991) Morphometric Tools for Landmark Data: Geometry and Biology. Cambridge University Press, Lon-don, 435 p.
Bookstein FL (1996a) Biometrics, biomathematics and the mor-phometric synthesis. Bull Math Biol 58:313-365.
Bookstein FL (1996b) Combining the tools of geometric mor-phometrics. In: Marcus LF, Corti M, Loy A, Naylor G and Slice DE (eds) Advances in Morphometrics. Plenum Pub-lishing Corporation, New York, pp 131-151.
Borges LR, Maestri R, Kubiak BB, Galiano D, Fornel R and Freitas TRO (2017) The role of soil features in shaping the bite force and related skull and mandible morphology in the subterranean rodents of genus Ctenomys (Hystricognathi: Ctenomyidae). J Zool 301:108-117.
Castillo AH, Cortinas MN and Lessa EP (2005) Rapid diversifica-tion of South American Tuco-tucos (Ctenomys: Rodentia, Ctenomyidae): Contrasting mitochondrial and nuclear intron sequences. J Mammal 86:170-179.
Contreras JR and Bidau CJ (1999) Líneas generales del panorama evolutivo de los roedores excavadores sudamericanos del género Ctenomys (Mammalia, Rodentia, Caviomorpha, Ctenomyidae). Ciencia Siglo XXI. Fundación Bartolomé Hidalgo. Buenos Aires, 123 p.
Cook JA and Lessa EP (1998) Are rates of diversification in sub-terranean South American tuco-tucos (genus Ctenomys, Rodentia: Octodontidae) ususlly high? Evolution 52:1521-1527.
D’Elía G, Lessa EP and Cook JA (1999) Molecular phylogeny of Tuco-tucos, genus Ctenomys (Rodentia: Octodontidae): Evaluation of themendocinusspecies group and the evolu-tion of asymmetric sperm. J Mammal Evol 6:19-38. Dray S and Dufour AB (2007) The ade4 package: Implementing
the duality diagram for ecologists. J Stat Softw 22:1-20. Dryden IL and Mardia KV (1998) Statistical Shape Analysis.
John Wiley & Sons, New York, 347 p.
Evin A, Baylac M, Ruedi M, Mucedda M and Pons JM (2008) Taxonomy, skull diversity and evolution in a species com-plex ofMyotis(Chiroptera: Vespertilionidae): A geometric morphometric appraisal. Biol J Linn Soc 95:529-538. Fernandes FA, Fornel R, Cordeiro-Estrela P and Freitas TRO
(2009a) Intra- and interspecific skull variation in two sister species of the subterranean genus Ctenomys (Rodentia, Ctenomyidae): coupling geometric morphometrics and chromosomal polymorphism. Zool J Linn Soc 155:220-237. Fernandes FA, Gonçalves GL, Ximenes SSF and Freitas TRO
(2009b) Karyotypic and molecular polymorphisms in Ctenomys torquatus(Rodentia: Ctenomyidae): Taxonomic considerations. Genetica 136:449-459.
Fornel R, Cordeiro-Estrela P and Freitas TRO (2010) Skull shape and size variation in Ctenomys minutus (Rodentia: Cte-nomyidae) in geographical, chromosomal polymorphism, and environmental contexts. Biol J Linn Soc 101:705-720. Freitas TRO (1994) Geographical variation of heterochromatin in
Ctenomys flamarioni(Rodentia-Octodontidae) and its cyto-genetic relationships with other species of the genus. Cytogenet Cell Genet 67:193-198.
Freitas TRO (1995) Geographical distribution of sperm forms in the genus Ctenomys (Rodentia Octodontidae). Rev Bras Genet 18:43-46.
Freitas TRO (1997) Chromosome polymorphism inCtenomys minutus(Rodentia-Octodontidae). Rev Bras Genet 20:1-7. Freitas TRO (2001) Tuco-tucos (Rodentia, Octodontidae) in
southern Brazil:Ctenomys lamispec. nov. separated fromC. minutusNehring 1887. Stud Neotrop Fauna Environ 36:1-8. Freitas TRO (2006) Cytogenetics status of fourCtenomysspecies
in the south of Brazil. Genetica 126:227-235.
Freitas TRO (2007) Ctenomys lami: The highest chromosome variability inCtenomys(Rodentia, Ctenomyidae) due to a centric fusion/fission and pericentric inversion system. Acta Theriol 52:171-180.
Freitas TRO (2016) Family Ctenomyidae (Tuco-tucos). In: Wil-son DE, Lacher Jr TE and Mittermeier RA (eds) Handbook of the Mammals of the World - Volume 6, Lagomorphs and Rodents I. Lynx Edicions Publications, Barcelona, pp 1-900. Freitas TRO and Lessa EP (1984) Cytogenetics and morphology ofCtenomys torquatus (Rodentia: Octodontidae). J Mam-mal 65:637-642.
Freitas TRO, Fernandes FA, Fornel R and Roratto PA (2012) An endemic new species of tuco-tuco, genus Ctenomys (Ro-dentia: Ctenomyidae), with a restricted geographic distribu-tion in southern Brazil. J Mammal 93:1355-1367.
Gava A and Freitas TRO (2002) Characterization of a hybrid zone between chromosomally divergent populations ofCtenomys minutus(Rodentia, Ctenomyidae). J Mammal 83:843-851. Gava A and Freitas TRO (2003) Inter and intra-specific
hybridiza-tion in tuco-tucos (Ctenomys) from Brazilian Coastal Plains (Rodentia, Ctenomyidae). Genetica 119:11-17.
Kent JT and Mardia K (2001) Shape, Procrustes tangent projec-tions and bilateral symmetry. Biometrika 88:469-485. King M (1993) Species Evolution. Cambridge University Press,
Cambridge, 335 p.
Klingenberg CP, Barluenga M and Meyer A (2002). Shape analy-sis of symmetric structures: Quantifying variation among in-dividuals and asymmetry. Evolution 56:1909-1920. Lessa EP and Cook JA (1998) The molecular phylogenetics of
sug-gests an early burst of speciation. Mol Phylogenet Evol 9:88-99.
Lopes CM, Barba M, Boyer F, Mercier C, Silva Filho PJS, Heidtmann LM, Galiano D, Kubiak BB, Langone PQ, Gar-cias FM,et al.(2015) DNA metabarcoding diet analysis for species with parapatric vs sympatric distribution: A case study on subterranean rodents. Heredity 114:1-12.
Mascheretti S, Mirol PM, Giménez MD, Bidau CJ, Contreras JR and Searle JB (2000) Phylogenetics of the speciose and chromosomally variable rodent genus Ctenomys (Cteno-myidae: Octodontidae), based on mitochondrial cytochrome b sequences. Biol J Linn Soc 70:361-376.
Massarini AI and Freitas TRO (2005) Morphological and cyto-genetics comparison in species of the mendocinus-group (genus Ctenomys) with emphasis in C. australis and C. flamarioni(Rodentia-ctenomyidae). Caryologia 58:21-27.
Massarini A, Barros MA and Ortells M (1991) Evolutionary biol-ogy of fossorial Ctenomyinae rodents (Caviomorpha: Octo-dontidae). I. Cromosomal polymorphism and small karyo-typic differentiation in Central Argentinian populations of tuco-tucos. Genetica 83:131-144.
Massarini AI, Dyzenchauz FJ and Tiranti SI (1998) Geographic variation of chromosomal polymorphism in nine popula-tions ofCtenomys azarae,tuco-tucos of theCtenomys
men-docinus group (Rodentia: Octodontidae). Hereditas
128:207-211.
Medina AI, Martí DA and Bidau CJ (2007) Subterranean rodents of the genusCtenomys(Caviomorpha, Ctenomyidae) follow the converse to Bergmann’s rule. J Biogeogr 34:1439-1454.
Mora M, Olivares AI and Vassallo AI (2003) Size, shape and structural versatility of the skull of the subterranean rodent Ctenomys (Rodentia, Caviomorpha): Functional and mor-phological analysis. Biol J Linn Soc 78:85-96.
Navarro A and Barton NH (2003) Chromosomal speciation and molecular divergence-accelerated evolution in rearranged chromosomes. Science 300:321-324.
Nevo E (1979) Adaptive convergence and divergence of subterra-nean mammals. Annu Rev Ecol Syst 10:269-308.
Novello A and Altuna C (2002) Cytogenetics and distribution of two new karyomorphs of theCtenomys pearsonicomplex (Rodentia, Octodontidae) from southern Uruguay Mammal Biol 67:188-192.
Ortells MO and Barrantes GE (1994) A study of genetic distances and variability in several species of the genus Ctenomys (Rodentia: Octodontidae) with special reference to a proba-ble role of chromosomes in speciation. Biol J Linn Soc 53:189-208.
Ortells MO, Contreras JR and Reig OA (1990) NewCtenomys karyotypes (Rodentia, Octodontidae) from North-eastern Argentina and from Paraguay confirm the extreme multi-formity of the genus. Genetica 82:189-201.
Parada A, D’Elía G, Bidau CJ and Lessa EP (2011) Species groups and the evolutionary diversification of tuco-tucos, genus Ctenomys (Rodentia: Ctenomyidae). J Mammal 92:671-682.
Paradis E, Strimmer K, Claude J, Jobb G, Open-Rhein R, Dultheil J and Bolker NB (2004) APE: Analyses of Phylogenetics and Evolution in R. Bioinformatics 20:289-290.
Reig OA, Busch C, Ortells MO and Contreras JR (1990) An over-view of evolution, systematics, population and speciation in Ctenomys. In: Nevo and Reig OA (eds) Evolution of Subter-ranean Mammals at the Organismal and Molecular Levels. A.R. Liss, New York, pp 71-96.
Reig OA, Massarini AI, Ortels MO, Barros MA, Tiranti SI and Dyzenchauz FJ (1992) New karyotypes and C-banding pat-terns of the subterranean rodents of the genus Ctenomys (Caviomorpha, Ocotodontidae) from Argentina. Mammalia 56:603-623.
Rieseberg LH and Livingstone K (2003) Evolution-chromosomal speciation in primates. Science 300:267-268.
Ripley BD (1996) Pattern Recognition and Neural Networks. Cambridge University Press, Cambridge, 403 p.
Rohlf FJ and Marcus LF (1993) A revolution in morphometrics. Trends Ecol Evol 8:129-132.
Rohlf FJ and Slice D (1990) Extensions of the Procrustes method for the optimal superimposition of landmarks. Syst Zool 39:40-59.
Rohlf FJ (2004) TPSDig, version 1.40. Department of Ecology and Evolution, State University of New York, Stony Brook. Slamovits CH, Cook JA, Lessa EP and Rossi MS (2001)
Recur-rent amplifications and deletions of satellite DNA accompa-nied chromosomal diversification in South American tuco-tucos (GenusCtenomys, Rodentia: Octodontidae): A phylo-genetic approach. Mol Biol Evol 18:1708-1719.
Tomasco I and Lessa EP (2007) Phylogeography of the tuco-tuco Ctenomys pearsoni: mtDNA variation and its implication for chromosomal differentiation. In: Kelt DA, Lessa EP, Salazar-Bravo JA and Patton JL (eds) The Quintessential Naturalist: Honoring the Life and Legacy of Oliver P. Pearson. University of California Publication in Zoology Series, Berkeley, pp 859-882.
Vassallo AI (1998) Functional morphology, comparative behav-iour, and adaptation in two sympatric subterranean rodents genus Ctenomys (Caviomorpha: Octodontidae). J Zool 244:415-427.
Venables WN and Ripley BD (2002) MASS: Modern Applied Statistics with S. 4th edition. Springer, New York, 495 p. Verzi DH and Olivares AI (2006) Craniomandibular joint in
South American burrowing rodents (Ctenomyidae): Adapta-tions and constraints related to a specialized mandibular po-sition in digging. J Zool 270:488-501.
Vitullo AD, Roldan ERS and Merani MS (1988) On the morphol-ogy of spermatozoa of tucotucos, Ctenomys (Rodentia: Ctenomyidae): New data and its implications for the evolu-tion of the genus. J Zool 215:675-683.
Supplementary material
The following online material is available for this article: Table S1 – Definition of landmarks.
Associate Editor: Loreta B. Freitas