i i
“main” — 2015/12/15 — 16:17 — page 141 — #1
i i
Revista Brasileira de Geof´ısica (2015) 33(1): 141-158 © 2015 Sociedade Brasileira de Geof´ısica ISSN 0102-261X
www.scielo.br/rbg
MORPHOLOGICAL CHARACTERIZATION OF THE POTENGI RIVER
ESTUARINE SYSTEM, NATAL (BRAZIL)
Gustavo Rodrigues da Rocha
1and Helenice Vital
1,2ABSTRACT.This study mapped the Potengi estuary riverbed (Natal-RN), located in northeastern Brazil, using high-resolution geophysics (single beam and side-scan sonar) associated with sediment samples. The imaging of subaqueous features allowed to identify the bedforms and submerged rocky outcrops. Four main groups of bedforms were identified: large 2-D and 3-D dunes, ripples and flat bottom, as well as rocky outcrops. Rocky outcrops were correlated to Barreiras Formation and beachrocks. The estuarine channel is filled mainly by Holocene sandy sediments in the main channel ranging from well-sorted to sorted grains, and silty sediments in the river margins. The integration and analysis of these results contribute to a better understanding of tropical estuaries.
Keywords: high-resolution geophysics, bathymetry, side scan sonar, bed forms.
RESUMO.Este estudo teve como principal objetivo o mapeamento do substrato do estu´ario do Rio Potengi (Natal-RN), localizado no Nordeste do Brasil, utilizando geof´ısica de alta resoluc¸˜ao (dados batim´etricos monofeixe e sonogr´aficos) associada `a amostragem de sedimentos. O imageamento das feic¸˜oes subaqu´aticas permitiu a identificac¸˜ao das formas de leito, bem como de afloramentos rochosos submersos. Foram identificados quatro grupos principais de formas de leito: dunas 2D e 3D de grande porte,ripples e fundo plano, al´em de afloramentos rochosos. Quanto `a composic¸˜ao dos sedimentos holocˆenicos que preenchem o rio, estes s˜ao predominantemente arenosos (canal principal), variando de selecionados a bem selecionados, por vezes siltosos (margens do rio). Os resultados obtidos contribuem para uma melhor compreens˜ao dos estu´arios tropicais.
Palavras-chave: geof´ısica de alta resoluc¸˜ao, batimetria, imageamento sonogr´afico, formas de leito.
1Universidade Federal do Rio Grande do Norte, Laborat´orio de Geologia e Geof´ısica Marinha e Monitoramento Ambiental, 59072-970 Natal, RN, Brazil. – E-mail: g [email protected]
2Universidade Federal do Rio Grande do Norte – UFRN, Programa de P´os-Graduac¸˜ao em Geodinˆamica e Geof´ısica – PPGG, Departamento de Geologia, Campus Universit´ario, P.O. Box 1596, 59072-970 Natal, RN, Brazil. Phone: +55(84) 3215-3916; Fax: +55(84) 3215-3938
i i
“main” — 2015/12/15 — 16:17 — page 142 — #2
i i
142
MORPHOLOGY OF THE POTENGI ESTUARY (NE BRAZIL)INTRODUCTION
Estuaries are found along coastal areas in different parts of the world, regardless of the geological setting, power system and depositional environment (Perillo, 1995). They also represent one of the most dynamic sedimentary environments on Earth, because they are at the interface of marine and terrestrial envi-ronments, having evolved in response to fluvial, coastal (tidal) and sea/marine (waves) interaction processes (Knight & Dun-can, 2005). These environments are sediment collectors par ex-cellence, where the evolutionary processes are very fast and are, therefore, important research areas of the current morphodynam-ics, allowing better understanding of the recent geological history. The high-resolution marine geophysical techniques have al-lowed the detailed map ping of very shallow areas, considerably advancing the knowledge of estuaries. The data acquired with side-scan sonar allow to differentiate the sediments with different acoustic backscatter characteristics, as a function of particle size, density and average reflectivity. This technique is widely used in geological, geotechnical and oceanographic investigation while bathymetric data enable accurate morphology description (e.g., Ayres Neto, 2000; Briggs et al., 2002; Davis et al., 2002; Souza, 2006).
Despite the fact that scan sonar is a well-established and widely used method of underwater research (e.g. Quaresma et al., 2000; Belo, 2002; Lancker et al., 2004; Collier & Brown, 2005), examples of systematic studies in tropical areas are still scarce, particularly in N and NE Brazil.
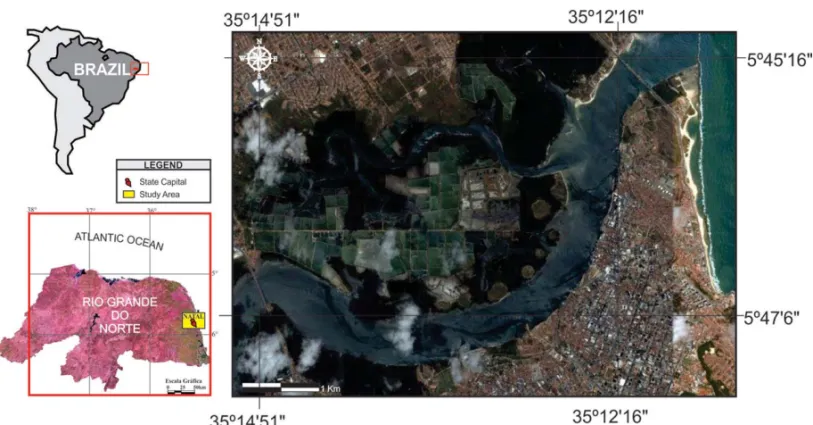
Therefore, this study focuses on the mouth of the Potengi River, a tropical estuary, where the river supply is dominated by seasonal events, unlike many temperate watersheds. This estu-ary is located in the eastern coastal region of Rio Grande do Norte state (Fig. 1), in northeastern Brazil, and home to the main port area of the state, on the right bank of the Potengi River, and the most intense route for passenger and merchant vessels, and tankers from Rio Grande do Norte.
This study characterizes morphologically the Potengi River estuary, through imaging, interpretation and identification of bedforms, and submerged rocky outcrops along the estuary, to better understand the active river, marine and coastal processes in tropical estuaries. Additionally, the results obtained are impor-tant for the development and growth of the Port of Natal exports as the data can be used in the director dredging plan along the main navigation channel to access the Port of Natal.
METHODOLOGY
The data positioning was controlled from a DGPS (Differential Global Positioning System), Hemisphere R220 GPS Receiver
integrated into a V100 Series GPS Compass. The offset to cor-rect the data was calculated. The GPS TrackMaker PRO software was used to navigate the vessel and position the bathymetric and sonographic profiles. Navigation was based on a pre-existing bathymetric chart, 1:25,000 scale (Fraz˜ao, 2003).
The bathymetric data used consisted of 530 cross bathymet-ric profiles, equidistant 10 m, and 6 longitudinal bathymetbathymet-ric profiles to channel axis, of verification and control, acquired us-ing a HYDROTRAC echo sounder model, manufactured by Odom Hydrographic Systems, and operated on the 200 kHz frequency, with 0.01 m vertical beam resolution, allowing a±0.01 m varia-tion. Calibration of the vertical beam echo sounder was performed at the beginning of each operation, accounting for the speed of sound 1543.18 m/s for the region based on the temperature and salinity data measured by the CTD’s (Conductivity, Temperature, Depth) AANDERAA Model 3231 and VALEPORT model 108 MkIII, allowing precision of 0.05◦C for temperature; 0.075 mS/cm for conductivity; and 0.04 psu for salinity. The bathymetric data were acquired in analog and digital format using the ComLog software, v. 2.0.24, Odom Hydrographic Systems. Coordinate data were collected with UTM and geographical projections, both with the datum WGS84.
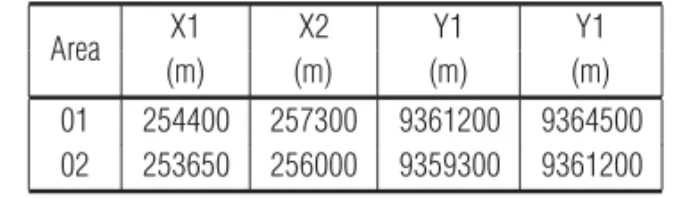
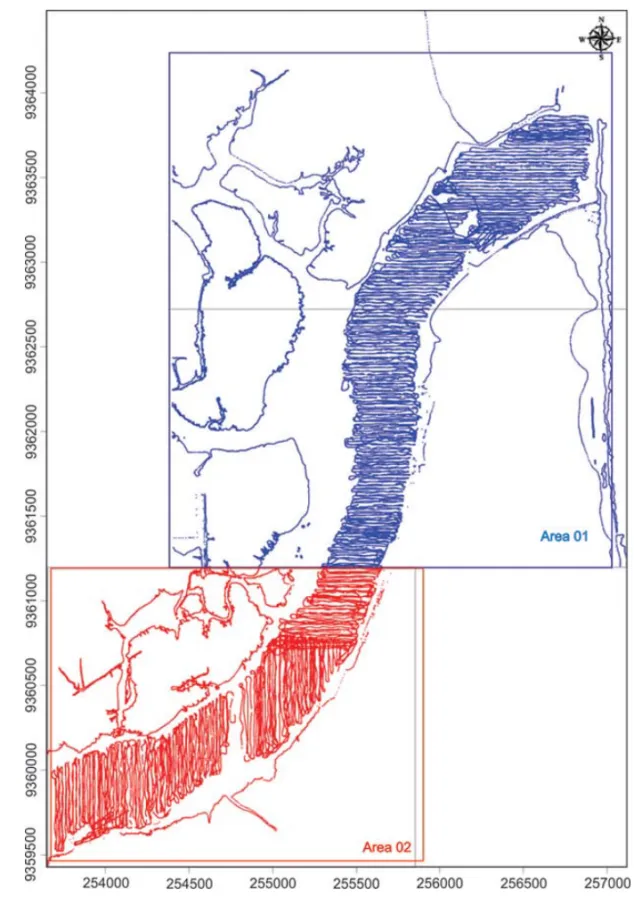
The data were structured in UTM coordinates in the Horizon-tal Datum WGS-84 as XYZ, and depth in meters corrected for the existing tide charts at the tide station of the Captaincy of the Rio Grande do Norte Ports. The data were separated into two areas (Fig. 2) due to differences in the river contour directions, limited according to Table 1. The coordinates of some areas were over-lapped to avoid border effect. Subsequently, the data were pro-cessed using the Surfer 8.0 software.
Table 1 – Limiting coordinates of the modeled areas of the Potengi River.
Area X1 X2 Y1 Y1
(m) (m) (m) (m)
01 254400 257300 9361200 9364500
02 253650 256000 9359300 9361200
The bottom topography of the Potengi River estuary was elaborated in two steps: (1) statistical analysis, to select the best gridding method, and (2) analysis of the differences between the survey spacing and processing lines. The kriging method yielded the best average results and standard deviation and, therefore, the best definition of the estuarine substrate morphology because the good distribution of the bathymetric profiles allowed a good data interpolation (Fig. 2).
The sonographic survey covered the entire study area, total-ing 05 profiles longitudinal to the estuarine channel orientation,
i i
“main” — 2015/12/15 — 16:17 — page 143 — #3
i i
ROCHA GR & VITAL H
143
Figure 1 – Location of the study area (Image: Google, 2010).
each about 5 km long. The equipment used was the Edgetech Model TD-272 (4100), which operates at frequencies of 100 and 500 kHz. The frequency used in this survey was 500 kHz and the scanning range, 50 meters. Samples of surface sediments were collected with a specific Van Veen type dredge for calibration of different textures observed in the sonographic record.
The digitally acquired sonograms were subjected to contrast enhancement and TVG (Time Variable Gain) to amplify the acous-tic signal of the acquired image, using the Discovery 4100 soft-ware. The mosaic of the sonographic data was made using the SonarWiz.MAP5 software, Chesapeake Technology (Fig. 3). The mosaic was developed during the post-processing of the data in-cluding contrast enhancement, TVG and correction of the acous-tic signal incidence angle.
ANALYSIS OF THE POTENGI ESTUARINE SYSTEM Physiographic features
The study site climate is predominantly “As” type, hot and hu-mid, with dry summer and rainy winter, according to the K¨oppen classification (RADAMBRASIL, 1981). It is under the influence of the Intertropical Convergence Zone (ITCZ), responsible for the trade winds from the northern and southern hemispheres (Nimer, 1972). Thus, the air temperature in the region, remains high throughout the year. Nevertheless, it presents a slight vari-ation with minimum temperatures between 23 and 25◦C and
maximum between 27 and 29◦C, reaching a peak of 32◦C (the hottest months), and an average of 26◦C.
The vegetation in the area is predominantly the sandbank type, which covers the dunes, and the mangrove vegetation, both in advanced stages of anthropogenic degradation. The oldest dunes are partially or fully covered by sparse and undergrowth herbaceous vegetation. The Coastal Plateau, distributed on the flattened surfaces of the Tertiary sediments, consists of two strata, shrub and herbaceous.
The Potengi River Basin drains an area of approximately 4,093 km2corresponding to 7.7% of the area of Rio Grande do Norte, with contribution from the streams: Quintas creek, with total length less than 500 m, and Baldo creek that drains an area of approximately 4.7 km2, among others. The Potengi River Basin has an average flow of 2.1 m3/s (SERHID, 2000). This dis-charge is heavily dependent on rainfall and consequently has a large seasonal and annual variability. The Potengi basin covers three mesoregions of Rio Grande do Norte state. The tributaries that form its main river are situated in a typical backwoods zone; therefore, some are temporary. The formed river runs through the rugged zone (still “semi-arid”, transition), to reach the coastal area, where it joins the Jundia´ı and Doce rivers, forming the estu-ary, and flowing into the Atlantic Ocean.
The tides that occur in the Potengi estuary and surrounding areas are semi-diurnal (two high tides and two low tides dur-ing a lunar day, with tidal period of 12 hours and 25 min). The
i i
“main” — 2015/12/15 — 16:17 — page 144 — #4
i i
144
MORPHOLOGY OF THE POTENGI ESTUARY (NE BRAZIL)Figure 2 – Map of sampling points and the position of the modeled sub-areas of the Potengi River.
average tides are∼2.30 m and ∼0.85 m respectivelly to spring and neap tides, with a maximum tidal range of about 2.83 m, classified as mesotide according to Davis (1977). The maximum speeds were higher during the spring tide. According to Fraz˜ao (2003), the comparison of the average speeds currents with the tidal range values measured in the Potengi estuary, during the
spring tides, shows that the current speed is greater during the flood than the ebb tide. The maximum values reached in the flood tide are 1.08 m/s.
The average of the significant wave height is 80 cm with a 13 s period (Fraz˜ao, 2003). According to the Weather Station of UFRN – Natal, the most frequent winds are predominantly from East,
i i
“main” — 2015/12/15 — 16:17 — page 145 — #5
i i
ROCHA GR & VITAL H
145
Figure 3 – Sonographic mosaic along the estuarine system of the Potengi River. Some parts are shown in detail for best viewing.
often east-southeast, with monthly average speeds of about 4 and 4.5 m/s. Despite strong tidal currents, the waves generated by the winds mix the waters causing an almost constant resuspen-sion of bottom sediments on the banks and shores.
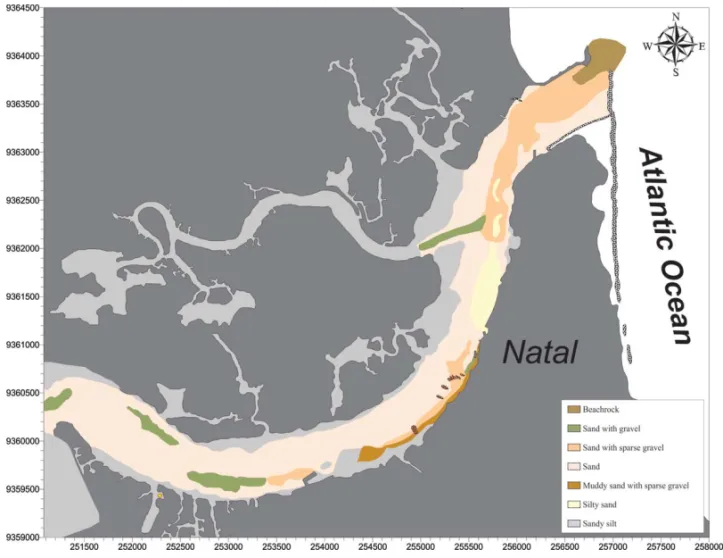
Facies and sediment influx
The dominant facies sediment, composed of sand and sand with sparse gravel covers most of the study area (Fig. 4). The Holocene sediments that fill the estuarine channel are predominantly sandy, ranging from selected to well selected, and sometimes silty. The sedimentation is controlled by the hydrodynamic conditions of the environment, with two important textural facies recognized: muddy and sandy. The distribution of these textural facies fluctu-ates depending on the frequency and intensity of tidal currents.
The bottom transport distribution throughout the year is quite irregular, with supply/influx concentrated entirely in the first half when the flows are more important. In the second half, the in-fluxes to the beach are very small with decreasing flow presenting negative values from August to September, which results in zero sediment balance, and even negative in low precipitation years when the estuary acts as a sediment trap. Cunha (2004) estimated potential rates of material transported by drag bottom over a year of great flow (e.g., 1000 m3/s), showing that this estuary could
contribute to longshore drift with up to 18,661 m3/day of sedi-ment, with equivalent size to the sandy material present on the beach. However, for the current situation, the low sediment in-flux and the amount of sandy material transported by the bottom cannot be considered significant to the morphological changes.
Geology
Geologically the study area is inserted in the Natal sub-basin context, part of the Pernambuco-Para´ıba-Rio Grande do Norte coastal basin, of Cretaceous age (Mabesoone, 1996). Accord-ing to C´ordoba et al. (2007), the stratigraphy of the area groups Cenozoic sedimentary rocks superimposed on Cretaceous rocks, which in turn rests unconformably on Precambrian rocks of the crystalline basement. A tertiary-quaternary sequence (Barreiras) and Quaternary sediments (fixed and mobile dunes, alluvial, flu-vial terraces, eachrocks and mangroves) are found in this area.
Architectural elements and tectonics
The estuary is relatively shallow, rarely exceeding 30 m in depth, with a V-shape cross section. Although dependent on the type of rock present in the valley where the river was formed, the width/depth ratio is generally high. A typical physiographic do-main characterizes the Potengi estuary, the strict sense estuary or
i i
“main” — 2015/12/15 — 16:17 — page 146 — #6
i i
146
MORPHOLOGY OF THE POTENGI ESTUARY (NE BRAZIL)Figure 4 – Facies map generated from integrated sonographic and sediment data (Fraz˜ao, 2003), according to the classification of Folk (1974).
estuarine valley, marked by complex interactions between fluvial and marine processes.
The deeper zones are close to the concave banks of the es-tuary while, in the convex banks, the advanced sediment filling contributes to the lateral growth, towards the estuarine channel. The filling of the channel is related to intense tidal currents, which re-mobilize sediments eroded from the opposite banks to form sandy banks. These sandy banks are usually capped by fine sedi-ments, resulting in the extensive flat surface, which emerges in the low tides. These features occur in the meanders near the mouth of the Potengi estuary; the stronger flow on the outer curve cause the margin to erode while some of the sediment is deposited on the inner bend forming a point bar.
The eastern coast of Rio Grande do Norte is marked by a series of NE to ENE structural valleys, which are controlled by graben type features that trap the sandy-clay sediments of the Barreiras Formation (Miocene-Pleistocene) on their floor capped by aluvial sands and other recent deposits (Bezerra et al., 1998). Bezerra et al. (2001), based on wells and geophysical data, con-cluded that the Potengi River estuary basin has a half-graben shape; extending over at least 20 km from the coast to Maca´ıba,
limited by the Jundia´ı fault with preferred 60◦(NE) trend, located on the right bank of the Potengi River (Fig. 5).
RESULTS AND DISCUSSIONS Bathymetric mapping
The processing and analysis of bathymetric data are presented in a bathymetric map (Fig. 6A). Two block diagrams are also pre-sented (Figs. 6B and 6C) to show the morphology of the Potengi riverbed to better visualize and interpret its main features in 3-D. The following interpretations were obtained from these products, together with data observed in the field.
The deeper zones are close to the concave/outer banks of the estuary while the advanced sediment filling in the convex/inner banks contributes to the lateral growth, towards the estuarine channel.
This sediment filling is related to intense tidal currents in the area of the main channel, which re-mobilize eroded sediments on opposite banks to form the sandy banks. These sand banks are usually covered by fine sediments, resulting in an extensive flat surface that emerges during the low tides. These features occur
i i
“main” — 2015/12/15 — 16:17 — page 147 — #7
i i
ROCHA GR & VITAL H
147
Figure 5 – Geological map of the coastal plain surrounding the estuarine system of the Potengi River. Modified from Bezerra et al. (2001).
in the meanders near the mouth of the Potengi estuary, where the flood plain develops colonized by mangroves and grasses. In the outer curve of the meanders, the stronger flow causes the margins to erode while, in the inner bend, the sediments deposit forming a point bar.
Secondary channels, considerably small compared to the principal, are also found and appear to occur as a response to the tidal currents, forming small longitudinal banks and conju-gated channels (Fig. 6 – Profile 1). This fact is confirmed by the V-shaped profile (Fig. 6 – Profile 2) and their association with the small channels perpendicular to the main river course (locally referred to as “gamboas”).
Along the estuary, the morphological behavior changes char-acterizing distinct zones as previously shown in lower detail map-ping by Fraz˜ao (2003). The depth, width and shape of the chan-nels show different action levels of the dynamic mechanisms of the environment.
In this study, the bottom morphology of the estuary was di-vided into two distinct morphological areas regarding its main features: Main Channel Zone and Estuary High Bottom.
Main Channel Zone
The main channel is on average 170 meters wide and between 8 and 10 meters deep, clearly constituting itself in the continu-ation of the thalweg that follows the margin of the Potengi River (Fig. 6 – Profile 3). Small depressions, between 9 and 11 me-ters deep, mark the channel bottom (Fig. 7). These depressions continuously follow the axis of the channel, at a distance that progressively decreases towards its mouth, probably due to the interference current zones of turbulent regime.
A wide valley, bordered by steep slopes along the banks, can be seen near the mouth, where the marine influence is more pronounced and on the sandy bank located in front of the Natal Naval Base. Towards the interior of the estuary, the region of the main navigation channel narrows and becomes more stable, in response to both increased sediment yield from Jundia´ı and the Potengi Rivers and lower influence of tidal currents.
Estuary High Bottom
This zone borders the entire margin of the Potengi River, and can be defined from the isobaths smaller than 4 m. Thus, the high bottoms along the estuary are characterized by sandy banks and muddy plains (Fig. 6 – Profile 4). Four major banks stand out in this area. The first bank is on the right margin near the mouth of the Potengi River, called Banco das Velhas (Fig. 7), approximately 526 m long and 180 m wide, with a gentle slope towards the main navigation channel.
Near the mouth of the Potengi River, on the right bank, sed-iments deposition forms a sandy bank near the ridge of the 17th G.A.C.
The block diagram (Fig. 7) shows the 17th G.A.C. bank in 3-D, apparently resulting from the approximately 120 m long spike/ridge, manmade to contain the erosion along the bank. This spike causes the sediment to accumulate due to eddy/vortex forcings, forming the 17th G.A.C. bank. The analysis of the cur-rents direction and intensity data, measured by Fraz˜ao (2003) in 2002, shows that the vortex generated by the spike forms a de-pression causing the ocean sediments remobilized to the Redinha beach to migrate toward the main channel. This vortex creates
i i
“main” — 2015/12/15 — 16:17 — page 148 — #8
i i
148
MORPHOLOGY OF THE POTENGI ESTUARY (NE BRAZIL)Figure 6 – Bathymetry of the Potengi estuary. (A) Bathymetric map of the Potengi estuary, with shaded effect. The block diagrams show details
of the estuary mouth (B) and Baldo Channel region (C), and can be best viewed in Figures 7, 9 and 10. The profiles (P1 to P4) are highlighted to show the V-shaped channel (P1) and sandy banks (P2) longitudinal to the Main Channel Zone (P3) and Estuary High Bottom (P4).
i i
“main” — 2015/12/15 — 16:17 — page 149 — #9
i i
ROCHA GR & VITAL H
149
Figure 7 – Block diagram showing details of the estuary mouth.
a depression of approximately 15 meters. Previous studies per-formed by this author about the currents in this region allow to conclude that this depression was excavated by the intense tidal currents, especially ebb, that generate a turbulent flow when they find the manmade seawall (Fig. 8). The emergence of this turbu-lent flow depends on the current speed, water density and size of the obstacle. The clockwise circular movements of the turbulent flow (Fig. 8) excavates the depression due to increasing pressure on seawall from the back and at the same time, the dramatic re-duction in pressure drag, favoring remobilization and deposition of the sandy material around the depression.
The Jaguaribe Bank (Fig. 9) lies on the left bank of the estu-ary at the confluence of Gamboa Jaguaribe with the Potengi River, opposite the Port of Natal. It is about 800 m long and 300 m wide. It is possible to observe the bank migration toward the main channel, reducing the width of the main navigation channel to 100 m wide in this region.
From the Baldo Channel (detail in the lower block diagram of Fig. 6), waste is thrown into the river Potengi. The waste ac-cumulates at this channel output, causing the silting of the main navigation channel. On the left bank, across the channel, natu-ral sedimentation occurs, which is the continuation of the Navy Base, named as Base bank by Fraz˜ao (2003). Thus, the intense contribution of solid material from the sewage waste of the city of Natal and siltation caused by the urbanization of the Passo da P´atria community, located on the right bank, associated with
natural sedimentation on the left bank, tends to silt and fill the area of the main channel, as shown in Figure 6.
The last and largest bank observed is on the left margin of the estuary located opposite the Base bank (Fraz˜ao, 2003) (Fig. 10). It is approximately 2 km long and 350 m wide, with semicircular shape, located on the meandering segment of the estuary. The bank probably results from the decreased energy of tidal currents. Sieve analysis indicates that it is capped by sandy sediments.
Mapping of the bedforms and rocky outcrops of the Potengi estuarine system
The integration of bathymetric and sonographic data allowed to identify bedforms of various types and scales on different types of bottom, and the presence of rocky outcrops.
The bedforms result from the interaction between either wind or water and the sediment substrate. The sediments begin to move when the natural resistance to movement is overcome, thus en-abling formation of the first bottom structures. Thus, the devel-opment of bedforms is related to three main parameters: particle size of the sedimentary material, flow depth and speed, where the extension and bottom characteristics result from the existing bal-ance between the erosion and deposition on different parts of the riverbed (Della F´avera, 2001). According to Ashley (1990), large bedforms are generated in recent sandy environments deeper
i i
“main” — 2015/12/15 — 16:17 — page 150 — #10
i i
150
MORPHOLOGY OF THE POTENGI ESTUARY (NE BRAZIL)Figure 8 – The manmade seawall causing a turbulent flow during ebb tide, responsible for the accumulation of sediments in the submerged part
of the 17th G.A.C. bank (Photo: H. Vital).
i i
“main” — 2015/12/15 — 16:17 — page 151 — #11
i i
ROCHA GR & VITAL H
151
Figure 10 – Block diagram showing Base bank.
Figure 11 – Plot of mean flow velocity against median sediment size showing stability fields of bed phases. Fr= mean
velocity Froude number (modified from Ashley, 1990 by Rocha, 2009).
than 1 m, with particle size greater than 0.15 mm (very fine sand) and average current speed greater than 0.4 m/sec (Fig. 11).
The bedforms in this study are classified according to Ashley
(1990), including the revisions of Dalrymple & Rhodes (1995) based on morphology. According to this classification, all large transversal bedforms (excluding ripples and anti-dunes) occupy
i i
“main” — 2015/12/15 — 16:17 — page 152 — #12
i i
152
MORPHOLOGY OF THE POTENGI ESTUARY (NE BRAZIL)a similar position as a result of the lower flow rate, which is later modified by other data such as particle size, shape and overlap. The wide variety of bedforms reflects the different hydrodynamic conditions and type of sediment.
The flow regimes can be classified as upper or lower, accord-ing the Froude number calculated for each bedform. The flat lay-ers, ripples and dune fields are formed in the lower flow regime. When the flow velocity increases, so that the Froude number is greater than 1, the macro-undulations (dunes) disappear, and the surface becomes flat again. When the speed is greater than that necessary to form a flat bed with the material moving, the so-called anti-dunes are formed.
Identification of bedforms in the Potengi River estuary
The dominant sediment facies, composed of sand and sand with sparse gravel covers most of the study area. In general, the Potengi estuary bed is characterized by small to large dunes with 2.87-95.12 m wavelength ratio, up to 4.3 m tall high, with varying sinuosity and overlapping.
The ripples and dunes bedforms, both lower flow regime based on a series of 40 bedforms, with lengths >1 m and <100 m, were differentiated by applying the log-log diagram of height (H) versus wavelength (L), proposed by Flemming (1988) (Fig. 12). The data covered very shallow waters, from 3 m up to 16 m, with bidirectional flow. Figure 9 shows that along the estuarine channel of the Potengi River, smaller bedforms were identified as dunes with small wavelength.
The sonographic survey showed that most of the dunes have strong asymmetries, indicative of the dominance of the flood and ebb tidal currents. The asymmetry of the bedforms along the es-tuarine channel is a strong indicator of marine influence in the estuary, becoming the main component controlling the sedimen-tation of these environments dominated by the tides.
The sonographic survey also showed abrupt changes of the morphology of the bedforms in the Potengi estuary; account-ing for the dunes wavelength and height, which ranges from small distances to a few meters, and their sinuosity. Figure 13 clearly shows morphological changes of the bedform revealing dunes with small, medium and large wavelengths, and flat bottom.
Figure 12 – Flemming diagram (1988) showing the log-log of height (H) versus length (L) for 40 subaqueous bedforms,
i i
“main” — 2015/12/15 — 16:17 — page 153 — #13
i i
ROCHA GR & VITAL H
153
Figure 13 – Sonogram along the Potengi River estuary showing the abrupt change of bedforms. The detail shows the site described in the sonogram.
Figure 14 – Sonogram acquired in the 500 kHz frequency, with 100 m range, showing darker and lighter shades representing compressed muddy sediments and sandy
sediments, respectively.
Changes in the morphology of the bedforms are related to changes in bathymetry. In the main channel zone, dunes wavelength and height varied mainly from medium to large and displayed other simple and composite overlay features.
The sonogram also shows a significant change with respect to the types of sediment, where the darker and lighter shades rep-resent the compressed muddy sediments and the finest sandy sediments, respectively (Fig. 14).
Subaqueous dune fields
According to Ashley (1990) large-scale bedforms are called “dunes”, fall into two groups: two-dimensional (2-D) that occur at lower current speeds, and three-dimensional (3-D) with higher current speeds for a certain grain size (Middleton & Southard, 1986) (Fig. 15).
2-Dimensional (2-D), 3-Dimensional (3-D) and Superposed bedforms
The 2-Dimensional dunes (2-D), with size ranging from small to medium, were viewed in much of the area (Fig. 12). The ridges were destroyed in the region near the river mouth where the estu-ary is significantly influenced by tidal currents. When approach-ing the mouth, the 2-D dunes are generally superposed by 3-D dunes (Fig. 16). In this region, the dunes are large, with wave-length ranging from 65 to 90 meters and 2 to 2.8 meters height. It is sometimes difficult to distinguish the 2-D from the 3-D dunes. In some portions of the estuary superposed dune fields were observed, indicating the deposition of sediments due to the action of currents in two directions, perpendicular to each other, defining a compound interference pattern (Fig. 16C).
i i
“main” — 2015/12/15 — 16:17 — page 154 — #14
i i
154
MORPHOLOGY OF THE POTENGI ESTUARY (NE BRAZIL)Figure 15 – Block diagrams showing the two groups of bedforms: 2-D (A) and 3-D (B), modified from Della F´avera (2001).
Figure 16 – Subaqueous dunes in the Potengi estuary. (A) 2-D dune field with superposed 3-D dunes; (B) 3-D dunes and a small 2-D dune field in the central
i i
“main” — 2015/12/15 — 16:17 — page 155 — #15
i i
ROCHA GR & VITAL H
155
Figure 17 – Flat bed in the estuary of the Potengi River. (A) Flat bottom in the sandy region, highlighting particularly small depressions usually
generated by eddies; (B) flat bottom in a region with predominantly silty sediments. Sonogram sites are marked on the map (A and B).
consisting of fine sandy sediments, probably deposited in low flow velocities, or quite cohesive mud. However, in some parts of the main channel, bedforms are absent, probably because the changing currents do not allow preserving the bottom features. An extensive area with this relatively flat pattern was observed in the Baldo Channel region, characterized by fine sediments, typi-cal of silting of the main navigation channel by solid waste par-ticles thrown into the Potengi River. In these flatter regions, spe-cific depressions caused probably by eddies were also identified (Fig. 17). Ripples superposing 2-D and 3-D medium dunes have been identified along the profiles (Fig. 18).
Rocky outcrops
Rocky outcrops of great expression have been identified in both the bathymetric (Fig. 6) and sonographic (Fig. 18) records and characterized as sandstones of the Barreiras Formation. The out-crop recorded on the right bank of the Potengi River, near the Baldo Channel (bottom Block Diagram of Fig. 6 and Fig. 18A), is called “Oitizeiro stone” in the nautical chart No. 802 (Marinha do Brasil). Next to the Natal Yacht Club, a large outcrop of approximately 5 meters high in relation to the bed was ob-served. Other studies (e.g. Vital et al., 2006; Rocha, 2012), using high-resolution seismic profiling (chirp) records and sampling,
reported that the Barreiras Formation constitutes the acoustic basement, and has considerable control in sediments deposition, forming valleys filled by Quaternary sediments.
Smaller outcrops at the mouth of the estuary, with acoustic signature typical of beachrocks were sampled and identified as such during dredging conducted by the Companhia das Docas do Rio Grande do Norte-CODERN in 2010.
CONCLUSIONS
The integration of bathymetric and sonographic data acquired in this study, associated with sediment sampling, enabled to detail the estuarine substrate of the Potengi River, allowing to visual-ize the distribution of the bedforms and rocky outcrops. Factors such as changing in sediment type, substrate roughness, depth and grain size of the sediment, are responsible for the textural and morphological variations observed in the sonograms.
The sandy sediments are predominant, as already reported by Fraz˜ao (2003). The main sedimentary facies is the sandy fa-cies while the deeper areas of the estuarine channel are capped by coarser sediments, typically pebbles and sand with gravel, along with calcareous shell fragments and shallower areas cov-ered with fine sediments.
i i
“main” — 2015/12/15 — 16:17 — page 156 — #16
i i
156
MORPHOLOGY OF THE POTENGI ESTUARY (NE BRAZIL)Figure 18 – Rocky outcrops characterized as sandstones of the Barreiras Formation (A, B and C), showing the outcrops shade and
i i
“main” — 2015/12/15 — 16:17 — page 157 — #17
i i
ROCHA GR & VITAL H
157
wavelengths between 2 and 3 m, followed by dunes with mediumwavelength of approximately 6 m and between 0.4 and 1.6 m height, and dunes with large wavelengths ranging from 65 to 90 m, and 2 to 2.8 m height. In the zone of the main channel, medium to large dunes, relative to wavelength and height, were mainly observed, presenting others simple and composite super-posed bedforms.
Bedforms depend on grain size of the sediments, flow depth and hydrodynamic conditions. The strong intensities of the flood tidal currents cause the sediments to be redistributed into the Potengi estuary. These currents are partly responsible for the for-mation of great bedforms at the mouth of the estuary, where the dominant sedimentary facies is sandy. The deeper zones are ob-served along the concave banks of the estuary while an advanced sedimentary fill contributes to the lateral growth in the convex margins, towards the estuarine channel. In short, the margins are eroding in the concave bend of the meanders while point bar deposits are formed in the convex bend of the meanders. These point bars near de meanders have a flat surface covered by fine sediment.
The wide variety of bedforms found reflects the different hy-drodynamic conditions and sediment type. Most dunes recorded by side scan sonar revealed strong asymmetries that are in-dicative of the dominance of the flood and ebb tidal currents. The asymmetry of the bedforms along the estuarine channel is a strong indicator of marine influence in the estuary, the main drive force in these environments dominated by the tides.
The side scan sonar survey revealed some abrupt changes in the morphology of bedforms over a small area, in addi-tion to dunes sinuosity. These changes are related to changing bathymetry.
Large submerged rock outcrops were observed and char-acterized as sandstones from the Barreiras Formation. Smaller rocky outcrop rocks were related to beachrocks.
The combination of the vertical beam echo sounder with the side-scan sonar plays an important role in interpreting the acous-tic signature of the dune type bedforms and determining the boundaries of the major textural facies. The integration of these two types of sensors is also a key tool to assist the dredging of the main navigation channel to access the Port of Natal.
ACKNOWLEDGEMENTS
Thanks are due to the Universidade Federal do Rio Grande do Norte (UFRN), the post-graduate program in Geodynamics and Geophysics and the Laboratory of Geology, Geophysics and
Environmental Monitoring for providing the necessary infrastruc-ture. Thanks are also due to CAPES for granting master’s scholar-ship and financial resources to the first author, via the Ciˆencias do Mar project 207-2010 (CAPES/CGPE/IIC), to CNPq for the financial resources via PQ-CNPq no. 303481/09-9 – Project of the Geological and Geophysical characterization of the sub-merged areas of Rio Grande do Norte; and technicians and stu-dents for helping collect the field data. UFRN is a participating institution of the Marine Geology and Geophysics Program.
REFERENCES
ASHLEY G. 1990. Classification of large-scale subaqueous bedforms a new look at an old problem. Journal of Sedimentary Petrology, 60: 160– 172.
AYRES NETO A. 2000. Uso da S´ısmica de Reflex˜ao de Alta Resoluc¸˜ao e da Sonografia na Explorac¸˜ao Mineral Submarina. Brazilian Journal of Geophysics, 18(3): 241–255.
BELO WC. 2002. O fundo marinho da ba´ıa da Ilha Grande, RJ: evidˆencias da ac¸˜ao de correntes e de ondas no canal central com base em formas de fundo observadas em registro de sonar (100 kHz). Brazilian Journal of Geophysics, 20(1): 17–30.
BEZERRA FHR, LIMA-FILHO FP, AMARAL RF, CALDAS LHO & COSTA NETO LX. 1998. Holocene coastal tectonics in NE Brazil. In: STEWART IS & VITA-FINZI C. Coastal Tectonics. Geological Society, London, Special Publications, 146: 279–293.
BEZERRA FHR, AMARO VE, FINZI CV & SAADI A. 2001. Pliocene-Quaternary fault control of sedimentation and coastal plain morphology in NE Brazil. J. South Am. Earth Sci., 14: 61–75.
BRIGGS KB, WILLIAMS KL, JACKSON DR, JONES CD, IVAKIN AN & ORSI TH. 2002. Fine-scale sedimentary structure: implications for acoustic remote sensing. Mar. Geol., 182: 141–159.
COLLIER JS & BROWN CJ. 2005. Correlation of sidescan backscatter with grain size distribution of surficial seabed sediments. Mar. Geol., 214(4): 431–449.
C ´ORDOBA VC, JARDIM DE S´A EF, SOUSA DC & ANTUNES AF. 2007. Bacia de Pernambuco-Para´ıba. Boletim de Geociˆencias da Petro-bras, 15(2): 391–403.
CUNHA EMS. 2004. Evoluc¸˜ao atual do Litoral de Natal – RN (Brasil) e suas aplicac¸˜oes a Gest˜ao Integrada. Doctorate thesis. Programa de Doc-torado de Ciencias del Mar, Universitat de Barcelona, Spain. 128 pp. DALRYMPLE RW & RHODES RN. 1995. Estuarine dunes and bars. In: PERILLO GME (Ed.). Geomorphology and Sedimentology of Estuaries. Elsevier, Amsterdam, 359-422 pp.
DAVIS JL. 1977. Geographical Variation in Coastal Development. Long-man, N.Y., 204 pp.
i i
“main” — 2015/12/15 — 16:17 — page 158 — #18
i i
158
MORPHOLOGY OF THE POTENGI ESTUARY (NE BRAZIL)DAVIS A, HAYNES R, BENNELL J & HUWS D. 2002. Surficial seabed sediment properties derived from seismic profiler responses. Mar. Geol., 182: 209–223.
DELLA F´AVERA JC. 2001. Fundamentos de Estratigrafia Moderna. Ed-itora Universidade do Estado do Rio de Janeiro, Rio de Janeiro, Brazil, 263 pp.
FLEMMING BW 1988. Zur Klassifikation Subaquatischer, Str¨omungs-transversaler Transportk¨orper. Bochumer geol. u. geotechn. Arb., 29: 44–47.
FOLK RL. 1974. Petrology of Sedimentary Rocks. Austin, Hemphill publishing Co.: 182 pp.
FRAZ˜AO EP. 2003. Caracterizac¸˜ao Hidrodinˆamica e Morfo-sedimentar do Estu´ario Potengi e ´areas adjacentes: subs´ıdio para controle e recu-perac¸˜ao ambiental no caso de derrames de hidrocarbonetos. Master dissertation. Programa de P´os-graduac¸˜ao em Geodinˆamica e Geof´ısica. Universidade Federal do Rio Grande do Norte, Brazil, 145 pp. KNIGHT J & DUNCAN MF. 2005. Towards an Understanding of the mophodynamics and sedimentary evolution of estuaries. In: FITZGER-ALD DM & KNIGHT J (Eds.). High Resolution Morphodynamics and Sedimentary Evolution of Estuaries. Springer, pp. 1–9.
LANCKER VJ, LANCKNEUS S, HEARN P, HOEKSTRA F, LEVOY J, MILES G, MOERKERKE O, MONFORT & WHITEHOUSE R. 2004. Coastal and nearshore morphology, bedforms and sediment transport pathways at Teignmouth (UK). Cont. Shelf Res., 24: 1171–1202.
MABESOONE JM. 1996. Bacia Sedimentar Costeira Pernambuco-Para´ı-ba-Rio Grande do Norte. In: Simp´osio sobre o Cret´aceo do Brasil, 4., Rio Claro, S˜ao Paulo, Brazil: UNESP. pp. 81–84.
MIDDLETON GV & SOUTHARD JB. 1986. Mechanics of sediment move-ment. 2nd ed., SEPM Short Course, n. 3, 246 pp.
NIMER E. 1972. Climatologia da Regi˜ao Nordeste do Brasil. Rev. Bras. Geogr., 34(2): 3–51.
PERILLO GME. 1995. Geomorphology and Sedimentology of estuaries. Development in Sedimentology 53, Elsevier, Amsterdam. 471 pp. QUARESMA VS, DIAS GTM & BAPTISTA NETO JA. 2000. Caracterizac¸˜ao da ocorrˆencia de padr˜oes de sonar de varredura lateral e s´ısmica de alta freq¨uˆencia (3,5 e 7,0 kHz) na porc¸˜ao sul da Ba´ıa de Guanabara – RJ. Brazilian Journal of Geophysics, 18(2): 201–214.
RADAMBRASIL. 1981. S´erie Levantamento de Recursos Naturais do PROJETO RADAMBRASIL, 1981.
ROCHA AKR. 2009. Caracterizac¸˜ao Morfol´ogica e Sedimentol´ogica da Foz do estu´ario do rio Ac¸u, Macau-RN. Relat´orio de Graduac¸˜ao. Departa-mento de Geologia, Universidade Federal do Rio Grande do Norte, Brazil, 72 pp.
ROCHA GR. 2012. Caracterizac¸˜ao Sonogr´afica e Sismoestratigr´afica de Alta Resoluc¸˜ao do Estu´ario do Rio Potengi, Natal – RN. Master disserta-tion. Programa de P´os-Graduac¸˜ao em Geodinˆamica e Geof´ısica. Univer-sidade Federal do Rio Grande do Norte, Brazil, 46 pp.
SERHID – SECRETARIA DE RECURSOS H´IDRICOS DO ESTADO DO RIO GRANDE DO NORTE. 2000. Plano Estadual de Recursos H´ıdricos. Natal, Rio Grande do Norte, Brazil.
SOUZA LAP. 2006. Revis˜ao cr´ıtica da aplicabilidade dos m´etodos geof´ısicos na investigac¸˜ao de ´areas submersas rasas. Doctorate thesis. Instituto Oceanogr´afico, Universidade de S˜ao Paulo, S˜ao Paulo, Brazil, 284 pp.
VITAL H, FRAZ˜AO EP & TABOSA WF. 2006. Estudo de Geologia e Geo-f´ısica Marinha no Estu´ario do rio Potengi entre a Base Naval e sua foz, para a Companhia Docas do Rio Grande do Norte – CODERN. Subs´ıdios para o plano diretor de dragagem do canal de acesso ao Porto de Na-tal com dados hidroac´usticos. Final Technical Report, 83 pp. + attach-ments.
Recebido em 9 agosto, 2012 / Aceito em 27 fevereiro, 2015 Received on August 9, 2012 / Accepted on February 27, 2015
NOTES ABOUT THE AUTHORS
Gustavo Rodrigues da Rocha. Geologist (2009) graduated from the UFRN, Master in Geology and Geophysics from the Geodynamics and Geophysics
Program, UFRN; where worked in the areas of marine geology and geophysics, and environmental monitoring. Currently, works as Wellsite Geologist at the CWA Weatherford – consultants and Oil Services, with E&P of offshore/onshore wells and slim hole drilling.
Helenice Vital. Geologist from the UFRN (1986), holds a Master of Marine and Environmental Geology from the UFPA (1988) and Ph.D. in Marine Geology and
Geophysics from the University of Kiel Christian Albrechts, Germany (1996). Full Professor of the Universidade Federal do Rio Grande do Norte, developing educational, research and extension projects in the field of Marine Geology and Geophysics and Environmental Monitoring. CNPq Researcher.