ISSN 2067–3604, Vol. III, No. 1 / 2011 67
IMPROVING THE INFORMATION FLOW INTERNAL AND EXTERNAL
TRACEABILITY IN A SLAUGHTERHOUSE
Maria Isabel Pedro
1, Hugo Dias
2, José António Filipe
3& Manuel Alberto M. Ferreira
41CEGIST – Instituto Superior Técnico – Universidade Técnica de Lisboa, Av. Rovisco Pais, 1049 001 Lisboa Portugal,
[email protected], 2Instituto Superior Técnico – Universidade Técnica de Lisboa, Av. Rovisco Pais, 1049 001 Lisboa
Portugal, [email protected], 3UNIDE-IUL/ISCTE-Instituto Universitário de Lisboa, Av. das Forças Armadas,
1649 026 Lisboa, Portugal, [email protected], 4UNIDE-IUL/ISCTE-Instituto Universitário de Lisboa, Av. das Forças,
Armadas, 1649 026 Lisboa, Portugal, [email protected]
Corresponding Author: Manuel Alberto M. Ferreira, [email protected]
Abstract: Several global aspects are affecting the world's
food supply chain. In this study a slaughterhouse was used as a "laboratory" to get conclusions that can be applied to all the meat industry and in other automated industries. The aim is to provide tools to solve this gap. The global standards for traceability are now beginning to evolve in the market place, and as a result, early adopters and standard setters will take a lead role and the advantages that come from it. The focus is to describe relevant references that help to support the approaches and to support the recommendations, with the tools for a suitable decision analysis. This analysis considers the RFID identification of each unique "Christmas-tree", and the Physical Marking of the "Christmas-trees" as the most relevant approaches in the long term. The Bar-code identification before shipping is also a pertinent approach, especially in the short term.
Key words: traceability, christmas-tree (X-tree),
information flow, identification technologies.
1.INTRODUCTION
Food safety has become increasingly more important in the last years, especially after some diseases have passed from the animal meat to the final consumer. In order to avoid future contagious, traceability systems have been deeply developed in every market as a part of the control system for keeping food safety.
Governments of the developed countries have been forced by consumer demand to adopt comprehensive and integrated food safety policies. Traceability systems are now being developed all around the world. Rather than just identifying a more generalized commodity group, an effective and cost efficient traceability system has been designed and many manufacturing systems, including food manufacturing, have required registration to the ISO 9001 Quality Standards. This means that the product should be able to be traced from the current stage back through all its stages of manufacture through accurate and timely record keeping.
Industry, consumers and governments can be pointed as the main interested parts when talking about food safety and traceability. In the meat industry, meat and meat products must not represent a risk for the consumer's health and it must be possible to fulfil the requirements from the markets and authorities. In January 2005, the EU introduced the General Food Law Regulation (178/2002) which states that manufacturers must be able to take up a product, if required.
The traceability of products is based on the ability to identify them uniquely at any point in the supply chain. Throughout the food chain, new identities are constantly created because of the different processes, like cutting and splitting. Traceability requires that the batch can be identified and that this identification gives a link to the product history.
Products and processes may form key components in a traceability system with information stored in relation to each, but this information will not be complete without the commitment of the whole supply chain.
Traceability has a cost. However, costs of not having it or having inefficient systems in place may be severe for all, governments, consumers, individual companies and food industry as a whole.
2. SUPPLY CHAIN MANAGEMENT
Food supply chains have changed due to globalisation of markets, new consumer demands, new structures in agricultural and industry and new supermarket strategies. From fragmented, not coordinated and with many segments in the supply chains, it is necessary to come to integrated and well co-ordinated systems. The performance of the individual firm depends now on the strengths and weaknesses of its partners in the supply chain.
The supply chain with a tracking technology on the ""Christmas-tree" (Xtree) would create a global
network of integration hubs of suppliers and clients that create, track, and deliver tagged Xtrees to multiple destinations from multiple supply sources. Each player has a role in the physical movement of X-trees. This infrastructure is integrated with backend systems such as ERP (Enterprise Resource Planning) virtualized databases, legacy systems, and new integrated systems. Therefore, an end-to-end supply chain management requires integration among all relevant processes throughout the supply chain, through sales, marketing, manufacturing, logistics and finance. In order to create a successful strategy it is necessary to have involvement, collaboration and integration of processes with customers, distributors, and suppliers including transportation carriers and distribution centres.
3.THE SLAUGHTERHOUSE COMPANY
The BC Group1 is an international food producer with production and sales across the world. It is the biggest company in the meat industry in the Europe and the second largest in the world. Its strategy focuses on innovation in all areas, requiring as such for creativity, willingness to change, and innovation. This is achieved not just by its own employees, but also by several working protocols with Danish universities and institutions.
For a close future, the strategy should be to increase the competitive power in: 1.Increased product value; 2.Improved process efficiency.
At present the traceability system in use meets the requisites of the industry. However, a continuous and increasing need for knowing and documenting the origin and properties of the meat is expected. The development of traceability and system solutions are at the forefront in step with the changing needs from the environment of the slaughterhouses and from internal requirements related to automation and automatic product control.
4. DEFINITION OF “CHRISTMAS-TREE”
The term Christmas-tree requires a good explanation of its meaning as it is essential for the understanding of this project. In the pork meat industry, a structure used to hang the pig cuts for better transportation has been develop. This structure consists of a stainless steel hook on top, which is resistant enough to hold several primal cuts. This hook is made in a way that it can flow in a conveyor rail. X-trees are used, return and are reused by members of the Supply Chain. Besides the operational and financial benefits, there are also some potential environmental advantages. These structures are used throughout the industry without much regard on their ownership and
1 The true name is omitted and it is designated this way
purposely.
accountability. There are around 500 000 X-trees in movement connecting slaughterhouses and their customers. They are no one's property and customers by contract are just obliged to return the same number of units they have received.
5. CURRENT TRACEABILITY IN THE
PORK DIVISION
Inside BC facilities, there is "no problem" of traceability by using RFID (Radio Frequency Identification).tags in the X- Trees. That is because with this technology any problem can be identified in meat lots of 1-2 hours of process. However, this technology is not standardized and RFID tags cannot be read in further processes. Therefore, before the shipment in the trailers, RFID tags are removed from the X- Trees. BC is losing information when the X- trees leave the plant. This is because when the RFID is removed, there is only a “daily lot number" for further processes. The aim of this project is exactly to
solve the gap between external and internal logistics at one plant of the BC Group.
With this improvement the benefits could be: In case of diseased, the infected meat would be identified faster and in a more concise way; Identification of the source of the problem; Costs reductions. The quantity of meat erased would be smaller.
The outcome of this study is a set of recommendations that, together with the interested parts, can help and can be used in the future as a reference for solving the problem stated. This is a study on several approaches that can be followed for future implementation.
6. METHODOLOGY AND SAMPLE DATA
SELECTION
This study followed a deductive research approach. It is based on a general research of the technologies available that can improve traceability. Then it is applied to one specific problem and it involves over all qualitative data collections focused on the main subject of this work – traceability. Information on BC was gathered using the company’s homepage, personal interviews and in situ visits to the slaughter house. It is expected to have reached good levels of reliability according the criteria set by Wiedersheim-Paul & Eriksson (2001) reliability as the measuring instrument’s ability to give reliable and stable results. High reliability methods should be independent of persons and organizations. Each task in this study had been checked by a supervisor that had the task of reading the document and making or asking for some improvements.
Part of this study aims to implement a benchmarking. After improving a decision analysis with the intention of eliminating hypotheses a sensitivity analysis is made. Another kind of analysis used to evaluate the
different possibilities consists of using the TRIZ methodology. Finally an analysis of costs is made.
6.1. Benchmarking
Many industries need to track back their products for several reasons. Some are new, others have been tracing their goods for years. In order to make a useful benchmarking, a wide range of industries has been observed, not just food industries, but also pharmaceutical, or luggage and automotive industries. Information could come up from any of these sources, as they present different qualities that should be considered.
The different industries that were analysed have shown a wide range of different possibilities.
For instance from the research in automotive
industry, it should be taken into account their need
for traceability for several years. Something especially interesting for the present project might be its experience when marking in metal and perhaps this would be useful to identify the X-trees. It is a very developed and automated industry, as well as BC pig division.
From the beef industry and their problems in the past, it is known that they were pioneers in new traceability methods. This industry was obliged to apply existing technologies into the food industry (Bar code labels, ear tags). This industry is researching new tracing applications like DNA traceability.
The eggs and poultry industries have illustrated not just that the most complex and fragile products can be traced, but also how to do it in an easy way. The use of codes is a simple way to store information in perishable products.
There can be found many resemblances between the
pharmaceutical and the food industry. Both are
perishable products for human consumption and also at the end of both processes the meat and the medication are packed.
About the luggage, the main similarity with the present project resides on items that should be manipulated. Every day and in every airport the luggage should be able to be traced back. The normal process uses bar codes labels, but in some airports (because of the problems when reading bar codes) the use of RFID is becoming more common. And these two technologies are currently utilized in the food industry.
Looking at other BC plants and their competition it is possible to see that all of them are working almost in the same way. But, it should be stated that BC Group is one of the biggest RFID user in this market. From the research done, it can be concluded that Bar code, RFID and vision cameras are the most common technologies used not only in BC plants but also in their competitors.
6.2. Traceability Technologies
Through the benchmarking came up three different proposals which might improve BC traceability system: 1.Features Identification Systems with DNA Identification or retina Identification; 2.The lorry's loading logic; 3.Identification of the X- trees (different ways) with Bar Code, Data Matrix, Machine Vision System or RFID
The initial approach was very broad but with the knowledge on the process and on the specific technologies it was possible to narrow down the research. The DNA Tracing would not be possible to implement in such a large and automated way. There is evidence of its use in Japan pork production. However, it is all a matter of volume of production and automation of processes. Implementing on a large scale, as in the BC production, would need the change of the entire industry supply chain, starting with the farmer (supplier). As an example, in Japan, the daily production is about 300 slaughtered pigs while that is the hourly production at one of BC plant. A similar consideration can be adopted when leaving behind the Retina Scan technology. The Lorry's Loading Logic solution is not a viable solution to implement, as there is no methodology in the loading, though all is done with a rail system it is done manually and not always in the same way. In the end it was managed to focus the study in four main fields which combination was also taken into account. The main fields of search were then the optical technologies, like the Bar-code, Data Matrix and Vision Cameral/Physical marking, and also RFID (Marsh, 2007) (Myerson, 2007), (Smith, 2004).
7. DECISION ANALYSIS
Performing a decision analysis from now on, based on the evaluator decisions, seems to be very interesting in order to make a choice according to several criteria and considering software for the analysis. Considering the decision process for the analysis of this subject, based on the four different ways to identify the X-Trees, it is intended to have a formal answer for the following question:
Which of these technologies is the closest to the optimal to solve the external traceability problem in the BC plant? The software used was the
MACBETH. The "Fundamental Points of View" came up because of their importance and relevance in each technology. They were organized by the evaluator according to their importance to the plant and to the process: Errors percentage, Usability, Reading time, Level of Standardization, Price and Set up Time. The points of view (PV) are commonly organized in a tree form – “value tree”. The PVs “Errors percentage” and “Reading time” were put together in the specification “Performance”, and the criterion “Other factors” has the other PVs (Fig. 1).
Fig. 1. Value tree
7.1. The evaluation model
This problem involves multiple PVs. A multi-criteria methodology to support the decision was used. There are two groups of multi-criteria models: compensatory model and non-compensatory model. The most common is the first, which is based in the Addictive Hierarchic Model. Basically the result of this model is the product between the number attributed by the evaluator to one PV and the global performance of one possible solution. This model has some limitations like the quantitative approach to each PV could be sometimes very difficult to evaluate.
It will be used the approach MACBETH. This approach asks the evaluator qualitative judges instead of quantitative without losing the scientific validity and rigour (Costa et al., 2005). The structuring of the problem and the alternative evaluations are two very important steps in the decision process as well as the need to understand the real meaning of a “sensitive analysis”.
7.2. Addictive Evaluation Model: MACBETH: Value Function: Criterion Reading Time
When the criteria are defined, the software asks for a scale of values, an upper value and a lower value – 0.5s and 4s in reading time example –Figure 2. This means that the 0.5s will correspond to a hundred points and 4s means zero points.
Afterwards it is needed to judge how the differently defined levels are related (Figure 3). Usually these functions are not linear functions. In this kind of judgements the evaluator has different perceptions from one level to the other.
Once filled the table the software is able to draw the value function (Figure 4).
7.3. Balance coefficients
Once the criteria were defined they were co-related according to the BC evaluator. The relative weights are available on Figure 5. We can easily check that the most important criteria to take in account are the
Errors % and the Usability. The less important is the
“Set Up Time”.
7.4. Application of the model
From the Table 1 can be checked that according to this model and according to the information collected the RFID is the best solution. This solution has the upper classification in three criteria and only in Price and in level of Standardization it is not good.
The second best solution is the bar code, it also has the upper classification in 3 criteria; however the
Usability, Standardization of the Technology and Set Up Time are less important criteria for the evaluator
than the criteria in which the RFID has the best score. It is important to add that the bar code has the highest score in the Price criterion.
7.5. Sensitivity analysis considering the weight of the criterion (Criterion Usability)
A Sensitivity analysis is used to examine if the choice of one option remains the same even when the weight of a criterion is changed. It is important to conclude on how much the weight of a criterion is important to the final recommendation. The figure 6 shows the sensitivity analysis on weight of the criterion
Usability. In this case the weight of this criterion is
23 and with this weight it is easy to conclude that the best option in this criterion is RFID, the second is Bar Code, the third is Vision Camera and the fourth is Data Matrix code. However, if the weight was less than 17.6 the second and the third position would change. Consequently, the order would be the following: RFID; Vision Camera; Bar Code; Data Matrix Code. It can be concluded that the sensitivity analysis on weight of the Usability criterion is: weight > 17.6% => Bar Code is the second; weight < 17.6% => Bar Code is the third; weight = 17.6% => Bar Code and Vision Camera are the second.
In this example the first will always be RFID whatever the weight is, but sometimes the first one can also change. It can be stated that the recommendation in Usability is RFID whatever the criterion weight to the evaluator.
7.6. Robustness analysis
The vertical axis (Figure 7) is the score of the price. The higher score means that the technology is cheaper than a technology with a lower score. On the vertical axis are the benefits of the solution. The red line means the border of efficiency.
Fig. 2. Properties of Reading time
Fig. 3. Reading Time
Fig. 5. Current Scale chart Table 1. Table of scores
Fig. 6. Sensitivity analysis of Usability
Fig. 7. Robustness analysis
It can be concluded from this graph that the solutions Bar Code and RFID are both on the efficiency border, but the Bar Code is less than half of the price of the
RFID solution (price in units). On the other hand RFID is an expensive solution but a solution with more benefits to solve this problem. DataMatrix Code is the highest price technology and brings less benefits comparing to all the other solutions available.
The final recommendation from the use of this decision analysis program is:
The client should decide on RFID because it is the best scored solution. However if the price of this solution is not attractive, the Bar Code solution is as well an efficient option.
8. TRIZ APPROACH
TRIZ is a methodology, tool set, knowledge base, and model-based technology for generating innovative ideas and solutions for solving problems. By choosing an improving and a worsening feature, this matrix software helps the user to get innovative solutions. It is an easy tool, based on forty principles, that provides some advices helping to choose between several options.
Finally it must be said that TRIZ is just a helping tool. It only provides general advices that can be
applied in a lot of diverse situations. For this reason the end user is the one responsible to read and apply this TRIZ suggestion on his own problem. The present analysis aims to choose the best solution according to the results obtained from the matrix, but as explained before this is only one possible interpretation of the outcomes. The solution adopted depends a lot on the person who reads and interprets the TRIZ advices.
The procedure followed in this analysis is the following:
A. First the TRIZ matrix requires the improving and worsening features, so they have to be chosen by the evaluator.
B. Then, automatically the TRIZ Matrix proposes the some of its 40 Principles to solve the contradiction. C. After that, the interpretation of these principles will end up with the particular solutions for the present project.
Having explained the process, the most relevant features for this project have to be chosen from the matrix: I. “Adaptability or versatility” vs. “easiness of manufacture”; II. “Reliability” vs. “easiness of operation”; III. “Extent of automation” vs. “loss of information”; IV. “Object affected harmfully” vs. “easiness of operation”.
Conclusions about the use of TRIZ approach applied to the present project:
I. On this, an independent (bar) code seems to be the most appropriate way, by printing the (bar) code on a support to be defined (paper, cardboard, chips…) and by setting it around the X- tree. Through this process, it seems to be easy to get the identification of the X- tree. Accordingly, RFID and Bar code would be the best solutions.
II. At this point, the best solution might be the bar code technology. Bar codes are characterized by their cheap price and by being used just once. Disposable, the bar code appears as the best compromise among all needs.
III. Marking a code in the steel of the X-tree, it would allow improving the automation of the process without losing data. A plate made in the same material of the X- tree could be used for engraving the code. The approach could then be a serial number or a Data Matrix code combined with Machine Vision.
IV. The selection of the features leads to the conclusion that it is necessary to turn to high technological solutions. If they do not look like the most relevant in a short future, they will probably play a strategic role in the long term. RFID and the Machine Vision are the most suitable according to this criterion.
9. TIME FRAME ANALYSIS
On this chapter the already narrowed technological approaches will be evaluated in a time frame. The
time frame is a time period during which something occurs or is expected to occur.
Any possible solutions to be regarded in the future have an impact in current and future working process. Driven by a detailed plan – a series of measurable goals, together with practical tactics and time frames for achieving them – the possible solutions should be analysed according to BC’s own schedule and investment policy. Based on these criteria it is possible to assess what solutions are more suitable for short or long term.
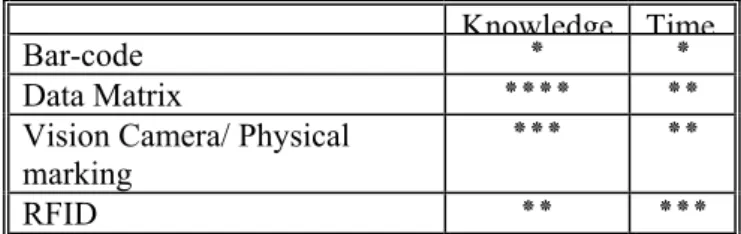
Table 2 was used to help the classification, where the knowledge required for implementation and the time required for implementation are taken into account. It must also be said that in case of the Bar-code and the RFID it is taken into account that the slaughterhouse of Ringsted is already using these systems in their process and as such, the knowledge required is far less than what would be required if they were to start using them.
Table 2. Knowledge and time required for
implementation of the technologies (٭ minimum; ٭٭٭٭ maximum)
According to BC group priorities in solving the problem already described one can use this analysis to decide which is more suitable and use it accordingly. The technologies can then be divided into: Short term implementation Time: Bar-code; Long term implementation Time: Data Matrix, Machine Vision, RFID.
According to this model and according to the information collected, the RFID is the best solution. The second best solution is the bar code; furthermore, this solution is the cheapest available.
10. COST ANALYSIS
When applied the program MACBETH for decision analysis, two main approaches were considered viable, the Bar-code and the RFID. A Cost Analysis as an economic tool to help the decision-making will now be employed to analyse these approaches.
The cost analysis should be regarded as a tool to facilitate the comparison of the two approaches, and the results show evidence of that. Several economic indicators - NPV; Payback; ROI or IRR were calculated.
An investment over the next 5 semesters in the Barcode shows better results in all key indicators. However, RFID presents a better option when considering a long term period and other benefits can result from this application in the long run.
Knowledge Time
Bar-code ٭ ٭
Data Matrix ٭٭٭٭ ٭٭
Vision Camera/ Physical marking
٭٭٭ ٭٭
11.OWNERSHIP, ACCOUNTABILITY,
INVESTMENT POSSIBILITIES
The success for any adopted programme relies on the standardisation of data and the form in which it is presented. The global tracking and tracing of X-trees close the gap between the plant and the customers. As such it should be identified who will be affected by the adoption of the approaches stated - BC; Customers; Final Consumer; Meat Industry; Regulatory Institutions.
Based on the different players involved in the process and in the different responsibilities that each one has, it is possible to come to some scenarios for attributing ownership, accountability and the investment required for any of the possible solutions adopted. Follow the scenarios for the most relevant solutions (Bar Code and RFID):
Bar code is relatively cheap, it should not be a problem. Customers just have to buy scanners and probably they already have them from other processes. The same happens with BC Group;
RFID standardization on the industry would require the commitment of the whole chain and governments; The concept of collaborative relationships is growing across industries. Trading partners share core assets, resources and information in order to be competitive and efficient. Considering the position of BC group in the market, the company should try to press both the regulation bodies and direct customers to adopt the selected system. Consequently, it would be expected that this kind of system would be adopted by the industry and that the investment would be spread among the involved parts. Managing X-trees with his competitors would become possible. This seems clearly a win-win situation to all parts, and companies involved.
12. CONCLUSIONS
This report allows BC and the pork industry to associate valuable business intelligence with a X-tree throughout its life-cycle, thereby providing accurate information for tracking of these assets. All the players should be taking responsible for the integrity of the X-trees. The identification of X-trees will provide complete and timely data about each uniquely identified X-tree throughout the supply chain and with this identification becomes possible to trace the meat as well.
There are challenges that are to the creation of an adaptive and flexible system that will not disrupt the current process and bring an important set of advantages, already referred. The different considered approaches have given the following results:
The permanent Physical Marking combined with Machine Vision is a valuable solution for the long term, however it is expensive, the marking can slow
down the process and it has a considerable error percentage.
The Bar-code is a well known system that would require little knowledge, time and investment to implement, however it comes with several disadvantages that make it suitable for a short term solution or as a backup system, never as a definitive solution;
The RFID tagging of each Xtree is apparently the best long term solution, when considering all the benefits that come along and supported by the decision analysis program and the cost analysis. It must be mentioned that a standardisation is required and BC has the position to press the supply chain to adopt an international standard.
13. RECOMMENDATIONS
The report ends with some recommendations to the company, which can be adopt by other industries. The most relevant recommendations are:
On the short term Bar-code is a valuable option; Whatever the system implemented, real time information would become available in addition to the recording of historic data;
Building strong relationships with key stakeholders - customers, partners and government;
In the future, providing the consumers with detailed information about what they are eating might be a competitive advantage. Achieving a total traceability could be a potential way to make customers feel that the product they bought has an added value.
These recommendations, the study and all the research made, could have applications in other food industries as well as in different industries that need to trace their products in an integrated supply chain.
14. REFERENCES
1. Costa, C., Vansnick, J. & João, I. (2005).
M-macbeth guia do utilizador. IST, Lisboa.
2. Marsh, M. (2007). Impact of different air protocols
on the use of the radio spectrum by Radio Frequency Identification (RFID) devices in the 860 to 960MHz bands. Trolley Scan Ltd, South Africa Vol. 81, Issue
7, July 2007, pp. 1322-1332.
3. Myerson, M. (2007). RFID in the Supply Chain –
A guide to Selection and Implementation. Auerbach
Publications.
4. Smith, R (2004). RFID: A Brief Technology
Analysis. CTOnet.org © Copyright 2004
5. Wiedersheim-Paul, F. and Eriksson, L. T. (2001).
Att Utrera Forska och Rapportera. Malmo: Libber
Ekonomi.
Received: January 11, 2011 / Accepted: May 30, 2011 / Paper published online: June 10, 2011
© International Journal of Modern Manufacturing Technologies