Abundance, structure and distributional patterns of core
secondary producers in a temperate estuary: Driving
factors and climate change scenario simulations
Allan T. Souza
Tese de doutoramento em Ciências do Mar e do Ambiente
Allan T. Souza
Abundance, structure and distributional patterns of core
secondary producers in a temperate estuary: Driving factors and
climate change scenario simulations
Tese de Candidatura ao grau de Doutor em
Ciências do Mar e do Ambiente (Especialidade
em: Oceanografia e Ecossistemas Marinhos)
submetida ao Instituto de Ciências Biomédicas
de Abel Salazar da Universidade do Porto.
Orientadora
– Doutora Irene Isabel da Cruz
Martins
Categoria – Investigadora
Afiliação
– IMAR – CMA, Institute of Marine
Research
– Centre for Sea and Environment,
Department of Life Sciences, University of
Coimbra.
Co-orientador
– Doutor João Carlos de Sousa
Marques
Categoria – Professor Catedrático
Afiliação
– IMAR – CMA, Institute of Marine
Research
– Centre for Sea and Environment,
Department of Life Sciences, University of
Coimbra.
i This Thesis includes two scientific papers published in international journals and six submitted articles originated from part of the results obtained in the experimental work referenced as:
Souza AT, Ribas FO, Dias E, Campos J, Marques JC, Martins I (submitted)
Distributional patterns of the shore crab Carcinus maenas in a salt-wedge estuary: sexual and ontogenetic segregation.
Souza AT, Dias E, Campos J, Marques JC, Martins I (accepted) Structure, growth
and production of a remarkably abundant population of the common goby
Pomatoschistus microps (Actinopterygii: Gobiidae). Environmental Biology of
Fishes.
Souza AT, Dias E, Marques JC, Antunes C, Martins I (submitted) Population
structure, production and feeding habit of the sand goby Pomatoschistus minutus (Actinopterygii: Gobiidae) in a estuary dominated by the sympatric species P.
microps.
Souza AT, Dias E, Nogueira A, Campos J, Marques JC, Martins I (2013) Population
ecology and habitat preferences of juvenile flounder Platichthys flesus (Actinopterygii: Pleuronectidae) in a temperate estuary. Journal of Sea Research 79: 60–69.
Souza AT, Freitas F, Campos J, Marques JC, Martins I (submitted) Top-abundant
demersal species in a temperate salt-wedge estuary: Assemblages structure and dominance patterns.
Souza AT, Ilarri MI, Campos J, Marques JC, Martins I (2011) Differences in the
neighborhood: Structural variations in the carapace of shore crabs Carcinus
maenas (Decapoda: Portunidae). Estuarine, Coastal and Shelf Science 95: 424–
430.
Souza AT, Marques JC, Martins I (submitted) Modeling the effects of temperature
ii
Souza AT, Marques JC, Martins I (submitted) Modeling the effects of climate
change on a remarkably abundant population of the common goby
iii
One should not pursue goals that are easily achieved. One must develop an instinct for what one can just barely achieve through one’s greatest efforts.
v
Table of Contents
Page
Acknowledgements xi
Figures index xiii
Tables index xxiii
Summary xxix
Resumo xxxi
Chapter 1. General introduction 1
1.1 Estuaries and climate change 3
1.2 Climate change signals in Southern Europe and their potential impacts on estuaries
4 1.3 Relationships of climate change, population dynamics and ecological modeling
5 1.4 Case study: Minho estuary (NW Iberian Peninsula) 6
Chapter 2. Studied species 11
2.1 Carcinus maenas 13
2.2 Pomatoschistus microps 15
2.3 Pomatoschistus minutus 17
2.4 Platichthys flesus 19
Part I – Abundance, structure and distributional patterns 21 Chapter 3. Distributional patterns of the shore crab Carcinus maenas in a salt-wedge estuary: sexual and ontogenetic segregation
23
Abstract 27
3.1 Introduction 29
3.2 Material and methods 30
3.2.1 Study area and sampling campaign 30
3.2.2 Laboratory procedures 32
3.2.3 Data analysis 32
3.3 Results 34
3.3.1 Abiotic data 34
3.3.2 Shore crab data 37
3.3.2.1 Density patterns 37
3.3.2.2 Sexes 38
3.3.2.3 Color morphotypes 39
3.3.2.4 Size, recruitment patterns and production estimates 40
3.3.2.5 Crab-habitat associations 44
3.4 Discussion 45
3.5 Acknowledgements 50
vi population of the common goby Pomatoschistus microps (Actinopterygii:
Gobiidae)
Abstract 55
4.1 Introduction 57
4.2 Material and methods 58
4.2.1 Study area and sampling procedures 58
4.2.2 Laboratory procedures 60
4.2.3 Data analysis 60
4.3 Results 63
4.3.1 Abiotic data 63
4.3.2 Common goby data 65
4.3.2.1 Density patterns 65
4.3.2.2 Size and recruitment patterns 68
4.3.2.3 Fish-habitat associations 72
4.3.2.4 Length-weight relationship, growth and secondary production 73
4.4 Discussion 73
4.5 Conclusions 79
4.6 Acknowledgements 79
Chapter 5. Population structure, production and feeding habit of the sand goby Pomatoschistus minutus (Actinopterygii: Gobiidae) in a estuary dominated by the sympatric species P. microps
81
Abstract 85
5.1 Introduction 87
5.2 Material and methods 88
5.2.1 Study area and sampling campaign 88
5.2.2 Laboratory procedures 90 5.2.3 Data analysis 90 5.3 Results 93 5.3.1 Abiotic data 93 5.3.2 Population structure 95 5.3.2.1 Density patterns 95
5.3.2.2 Size and recruitment patterns 98
5.3.2.3 Fish-habitat association and secondary production 102
5.3.3 Feeding habits 104
5.4 Discussion 107
5.5 Acknowledgements 110
Chapter 6. Population ecology and habitat preferences of juvenile flounder Platichthys flesus (Actinopterygii: Pleuronectidae) in a temperate estuary
111
vii
6.1 Introduction 117
6.2 Material and methods 119
6.2.1 Study area and sampling campaign 119
6.2.2 Laboratory procedures 121 6.2.3 Data analysis 121 6.3 Results 123 6.3.1 Abiotic data 123 6.3.2 Flounder data 126 6.3.2.1 Density patterns 126
6.3.2.2 Size and recruitment patterns 128
6.3.2.3 Fish-habitat associations 130
6.3.2.4 Length-weight relationship and secondary production 132
6.4 Discussion 132
6.4.1 Distribution patterns and habitat use 132
6.4.2 Flounder condition and production 136
6.5 Conclusions 138
6.6 Acknowledgements 138
Chapter 7. Top-abundant demersal species in a temperate salt-wedge estuary: Assemblages structure and dominance patterns
139
Abstract 143
7.1 Introduction 145
7.2 Material and methods 146
7.2.1 Study area, sampling campaign and laboratory procedures 146
7.2.2 Data analysis 149 7.3 Results 150 7.3.1 Abiotic data 150 7.3.2 Biotic data 152 7.3.2.1 Density patterns 152 7.3.2.2 Biomass patterns 156 7.3.2.3 Dominance patterns 160 7.3.2.4 Species-habitat association 165 7.4 Discussion 166 7.5 Conclusions 171 7.6 Acknowledgements 171
Chapter 8. Differences in the neighborhood: Structural variations in the carapace of shore crabs Carcinus maenas (Decapoda: Portunidae)
173
Abstract 177
8.1 Introduction 179
viii
8.2.1 Sampling and laboratory analyses 180
8.2.2 Data analysis 183
8.3 Results 183
8.3.1 Ecological data 183
8.3.2 Carapace structure: range of observations 184
8.3.3 Carapace structure: mature versus immature crabs 185 8.3.4 Carapace structure: differences between sites 186
8.4 Discussion 188
8.4.1 Differences among C. maenas functional groups 188 8.4.2 Differences between sites: ecological and behavioral implications 190
8.5 Acknowledgements 193
Part II – Climate change scenario simulations 195
Chapter 9. Modeling the effects of temperature and salinity variations on the shore crab Carcinus maenas
197 Abstract 201 9.1 Introduction 203 9.2 Data set 204 9.2.1 Crab data 204 9.2.2 Abiotic data 205
9.3 Model formulation and conceptualization 206
9.3.1 Larval phase, recruitment and post-settlement 207
9.3.2 Effect of temperature on C. maenas growth 213
9.3.3 Effect of salinity on C. maenas growth 213
9.3.4 Mortality 214 9.3.5 Migration 214 9.3.6 Sensitivity analysis 215 9.3.7 IPCC predictions 215 9.4 Results 216 9.4.1 Model results 216
9.4.2 Model stability and sensitivity analysis 217
9.4.3 Climate change simulations 219
9.4.3.1 Temperature variations 219
9.4.3.2 Salinity variations 220
9.4.3.3 Combined effects of temperature and salinity variations 221 9.4.3.4 Long-term effects of temperature and salinity variations 223
9.5 Discussion and conclusions 224
9.6 Acknowledgements 227
Chapter 10. Modeling the effects of climate change on a remarkably abundant population of the common goby Pomatoschistus microps
ix Abstract 233 10.1 Introduction 235 10.2 Study area 235 10.3 Data set 237 10.3.1 Fish data 237 10.3.2 Abiotic data 237
10.4 Model formulation and conceptualization 238
10.4.1 Reproduction and recruitment 239
10.4.2 Mortality 243
10.4.3 Migration 244
10.4.4 Effect of temperature on growth 245
10.4.5 Effect of salinity on growth 245
10.4.6 Sensitivity analysis 246
10.4.7 IPCC predictions 246
10.5 Results 247
10.5.1 Model results 247
10.5.2 Model stability and sensitivity analysis 248
10.5.3 Climatic change simulations 249
10.5.3.1 Temperature variations 250
10.5.3.2 Salinity variations 251
10.5.3.3 Combined effects of temperature and salinity variations 252
10.5.3.4 Long-term effects 254
10.6 Discussion and conclusions 255
10.7 Acknowledgements 259
Chapter 11. Conclusions and future directions 261
References 265
xi
Acknowledgements
I would like to thank everyone who one way or another has helped me during the course of my PhD, namely my laboratory (LMCEE) and PhD colleagues (PROMAR), my supervisors, my family and friends. I surely could not complete this task without the help of each one of them.
xiii
Figures index
Page Fig. 1.1 Location of the Minho estuary in the northern Portuguese-Spanish
border (NW Iberian Peninsula).
6 Fig. 1.2 Monthly variation of the Standard Precipitation Index (SPI) in Minho
estuary (NW Iberian Peninsula) from 1953 to 2010. Arrows indicate abnormal climatic events (white arrows = droughts; black arrows = floods). Source: Integrated Climate Data Center (http://icdc.zmaw.de).
7
Fig 1.3. Monthly values of river discharge (dam3) from 1991 to 2010, with indication of the average value for the period of 1990 to 2010. Arrows indicate abnormal climatic events (white arrows = droughts; black arrows = floods). Source: Sistema Nacional de Informação de Recursos Hídricos - SNIRH (www.snirh.pt).
8
Fig. 1.4 Annual surface temperature difference from the 1951-1980
average in Minho estuary (NW Iberian Peninsula). Source: NASA Goddard Institute for Space Studies - Surface Temperature Analysis (www.giss.nasa.gov).
8
Fig. 2.1 Area of occurrence of the shore crab Carcinus maenas. Blue =
indigenous area of distribution; Red = Invaded areas; Green = potential to invasion. Black = occasional records. Source: Wikimedia.
13
Fig. 2.2 Published papers focusing on the shore crab Carcinus maenas in
Portugal.
13 Fig. 2.3 Papers dealing with the shore crab Carcinus maenas in Portugal
grouped according to their research field.
14 Fig. 2.4 Published papers focusing on the common goby Pomatoschistus
microps in Portugal.
15 Fig. 2.5 Papers dealing with the common goby Pomatoschistus microps in
Portugal grouped according to their research field.
16
Fig. 2.6 Published papers focusing on the sand goby Pomatoschistus
minutus in Portugal.
17 Fig. 2.7 Papers dealing with the sand goby Pomatoschistus minutus in
Portugal grouped according to their research field.
18
Fig. 2.8 Published papers focusing on the European flounder Platichthys
flesus in Portugal.
19 Fig. 2.9 Papers dealing with the European flounder Platichthys flesus in 20
xiv Portugal grouped according to their research field.
Fig. 3.1 Map of the study site showing the three sampling stations at the
lower Minho Estuary, NW Iberian Peninsula.
31 Fig. 3.2 PCA showing the differences of the environmental variables among
sampling stations at the lower Minho Estuary, NW Iberian Peninsula. ▲= station 1; ● = station 2 and ■ = station 3. T(oC) = water temperature; ORP(mV) = potential redox.
36
Fig. 3.3 Mean density (± SE) of the Shore crab Carcinus maenas during
18-months study period in the lower Minho estuary, NW Iberian Peninsula.
37 Fig. 3.4 Comparisons on the densities (mean ± SE) of the shore crab
Carcinus maenas between seasons in each sampling station of the lower
Minho estuary, NW Iberian Peninsula. Different letters (a, b, c or d) indicate significant differences between them (Two-way PERMANOVA pairwise tests: p<0.05).
38
Fig. 3.5 Abundance of different size classes of the shore crab Carcinus
maenas throughout the 18 months sampled in Minho estuary, NW Iberian
Peninsula. Vertical white bars separate different seasons. Size classes: A (< 15 mm), B (16-25 mm), C (26-35 mm), D (36-45 mm); E (46-55 mm), F (56-65 mm) and G (> (56-65 mm).
42
Fig. 3.6 Size frequency distribution of the shore crab Carcinus maenas in
the lower Minho estuary, NW Iberian Peninsula.
43 Fig. 3.7 Canonical plotting of environmental characteristics (arrows) and
different groups of individuals – sexes and color morphotypes (a) and size classes (b) – of the shore crab Carcinus maenas in the lower Minho estuary, NW Iberian Peninsula. ORP = Redox potential. Size classes: A (< 15 mm), B (16-25 mm), C (26-35 mm), D (36-45 mm); E (46-55 mm), F (56-65 mm) and G (> 66 mm).
45
Fig. 4.1 Sampling stations on the lower Minho Estuary (NW Iberian
Peninsula).
59
Fig. 4.2 PCA showing the differences of the environmental variables among
sampling stations in the lower Minho Estuary, NW Iberian Peninsula.
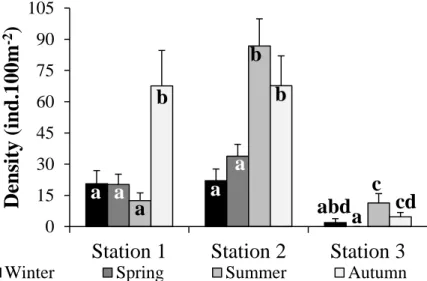
65 Fig. 4.3 (A) Mean density (± SE) of the common goby Pomatoschistus
microps during 18-months study period in Minho estuary. (B) Comparisons
on the densities (mean ± SE) of P. microps between sampling stations and seasons. Different letters (a, b or c) indicates post-hoc differences among
xv sampling stations within the same season. Post-hoc differences among seasons within each sampling station are indicated by circles of different colors (white, grey or black) (Two-way PERMANOVA pairwise tests: p < 0.05).
Fig. 4.4 Comparisons on the density (mean ± SE) of ovigerous females of
the common goby Pomatoschistus microps among three sampling stations and seasons in lower Minho estuary, NW Iberian Peninsula. Different letters (a or b) indicates post-hoc differences among sampling stations within the same season. Post-hoc differences among seasons within each sampling station are indicated by circles of different colors (white or black) (Two-way PERMANOVA pairwise tests: p < 0.05).
68
Fig. 4.5 Mean density (± SE) of the seven size classes of the common goby
Pomatoschistus microps among seasons in each sampling station of the
lower Minho estuary, NW Iberian Peninsula. Size classes: A (< 15.00 mm), B (15.01 to 20.00 mm), C (20.01 to 25.00 mm), D (25.01 to 30 mm); E (30.01 to 35.00 mm), F (35.01 to 40.00 mm) and G (> 40.01 mm).
70
Fig. 4.6 Mean cohort length of the common goby Pomatoschistus microps
in lower Minho estuary, with indication of the five cohorts identified by the mixture analysis (C1, C2, C3, C4 and C5).
72
Fig. 4.7 Canonical plotting of environmental characteristics (arrows) and
males, females and juveniles of the common goby Pomatoschistus microps in Minho estuary, NW Iberian Peninsula. ORP = Redox potential.
72
Fig. 5.1 Map of the study site showing the three sampling stations at the
lower Minho Estuary, NW Iberian Peninsula.
89
Fig. 5.2 PCA showing the differences of the environmental variables among
sampling stations in the lower Minho Estuary, NW Iberian Peninsula.
95 Fig. 5.3 (a) Mean density (± SE) of the sand goby Pomatoschistus minutus
throughout 18 consecutive months in the lower Minho estuary, NW Iberian Peninsula. (b) Comparisons on the densities (mean ± SE) of P. minutus between sampling stations and seasons. Different letters (a or b) indicates post-hoc differences among sampling stations within the same season. Post-hoc differences among seasons within each sampling station are indicated by circles of different colours (white, grey or black) (Two-way PERMANOVA pairwise tests: p < 0.05).
96
Fig. 5.4 Comparisons on the total length (mean ± SE) of P. minutus between
sampling stations and seasons. Different letters (a, b or c) indicates post-98
xvi hoc differences among sampling stations within the same season. Post-hoc differences among seasons within each sampling station are indicated by circles of different colours (white, grey or black) (Two-way PERMANOVA pairwise tests: p < 0.05).
Fig. 5.5 Mean density ± SE of the six size classes of the sand goby
Pomatoschistus minutus among seasons in each sampling station of the
lower Minho estuary, NW Iberian Peninsula. Size classes: C1 (< 29.99 mm), C2 (30.00 to 39.99 mm), C3 (40.00 to 49.99 mm), C4 (50.00 to 59.99 mm), C5 (60.00 to 69.99 mm) and C6 (> 70.00 mm).
99
Fig. 5.6 (a) Density of different size classes of the sand goby
Pomatoschistus minutus throughout the 18 months sampled in Minho
estuary, NW Iberian Peninsula. Vertical white bars separate different seasons. Size classes: C1 (< 29.99 mm), C2 (30.00 to 39.99 mm), C3 (40.00 to 49.99 mm), C4 (50.00 to 59.99 mm), C5 (60.00 to 69.99 mm) and C6 (> 70.00 mm). (b) Mean cohort length of P. minutus in Minho estuary, with indication of the three cohorts identified by the mixture analysis (A1, A2 and A3).
101
Fig. 5.7 Canonical plotting of environmental characteristics (arrows) and
males, females and juveniles (a) and different size classes (b) of the sand goby Pomatoschistus minutus in the lower Minho estuary, NW Iberian Peninsula. ORP = Redox potential. Size classes: C1 (< 29.99 mm), C2 (30.00 to 39.99 mm), C3 (40.00 to 49.99 mm), C4 (50.00 to 59.99 mm), C5 (60.00 to 69.99 mm) and C6 (> 70.00 mm).
103
Fig. 5.8 Relative abundance of the food items (functional groups)
consumed by the sand goby Pomatoschistus minutus in the lower Minho estuary, NW Iberian Peninsula. Others = Sum of fishes and arachnids. The upper portion of the figure refers to the similarity index between seasons.
106
Fig. 6.1 Map of the study site showing the five sampling stations in Minho
estuary, NW Iberian Peninsula.
120 Fig. 6.2 Principal Components Analysis (PCA) biplot for the abiotic data
collected from February 2009 to July 2010 in five sampling stations (S1, S2, S3, S4 and S5) in Minho estuary, NW Iberian Peninsula.
125
Fig. 6.3 (A) Mean density (± SE) of the European flounder Platichthys flesus
during 18-months study period in Minho estuary. (B) Comparisons on the densities (mean ± SE) of P. flesus between sampling stations and seasons. Different letters (a, b, c or d) indicates post-hoc differences among
xvii sampling stations within the same season. Post-hoc differences among seasons within each sampling station are indicated by circles of different colors (black or white), while continuous line indicates that there are no significant differences among seasons crossed by it (Two-way PERMANOVA pairwise tests: p < 0.05).
Fig. 6.4 (A) Size classes proportions of the European flounder Platichtys
flesus in Minho estuary throughout time. Size classes: F1 (< 25 mm), F2 (25
to 49.9 mm), F3 (50 to 74.9 mm), F4 (75 to 99.9 mm), F5 (100 to 124.9 mm) and F6 (> 125 mm). Vertical dashed lines separate different seasons. (B) Mean cohort length of P. flesus in Minho estuary, with indication of the three cohorts identified by the mixture analysis (C1, C2 and C3).
130
Fig. 6.5 Canonical plotting of environmental characteristics (arrows) and
different size classes of the European flounder Platichthys flesus in Minho estuary, NW Iberian Peninsula. ORP = Redox potential. Size classes: F1 (< 25 mm), F2 (25 to 49.9 mm), F3 (50 to 74.9 mm), F4 (75 to 99.9 mm), F5 (100 to 124.9 mm) and F6 (> 125 mm).
131
Fig. 7.1 Map of the study site showing the three sampling stations at the
lower Minho Estuary, NW Iberian Peninsula.
147 Fig. 7.2 PCA showing the differences of the environmental variables among
sampling stations in the lower Minho Estuary, NW Iberian Peninsula.
152
Fig. 7.3 Percentage of contribution of juveniles and adults for the
population of the five most abundant demersal species in Minho lower estuary, NW Iberian Peninsula.
153
Fig. 7.4 Comparisons on the density of juveniles and adults of the five
top-abundant demersal species in Minho estuary (NW Iberian Peninsula) among sampling stations and seasons.
155
Fig. 7.5 Percentage of contribution of juveniles and adults biomasses of the
five dominant demersal species in Minho lower estuary, NW Iberian Peninsula.
157
Fig. 7.6 Comparisons on the biomass of juveniles and adults of the top five
abundant demersal species in Minho estuary (NW Iberian Peninsula) among sampling stations and seasons.
158
Fig. 7.7 Dominance patterns: Comparisons on the density (left column) and
biomass (right column) of the top-abundant demersal species in Minho lower estuary, NW Iberian Peninsula. Density (ind.100m-2) data refers to the
xviii mean values (log transformed) of each species in every sampling station and season. Biomass data refers to a value (log transformed) calculated by the simple multiplication of the mean density (ind.100m-2) by the average wet weight (g) of each species during the respective season.
Fig. 7.8 Comparisons on the Pielou’s evenness index (A) and the
Berger-Parker dominance index (B) values for the top five dominant demersal species in Minho estuary (NW Iberian Peninsula) between sampling stations and seasons. Different letters (a or b) indicates post-hoc differences among sampling stations within the same season. Post-hoc differences among seasons within each sampling station are indicated by circles of different colours (white, grey or black) (Two-way PERMANOVA pairwise tests: p < 0.05).
163
Fig. 7.9 Density and biomass of juveniles and adults of the two dominant
taxonomic groups (crustaceans and fishes) in the three sampling stations of the lower Minho estuary (NW Iberian Peninsula) throughout 16 consecutive months (April/09 to July/10).
164
Fig. 7.10 Canonical plotting of abiotic characteristics (arrows) and juveniles
(J) and adults (A) of the top five dominant demersal species in the lower
Minho estuary, NW Iberian Peninsula. ORP = Redox potential.
166
Fig. 8.1 Map of the study site showing the two sampling stations on the
lower Minho Estuary.
181 Fig. 8.2 Carcinus maenas areas measured for carapace and claw thickness
(black bars).
182 Fig. 8.3 Differences in the ratio of carapace width (CW) and thickness (mean
± SD) of Carcinus maenas immature (CW < 30 mm) and mature (CW > 30 mm) individuals in Minho estuary. Grey bars = males; white bars = females; a = ratio times 1000.
186
Fig. 8.4 Two-dimensional nMDS ordination of Carcinus maenas carapace
(ratios of carapace thickness and weight with width) and chelae variables (ratios of chelae thickness with length) in two sampling sites in Minho estuary. Station 1 = grey triangles; Station 2 = black triangles.
187
Fig. 8.5 Ratios (mean ± SD) of width and thickness of the Carcinus maenas
carapace at the two sampling stations in lower Minho estuary. CW = Carapace width; S1 = Station 1; S2 = Station 2.
187
xix S2) at the lower Minho estuary, NW Iberian Peninsula.
Fig. 9.2 Sea Surface Temperature (SST) at the sea nearby the mouth of the
Minho estuary, and the temperature and the salinity variation at the lower Minho estuary during the study period.
205
Fig. 9.3 Monthly variation in daylight duration at the Minho estuary, NW
Iberian Peninsula.
206
Fig. 9.4 Simplified STELLA diagram of the population dynamics model of
the shore crab Carcinus maenas. Grey arrows indicate the input or the transference of individuals between population groups. White arrows indicate the outputs of the state variables. All state variables and fluxes indicate the number of individuals in 100m-2 per month. NSJ = Newly settled juveniles.
207
Fig. 9.5 Observed ± SD and predicted variation of subadults, females,
males and the total density (ind.100m-2) of the shore crab Carcinus
maenas.
217
Fig. 9.6 Long term simulation (48 months) for the shore crab C. maenas
population in Minho estuary (NW Iberian Peninsula), showing longtime stability of the model, with every population group presenting consistent stability through time. Wi = winter; Sp = spring; Su =summer; Au = autumn.
218
Fig. 9.7 One year simulations of subadults, females, males and total
density of the shore crab Carcinus maenas in different scenarios of temperature increase according to the IPCC projections for the future. Dotted lines refer to low scenarios of climate change and dashed lines refer to high scenarios of climate change.
220
Fig. 9.8 One year simulations of subadults, females, males and total
density of the shore crab Carcinus maenas in scenarios of salinity decreasing (-5 psu) and increasing (+5 psu) and oscillatory pattern (-5 psu from November to April, and +5 psu from May to October).
221
Fig. 9.9 One year simulations of subadults, females, males and the total
density of the shore crab Carcinus maenas in different climatic change scenarios of temperature and salinity increase (left column), temperature increase and salinity decrease (middle column) and temperature increase and oscillatory salinity (-5 psu from November to April, and +5 psu from May to October).
222
xx pattern of salinity in C. maenas population in Minho estuary, NW Iberian Peninsula.
Fig. 10.1 Map of the study site showing the three sampling stations (S1, S2
and S3) at the lower Minho estuary, NW Iberian Peninsula.
236 Fig. 10.2 Water temperature and the salinity variation at the lower Minho
estuary during the study period.
237
Fig. 10.3 Monthly variation in daylight duration at the Minho estuary, NW
Iberian Peninsula.
238 Fig. 10.4 Simplified STELLA diagram of the population dynamics model of
the common goby Pomatoschistus microps. Grey arrows indicate the input or the transference of individuals between population groups. White arrows indicate the outputs of the state variables. All state variables and fluxes indicate the number of individuals in 100m-2 per month.
239
Fig. 10.5 Observed ± SD and predicted variation of juveniles, females,
males and the total density (ind.100m-2) of the common goby
Pomatoschistus microps.
247
Fig. 10.6 Long term simulation for the common goby P. microps population
in Minho estuary (NW Iberian Peninsula), showing longtime stability of the model, with every population group presenting consistent stability through time.
248
Fig. 10.7 One year simulations of juveniles, females, males and total
density (ind.100m-2) of the common goby Pomatoschistus microps in different scenarios of temperature increase according to the IPCC projections for the future. Dotted lines refer to low scenarios of climate change and dashed lines refer to high scenarios of climate change.
250
Fig. 10.8 One year simulations of juveniles, females, males and total
density of the common goby Pomatoschistus microps in different scenarios of salinity decreasing (-5 psu) and increasing (+5 psu) and oscillatory pattern (-5 psu from November to April, and +5 psu from May to October)
251
Fig. 10.9 One year simulations of juveniles, females, males and the total
density of the common goby Pomatoschistus microps in different climatic change scenarios of temperature and salinity increase (left column), temperature increase and salinity decrease (middle column) and temperature increase and oscillatory salinity (-5 psu from November to April, and +5 psu from May to October).
xxi
Fig. 10.10 Long-term effects of temperature increasing on P. microps
population in Minho estuary, NW Iberian Peninsula. IPPC low scenario = +0.01ºC.y-1 and IPPC high scenario = +0.04ºC.y-1.
254
Fig. 10.11 Long-term effects of salinity variation on P. microps population
in Minho estuary, NW Iberian Peninsula. Oscillatory = -5 psu from November to April, and +5 psu from May to October. The -5 psu scenario is plotted on the secondary vertical axis.
254
Fig. 10.12 Long-term effects of temperature increase combined with
salinity variation on P. microps population in Minho estuary, NW Iberian Peninsula. Oscillatory = -5 psu from November to April, and +5 psu from May to October. Low scenario = +0.01ºC.y-1 and High scenario = +0.04ºC.y-1. The High and -5 psu scenario is plotted on the secondary vertical axis.
xxiii
Tables and appendices index
Page Table 3.1 Two-way PERMANOVA results on the effects of sampling stations
and seasons and their interaction term on the abiotic variables in lower Minho estuary, NW Iberian Peninsula. * = p < 0.01; ** = p < 0.001; ns = non-significant.
34
Table 3.2 Comparisons on the density (mean ± SE) of males, females and
juveniles of the shore crab Carcinus maenas among three sampling stations and four seasons in the lower Minho estuary, NW Iberian Peninsula. ns = non-significant; * = p < 0.001. Different letters indicates significant differences among them. Lower case letters refers to comparisons among seasons, while upper case letters in brackets refers to comparisons among sampling stations (Two-way PERMANOVA, pairwise test: p < 0.05).
39
Table 3.3 Comparisons on the density (mean ± SE) of males and females of
the green and red morphotype of the shore crab Carcinus maenas among sampling stations and seasons in lower Minho estuary, NW Iberian Peninsula. Different letters indicates significant differences among them. Lower case letters refers to comparisons among seasons, while upper case letters in brackets refers to comparisons among sampling stations (Two-way PERMANOVA, pairwise test: p < 0.05).
40
Table 3.4 Comparisons of the size (mean ± SE) of males and females of the
shore crab Carcinus maenas among sampling stations and seasons in lower Minho estuary, NW Iberian Peninsula. ns = non-significant; * = p < 0.001. Different letters indicates significant differences among them. Lower case letters refers to comparisons among seasons, while upper case letters in brackets refers to comparisons among sampling stations (Two-way PERMANOVA, pairwise test: p<0.05).
41
Table 3.5 Mean density of Carcinus maenas in different locations in
Atlantic estuaries.
47 Table 4.1 Values of the five environmental variables (mean ± SE) measured
in the three sampling stations throughout the seasons in the lower Minho estuary, NW Iberian Peninsula and the Two-way PERMANOVA results on the effects of sampling stations and seasons and their interaction term. * = p < 0.01; ** = p < 0.001; ns = non-significant. Different letters indicates significant differences among them. Lower case letters refers to
xxiv comparisons among seasons, while upper case letters in brackets refers to comparisons among sampling stations (Two-way PERMANOVA, pairwise test: p < 0.05).
Table 4.2 Comparisons on the estimated density (mean ± SE) of males,
females and juveniles of the common goby Pomatoschistus microps among three sampling stations and four seasons in Minho estuary, NW Iberian Peninsula. * = p < 0.001. Different letters indicates significant differences among them. Lower case letters refers to comparisons among seasons, while upper case letters in brackets refers to comparisons among sampling stations (Two-way PERMANOVA, pairwise test: p < 0.05).
67
Table 4.3 Comparisons on the total length (mean ± SE) of males and
females of the common goby Pomatoschistus microps among sampling stations and seasons in Minho estuary, NW Iberian Peninsula. ns = non-significant; * = p < 0.001. Different letters indicates significant differences among them. Lower case letters refers to comparisons among seasons, while upper case letters in brackets refers to comparisons among sampling stations (Two-way PERMANOVA, pairwise test: p < 0.05).
69
Table 4.4 Comparisons on the total length (mean ± SE) of ovigerous
females of the common goby Pomatoschistus microps among sampling stations and seasons in Minho estuary, NW Iberian Peninsula. Different letters indicates significant differences among them. Lower case letters refers to comparisons among seasons, while upper case letters in brackets refers to comparisons among sampling stations (Two-way PERMANOVA, pairwise test: p < 0.05).
69
Table 4.5 Absolute growth rates (AGR, mm.day-1) for the common goby
Pomatoschistus microps cohorts. The AGR and the 95% confidence interval
(CI) were computed only when the cohort was recorded for more than 3 months.
73
Table 4.6 Mean density of the common goby Pomatoschistus microps in
different Atlantic estuaries.
77
Table 5.1 Values of the five environmental variables (mean ± SE) measured
in the three sampling stations throughout the seasons in the lower Minho estuary, NW Iberian Peninsula and the Two-way PERMANOVA results on the effects of sampling stations and seasons and their interaction term. * = p < 0.01; ** = p < 0.001; ns = non-significant.
xxv
Table 5.2 Comparisons on the density (mean ± SE) of males, females and
juveniles of the sand goby Pomatoschistus minutus among three sampling stations and four seasons in Minho estuary, NW Iberian Peninsula. ns = non-significant; * = p < 0.05; ** = p < 0.01; *** = p < 0.001. Different letters indicates significant differences among them. Lower case letters refers to comparisons among seasons, while upper case letters in brackets refers to comparisons among sampling stations (Two-way PERMANOVA, pairwise test: p < 0.05).
97
Table 5.3 Frequency of occurrence (FO%) and relative abundance (RA%) of
the 23 food items consumed by males and females of the sand goby
Pomatoschistus minutus in Minho estuary, NW Iberian Peninsula. NI =
Non-identified.
104
Table 5.4 SIMPER percentages of the food items that most contributed to
the differences of the diet between males and females of the sand goby
Pomatoschistus minutus in the lower Minho estuary (NW Iberian Peninsula).
105
Table 5.5 Mean density of the sand goby Pomatoschistus minutus in
different locations in Atlantic estuaries.
108 Table 6.1 Two-way PERMANOVA results on the effects of sampling stations
and seasons and their interaction term on the abiotic variables in Minho estuary, NW Iberian Peninsula. ns = non-significant; * = p < 0.05; ** = p < 0.01; *** = p < 0.001. Different letters indicates significant differences among them. Lower case letters refers to comparisons among seasons, while upper case letters in brackets refers to comparisons among sampling stations (Two-way PERMANOVA, pairwise test for the interaction effect: p < 0.05).
124
Table 6.2 Comparisons on the density (mean ± SE) of males and females of
the European flounder Platichthys flesus among five sampling stations and four seasons in Minho estuary, NW Iberian Peninsula. ns = non-significant; * = p < 0.05; ** = p < 0.001. Different letters indicates significant differences among them. Lower case letters refers to comparisons among seasons, while upper case letters in brackets refers to comparisons among sampling stations (Two-way PERMANOVA, pairwise test for the interaction effect: p < 0.05).
128
Table 6.3 Comparisons on the standard length (mean ± SE) of males and
females of the European flounder Platichthys flesus among sampling stations and seasons in Minho estuary, NW Iberian Peninsula. ns=
xxvi significant; *= p < 0.05; ** = p < 0.01 ***= p < 0.001. Different letters indicates significant differences among them. Lower case letters refers to comparisons among seasons, while upper case letters in brackets refers to comparisons among sampling stations (Two-way PERMANOVA, pairwise test for the interaction effect: p < 0.05).
Table 6.4 Comparison of the values obtained by length and weight
relationship of the European flounder Platichthys flesus in different locations.
132
Table 7.1 Size of maturity of the five numerically dominant demersal
species in the lower Minho estuary, NW Iberian Peninsula.
148 Table 7.2 Values of the five environmental variables (mean ± SE) measured
in the three sampling stations throughout the seasons in the lower Minho estuary, NW Iberian Peninsula and the Two-way PERMANOVA results on the effects of sampling stations and seasons and their interaction term. * = p < 0.01; ** = p < 0.001; ns = non-significant. Different letters indicates significant differences among them. Lower case letters refers to comparisons among seasons, while upper case letters in brackets refers to comparisons among sampling stations (Two-way PERMANOVA, pairwise test: p < 0.05).
151
Table 7.3 Three-way PERMANOVA results comparing the density of life
stages (juveniles and adults) of the five most abundant demersal species (Carcinus maenas, Crangon crangon, Pomatoschistus microps, P. minutus and Platichthys flesus) in Minho estuary (NW Iberian Peninsula) among sampling stations (S1, S2 and S3) and seasons (Spring, Summer, Autumn, Winter). ns = non-significant p value. * Pairwise tests among life stages using the t-statistic on Pseudo-F values for detecting significantly differences in density of juveniles and adults.
153
Table 7.4 Three-way PERMANOVA results comparing the biomass of life
stages (juveniles and adults) of the five most abundant demersal species (Carcinus maenas, Crangon crangon, Pomatoschistus microps, P. minutus and Platichthys flesus) in Minho estuary (NW Iberian Peninsula) among sampling stations (S1, S2 and S3) and seasons (Spring, Summer, Autumn, Winter). ns = non-significant p value. * Pairwise tests among life stages using the t-statistic on Pseudo-F values for detecting significantly differences in biomass of juveniles and adults.
xxvii
Table 7.5 Summary of the information regarding the five most abundant
demersal species in Minho estuary, NW Iberian Peninsula.
169 Table 8.1 Carapace variables and ratios (mean ± SD) of Carcinus maenas
color morphotypes and sexes in Minho estuary. S.L. = Significance level; CW = carapace width; PL = propodus length; RC = right chelae; LC = left chelae. NS = non-significant; * = S.L. < 0.05; ** = S.L. < 0.01; *** = S.L. < 0.001; a = ratio times 1000.
184
Table 8.2 Differences in chelae (right and left) ratios (mean ± SD) of
Carcinus maenas males and females between immature (CW < 30 mm) and
mature (CW > 30 mm) individuals from the lower Minho estuary. S.L. = Significance level; CW = carapace width; RC = right chelae; LC = left chelae; NS = non-significant; * = S.L. < 0.05; ** = S.L. < 0.01; *** = S.L. < 0.001; a = times 1000.
186
Table 8.3 Differences in chelae (right and left) ratios (mean ± SD) of mature
(CW > 30 mm) Carcinus maenas (males and females) between sampling stations in the lower Minho estuary. S.L. = Significance level; CW = carapace width; RC = right chelae; LC = left chelae; NS = non-significant; *= S.L. < 0.05; **= S.L. < 0.01; a = times 1000.
188
Table 9.1 Elements of the model and their respective values, symbols,
description, units and their estimation method and initial values used on the model, when applied. NSJ = newly settled juveniles.
208
Table 9.2 Equations used in the model of the population dynamics of the
shore crab Carcinus maenas in Minho estuary, NW Iberian Peninsula
211
Table 9.3 Sensitivity (sensu Jørgensen 1994) of the population density to ±
10% variations of the parameters used on the population dynamics model of the shore crab Carcinus maenas in Minho estuary, NW Iberian Peninsula.
218
Table 9.4 Linear regressions between the observed and the predicted
values for the C. maenas density inside Minho estuary, NW Iberian Peninsula.
219
Table 10.1 Elements of the model and their respective values, symbols,
description, units and their estimation method and initial values used on the model, when applied.
240
Table 10.2 Equations used in the model of the population dynamics of the
common goby Pomatoschistus microps in Minho estuary, NW Iberian Peninsula.
xxviii
Table 10.3 Sensitivity (sensu Jørgensen 1994) of the population density to
± 10% variations of the parameters used on the population dynamics model of the common goby Pomatoschistus microps in Minho estuary, NW Iberian Peninsula.
249
Table 10.4 Linear regressions between the observed and the predicted
values for the common goby P. microps density inside Minho estuary, NW Iberian Peninsula.
xxix
Summary
Population dynamics is a field of ecology which studies how a population of a given species varies through time according to intrinsic and extrinsic driven forces. This ecology domain is responsible for describing the dynamic response of species to a continuously changing environment. Estuaries are one of the most ecological-rich and dynamic systems on Earth, once they are located in the threshold of marine and freshwater systems, accumulating nutrients from both systems, and hence functioning as nutrient traps. Therefore, estuaries are submitted to a continuous chemical and physical water mixing processes, which makes them complex systems. For this reason, estuaries are characterized by a few number of species, which are often highly abundant and geographically widespread. These species are known as core species, and they present a remarkably interesting opportunity to study the effects of environmental driven forces in populations, since most of them are able to tolerate a wide range of environmental pressures, but often respond differently to stressors. In this context, the present work aimed at assessing the population dynamics of four core species from European estuaries, namely the shore crab Carcinus maenas, the common and the sand gobies Pomatoschistus microps and P. minutus and the European flounder Platichthys flesus and to construct ecological models, in order to predict how these species will cope with the effects of rising water temperature and salinity variations promoted by global climate change. To achieve this, epibenthic organisms were sampled during 18 consecutive months at Minho estuary (NW Iberian Peninsula). Overall, the population dynamics studies revealed that the four core species were more abundant during autumn and reproduce either continuously (C. maenas), once (P. minutus and P. flesus) or twice a year (P.
microps) in Minho estuary. Three of the four studied species (P. microps, P. minutus and P. flesus) presented density values higher than in other European
systems. However, the production values recorded in the present work were not significantly higher than in other estuaries, since the core species populations were dominated by juveniles. One exception was the gobies’ populations, which were dominated by adults and also presented higher production compared to nearby systems. The present work also highlighted that each estuarine section has its own community structure and dynamics and hence were dominated by different species throughout the year cycle. In areas in the vicinity of the sea, the crustaceans seemed to flourish, while near the threshold of marine water
xxx intrusion, estuarine fishes appeared to outnumber crustaceans. Notwithstanding, we were able to demonstrate that different estuarine sections within an estuary can sustain morphologically different individuals of a given species, which was the case of the shore crab, that presented structural differences in their carapace thickness between close areas within Minho estuary. Finally, the modeling approach suggests how two of the most important species in the system will respond to changes in water temperature and salinity. The C. maenas population probably will increase in the near future due to rising water temperature, while changes in salinity will cause minor effects on the population, due to the wide salinity tolerance and the high osmoregulatory skills of the species. On the other hand, the common goby population probably will decrease as a direct response to temperature increase in the next decades, whereas changes in salinity will have important consequences for the P. microps population, due to the positive response towards an increased freshwater input and a negative response triggered by a salinity increase.
xxxi
Resumo
A dinâmica populacional é um campo da Ecologia que estuda como uma população de determinada espécie varia ao longo do tempo de acordo com pressões ambientais intínsecas e extrínsecas. Este ramo de Ecologia é responsável por descrever as variações ao longo do tempo de populações animais e vegetais num ambiente em constante transformação. Os estuários são um dos sistemas mais produtivos e dinâmicos da Terra, uma vez que eles estão localizados no limite dos sistemas marinhos e duceaquícolas, acumulando nutrientes oriundos de ambos os sistemas, funcionando como acumuladores naturais de nutrientes. Devido às variações diárias e sazonais a que estão sujeitos, os estuários são sistemas complexos, onde apenas algumas espécies subsistem. Na realidade, os estuários abrigam um pequeno número de espécies, que frequentemente são muito abundantes e de ampla distribuição geográfica. Estas espécies são conhecidas como espécies centrais, e constituem uma oportunidade extremamente interessante para o estudo dos efeitos de variáveis ambientais sobre as suas populações, uma vez que a maioria destas espécies são capazes de tolerar uma ampla gama de gradientes e pressões ambientais, respondendo, contudo, de maneira diferente à cada uma destas pressões. Neste contexto, o presente trabalho teve como objetivo avaliar a dinâmica populacional de quatro espécies centrais de estuários europeus, nomeadamente o caranguejo verde Carcinus maenas, o caboz comum e da areia, respectivamente,
Pomatoschistus microps e P. minutus e a solha das pedras Platichthys flesus, bem
como desenvolver modelos ecológicos capazes de prever a variação destas espécies sob condições de aumento de temperatura da água e variação da salinidade, promovidas pelas alterações climáticas globais. Para isso, os organismos epibentónicos foram amostrados durante 18 meses consecutivos no estuário do Minho (NO da Península Ibérica). Em geral, os estudos de dinâmica populacional revelaram que as quatro espécies estudadas foram mais abundantes durante o outono e reproduziram continuamente (C. maenas), uma vez (P.
minutus e P. flesus) ou duas vezes por ano (P. microps). Três das quatro espécies
estudadas (P. microps, P. minutus e P. flesus) apresentaram valores de densidade mais elevados do que em outros sistemas europeus. No entanto, os valores de produção registados no presente trabalho não foram significativamente maiores do que em outros estuários, uma vez que as populações destas espécies no estuário do Minho foram maioritariamente compostas por jovens. Exceto a
xxxii população de cabozes, que foi predominantemente composta por adultos, apresentando também valores de produção secundária superiores quando comparados com sistemas próximos. Os presentes resultados sugerem ainda que cada seção estuarina possui uma estrutura e dinâmica de comunidade próprias, sendo dominadas por diferentes espécies ao longo do ano. Em áreas próximas ao mar, os crustáceos pareceram ser dominantes, ao passo que próximo ao limite de intrusão de água marinha, os peixes estuarinos foram mais bem-sucedidos do que os crustáceos. Além disto, os presentes resultados também indicaram que diferentes seções estuarinas podem sustentar formas morfologicamente diferentes de uma determinada espécie, como no caso do caranguejo-verde, que apresentou diferenças estruturais na espessura da carapaça entre áreas próximas dentro do estuário do Minho. Finalmente, os modelos ecológicos simularam cenários possíveis da variação de duas das espécies mais importantes do sistema como resposta às mudanças de temperatura e salinidade da água. A população de C. maenas provavelmente aumentará num futuro próximo, devido ao aumento da temperatura da água, enquanto as variações na salinidade causarão efeitos menores sobre a população, devido à ampla tolerância às variações de salinidade e às capacidades osmorregulatórias desta espécie. Por outro lado, a população do caboz-comum provavelmente irá diminuir em resposta direta ao aumento da temperatura nas próximas décadas, enquanto as alterações na salinidade terão consequências importantes para a população P. microps, devido à resposta positiva em relação a um aumento da entrada de água doce no sistema e também a uma resposta negativa provocada pelo um aumento da salinidade.
C
HAPTER1
3
1.1. Estuaries and climate change
Estuaries are defined as a semi-enclosed coastal body of water with one or more rivers or streams flowing into it, and with a free connection to the open sea (Pritchard, 1967). These systems are among the most complexes, productive and valuables ecosystems on Earth (Costanza et al. 1997; McLusky and Elliot 2004). A number of aquatic species, belonging to different taxonomic groups, inhabit estuarine areas for different periods of their life cycle. Some species are residents, remaining inside the estuary during their entire life cycle (Elliott et al. 2007); while others are migratory or transitory, using the estuary during shorter periods of time, on their way to the spawning grounds, where reproduction and/or juveniles’ recruitment take place (Claridge et al. 1986; Potter et al. 1997). Actually, several species use estuaries as nursery grounds (Beck et al. 2001; Peterson 2003), since they provide abundant prey resources and low predation risk for juveniles (Joseph 1973). Therefore, sexually immature individuals can enhance their feeding and growth rates (Houde 1989; Cabral et al. 2007; Martinho et al. 2007a) inside estuaries.
In addition to their high ecological value, estuarine systems have a significant socio-economical importance, since in its waters and/or adjacent areas, fishery, aquaculture, salt mining, tourism, among other economic activities take place (Kennish 2002; Svensson et al. 2007; Vasconcelos et al. 2007). Despite its high ecological and socio-economical value, estuaries are currently subjected to stress caused by a wide variety of anthropogenic activities, including nutrient over-enrichment (Pardal et al. 2000; Nixon 2009), habitat loss (Nicholls et al. 1999; Castro and Freitas 2006), over exploitation of natural resources (Blaber et al. 2000; Vasconcelos et al. 2007; Ferguson et al. in press), introduction of invasive species (Levin and Crooks 2011), altered freshwater inflow (Whitfield and Bruton 1989; Hallim 1991; Ferguson et al. in press), pollution (Matthiessen and Law 2002) and climate change (Henderson et al. 2006; Thorne et al. 2012).
Among all threats posed by anthropogenic activities over estuaries, climate change is certainly one of the most difficult to predict and, thus, to manage, since it occurs in a global scale, affecting uniquely different geographic regions (see IPCC 2007). This phenomenon is considered a direct result of varied human activities and currently is one of the most controversial topics in environmental sciences, ecology, and governance (Halpern et al. 2007; 2008). Climate change will affect oceanic and coastal systems in various ways (Kjerfve et al. 1994): through changes in temperature, sea level, ocean circulation, storminess and
4 hence vertical mixing and wave regimes. Therefore, climate change will significantly influence and modify aquatic ecosystems. In this context, one can expect changes in nutrient availability, biological productivity, phenology (the timing of biological events such as spawning), population biogeography, community structure, and predator-prey relationships from the bottom to the top of the food web (Philippart et al. 2007).
1.2. Climate change signals in Southern Europe and their potential impacts on estuaries
Climate change is already affecting several parts of Europe, contributing to a wide range of impacts on society and in the environment (EEA 2012). The recent climate change predictions made by the Intergovernmental Panel on Climate Change (IPCC) suggest that the air temperature across the continent will increase at a rate of 0.1 to 0.4ºC per decade, with the warming being stronger at southern Europe and northeast Europe (IPCC 2007). Also, it is predicted that winters currently classified as cold will become rarer, while hot summers will occur in a much higher frequency (IPCC 2007). It is also expected that the precipitation will change in southern Europe causing drier summers (5% drier per decade) and wetter winters (1 to 4% wetter per decade) (IPCC 2007). Additionally, it is expected that the sea level will rise (13-68 cm by the 2050s) and heat waves will increase in frequency and length throughout Europe (IPCC 2007).
If the IPCC predictions about temperature increase prove correct, southern European estuaries will warm in the near future, and these climatic changes may trigger a cascade of events within estuaries that ultimately will affect the entire biological community. For instance, changes in water temperature can influence the oxygen solubility (Henry’s law), water stratification and mixing (Stefan et al. 1998). These processes can cause oxygen depletion on the estuarine bottom, which may to lead to massive die-offs of aquatic organisms (Diaz and Rosenberg, 1995). Moreover, the low oxygen can also contribute to changes in the water quality, altering the levels of ammonia, nitrate and phosphorus in the water column (see Whitehead et al. 2009). Also, the mix of the nutrient-rich bottom waters with the surface water could lead to algal blooms (see Whitehead et al. 2009).
Changes in precipitation probably will affect the river discharge of southern European estuaries. The wetter winters and drier summers probably will cause a higher number of floods and droughts in estuaries (IPCC 2007). A reduction in
5 river discharge will also produce a decrease in the nutrient supply for estuarine organisms, since the river flow provides and transports both dissolved and particulate organic matter (Meybeck 1982). Also, the decrease in precipitation probably will change the seawater intrusion within estuaries, with seawater reaching more often the upper portions of estuaries and increasing its influence near the river mouth. Conversely, an increase in precipitation probably would cause higher river run-offs, which in turn ultimately may cause changes in water salinity, stratification, turbidity, nutrient availability and sediment erosion.
All abovementioned changes in physical and chemical characteristics of estuaries will certainly affect the aquatic species inhabiting these systems. Thus, it should be expected that significant changes in estuarine communities will occur in response to climate changes.
1.3. Relationships of climate change, population dynamics and ecological modeling
Estuaries are one of the most studied ecosystems (e.g. Gaston and Nasci 1988; Day et al. 1989; McLusky 1999); however, most studies focused on the impacts of anthropogenic disturbances while only a few attempted to investigate population dynamics of estuarine species (e.g. Baeta et al. 2005; Sant’anna et al. 2009) and the effects of climate change (e.g. Henderson et al. 2006). In this context, it is important to know the dynamics and productivity of estuarine species, in order to make predictions regarding the imminent impacts of climate change on European estuarine systems.
Some estuarine species are highly abundant along a wide geographic area in Europe, which makes them core-species in their habitats and hence suitable as target-species for such an approach. Yet only few studies took place near the edges of the geographic distribution, and those probably are the areas where species are most vulnerable to climate change. Although traditional methods of field research are the only way of describing population dynamics, generalizations are limited and only reliable within the range of observations. Moreover, models are a more reliable tool to link population dynamics to environmental conditions and to make long-term predictions. Therefore, modeling approaches have gained notability by enabling extrapolations (Clark 2005).
Population dynamics models simulate the species dynamics over time, taking as state variables the abundance or biomass of individuals or species, addressing
6 aspects of age and/or population groups (juveniles, males and females), growth and recruitment. Populations vary over time according to different parameters such as age class distribution, rates of birth, mortality, dispersal, and growth. In addition, environmental factors (e.g. temperature, salinity, availability of resources and food) are included in the models, influencing population dynamics, through their effects on population processes. Finally, whenever validated, ecological models allow formulating predictions under different environmental scenarios including climate change, extreme weather events, etc.
1.4. Case study: Minho estuary (NW Iberian Peninsula)
The field campaigns for the present work were performed in Minho estuary (41º52’N, 8º52’W), which covers about 23 km2 in the area of the northern Portuguese-Spanish border (Fig. 1.1). The estuary extends from 70 km upstreams, with tidal influence reaching the first 40 km, while the uppermost 30 km being classified as a tidal freshwater wetland (Souza et al. 2013).
Fig. 1.1 Location of the Minho estuary in the northern Portuguese-Spanish border
(NW Iberian Peninsula).
The aquatic resources of Minho estuary have long been explored (see Sousa et al. 2008a and the references therein), however only during the last decade; several studies have focused the ecology of aquatic communities in the Minho estuary. During this period, the aquatic fauna have been investigated, with particular focus on macroinvertebrates (e.g. Sousa et al. 2005; 2007; 2008b; Ilarri et al. 2012), crustaceans (e.g. Freitas 2011; Souza et al. 2011; Sousa et al. in press)
7 fishes (e.g. Freitas et al. 2009; Morais et al. 2011; Sousa et al. 2012a; Souza et al. 2013) and birds (Dias et al. 2012). Several studies reported that, in the Minho estuary, different species present higher density and/or production compared to nearby estuaries (e.g. Sousa et al. 2005; 2007; 2008b; Freitas et al. 2009; Souza et al. 2013), suggesting that the Minho estuary has a significant ecological value in Southern Europe, probably due to higher habitat preservation when compared to other systems (Sousa et al. 2008a).
Nevertheless, Minho estuary has been under different anthropogenic threats in the recent years, such as biological invasions (e.g. Sousa et al. 2007; Ilarri et al. 2012), floods (e.g. Sousa et al. 2012b) droughts (e.g. Dolbeth et al. 2010) and heatwaves (e.g. Ilarri et al. 2011; Sousa et al. 2011), which have caused noteworthy alterations in the ecosystem. Actually, there are records of abnormal climatic events (floods and droughts) since 1953, with 8 droughts (3 moderate, 3 severe and 2 extreme) and 5 floods (1 moderate, 2 severe and 2 extreme) being recorded from 1953 to 2010 (Fig. 1.2). Interestingly, the last two droughts in Minho estuary (2004 and 2008) were extreme and appear to have lasted longer than previous events.
Fig. 1.2 Monthly variation of the Standard Precipitation Index (SPI) in Minho
estuary (NW Iberian Peninsula) from 1953 to 2010. Arrows indicate abnormal climatic events (white arrows = droughts; black arrows = floods). Source: Integrated Climate Data Center (http://icdc.zmaw.de).
Nevertheless, river discharge did not follow, exactly, the same pattern of floods and droughts as reported by the SPI. For instance, in 2002 the river discharge was low, but the SPI indicated that this year had precipitation values above the
-3
-2,5
-2
-1,5
-1
-0,5
0
0,5
1
1,5
2
2,5
3
53 56 59 62 65 68 71 74 77 80 83 86 89 92 95 98 01 04 07 10
S
P
I
-
S
tand
ar
d
P
re
cip
itat
ion
In
d
ex
Extremely wet Severely wet Moderately wet Extremely dry Severely dry Moderately dry8 average (Fig. 1.3). The mismatch between SPI and the river discharge may be probably caused by the presence of five dams along the river extension (Peares, Belesar, Velle, Castrelo and Frieira), which manage the water discharge according to needs for electrical power production.
Fig 1.3. Monthly values of river discharge (dam3) from 1991 to 2010, with indication of the average value for the period of 1990 to 2010. Arrows indicate abnormal climatic events (white arrows = droughts; black arrows = floods). Source: Sistema Nacional de Informação de Recursos Hídricos - SNIRH (www.snirh.pt).
Also, since the 80’s, that the air temperature in Minho estuary seem to have increased, with the 90’s and the years after 2000 being 0.58ºC and 0.66ºC warmer than the average, respectively (Fig. 1.4).