STORCK, L. et al.
1458
EXPERIMENTAL PRECISION IN CORN TRIALS
USING THE PAPADAKIS METHOD
Precisão experimental dos ensaios de milho pelo método de Papadakis
Lindolfo Storck1, Sidinei José Lopes2, Alberto Cargnelutti Filho2, Alessandro Dal’Col Lúcio2, Marcos Toebe3
ABSTRACT
The objective of this work was to verify whether the use of the Papadakis method in competing corn hybrid trials would lead to modifications in the validity of assumptions for the mathematical model of variance analysis and for experimental precision indicators. To achieve this, corn-grain-yield data from 25 competing corn hybrid trials, performed in a design of complete randomized blocks, were examined. Each trial entailed verification of assumptions, variance analysis, hypothesis tests, statistics to identify experimental precision, and analysis using the Papadakis method. This method improves experimental precision indicators. The assumptions were valid for both analysis types (without Papadakis and with Papadakis). Mean figures for the Fasoulas differentiation index increased from 8.5 to 20.7 and selective precision rose from 0.82 to 0.92. Trials with three repetitions analyzed using the Papadakis method enabled the identification of superior corn hybrids in relation to grain yield, with 86.5% precision. To maintain the same precision in conventional analysis, four times the number of repetitions would be necessary.
Index terms:Zea mays L., assumptions, precision measurements, spatial analysis.
RESUMO
Objetivou-se, no trabalho, verificar se há modificações em relação ao atendimento dos pressupostos do modelo matemático da análise de variância e indicadores de precisão experimental, com a aplicação do método de Papadakis, em ensaios de competição de híbridos de milho. Para isso, foram usados os dados de produtividade de grãos de milho de 25 ensaios de competição de híbridos, conduzidos no delineamento blocos completos ao acaso. Em cada ensaio, foram realizadas: a verificação dos pressupostos, a análise de variância, os testes de hipóteses, estatísticas para identificação da precisão experimental e a análise pelo método de Papadakis. O método de Papadakis melhora os indicadores de precisão experimental. Os pressupostos não foram violados para os dois métodos de análise (sem Papadakis e com Papadakis). A média do índice de diferenciação de Fasoulas aumentou de 8,5 para 20,7 e a acurácia seletiva de 0,82 para 0,92. Ensaios com três repetições analisados com o método de Papadakis possibilitam a identificação de híbridos superiores de milho em relação à produtividade de grãos, com 86,5% de precisão. Para manter a mesma precisão na análise usual seria necessário o quádruplo do número de repetições.
Termos para indexação:Zea mays L., pressupostos, medidas de precisão, análise espacial.
(Received in august 7, 2009 and approved in july 28, 2010)
1Universidade Federal de Santa Maria/UFSM – Departamento de Fitotecnia – Avenida Roraima – s/n – Camobi – 97105-900 – Santa Maria, RS – [email protected]
2Universidade Federal de Santa Maria/UFSM – Departamento de Fitotecnia – Santa Maria, RS 3Universidade Federal de Santa Maria/UFSM – Santa Maria, RS
INTRODUCTION
Genetic differences between corn hybrids such as grain yield and other characteristics observed in trials are important, as these results may be applied to crop production. Failure to identify the superiority of a hybrid due to the lack of experimental precision in trials has a negative impact on crop yield, since the result of such tests are used to recommend hybrids to be grown by producers.
In order to obtain acceptable levels of experimental precision in trials, the necessary procedures include understanding the soil uniformity from experimental area, establishing a suitable experimental design, defining the number of repetitions and plot sizes, and ensuring uniform
Experimental precision in corn trials... 1459 The Papadakis method (Papadakis, 1937) consists
of adjusting the values obtained in the plots in accordance with the mean experimental errors between neighboring plots, considered covariate, in order to decrease experimental error variance. The most suitable covariate is the estimate of errors between reference plots and their closest neighbors (to the left, right, front and back) (Cargnelutti Filho et al., 2003).
The use of the Papadakis method for 226 soybean trials, with diverse environments and genetic material, has shown to be efficient at improving experimental precision indicators (Storck et al., 2008, 2009). The method, according to Cargnelutti Filho et al. (2003), provided gains in precision in a study involving five corn trials. The degree of efficiency of the Papadakis method for experiments with different corn hybrids, carried out over a sequence of years in the same experimental area, is still not well known.
The aim of this work was to verify whether the use of the Papadakis method in competing corn hybrid trials would lead to modifications in the validity of assumptions about the mathematical model of variance analysis and experimental precision indicators.
MATERIAL AND METHODS
Data on corn-grain yield was collected from 25 experiments of competing hybrids—super-early, early, and normal cycles—with a varied number of hybrids per experiment for the crop years 1998/1999 to 2007/2008 (Table 1). All the trials were carried out in the same experimental area, located on the east side of the meteorological station of the Plant Science Department at the Federal University of Santa Maria, in Santa Maria, Rio Grande do Sul, Brazil (latitude 29º42S, longitude 53º49W and 95 m altitude). The trials featured randomized block design and three repetitions. The experimental units were comprised of two 5-m-long rows, spaced 80 cm centimeters apart.
Variance analyses were conducted on the grain yield data from each experiment, with hypothesis tests at 5% probability for blocks and hybrids. Estimates were made of the relative efficiency of the use of blocks, the average per hybrid, the overall average (
m
ˆ
), and the amplitude (H) between averages. The coefficient of variation (CV) and minimum significant difference between hybrids were also estimated, using the Tukey test at 5% probability (D), , , in which is the Tukey test table value, I is the number of hybrids, DFE is the degree of freedom of the error, MSE is the estimate of experimental error (Mean Square Error), and J is the number of repetitions (blocks). The minimum significant difference between hybrids, according to the Tukey test, expressed( ; ;I DFE) E/
D q MS J
as a percentage of the average (MSD), was obtained for. To assess experimental precision, the Fasoulas differentiation index (FDI) (Fasoulas, 1983) was also calculated, which is estimated in the expression
( ; ;I DFE) q
ˆ MSD 100 D/m
2 2 2
ˆg ˆg/(ˆ ˆg) , in which ˆ2 ( ) /
g MSg MSE J and ˆ2
E
MS
. The minimum number of measurements (repetitions = blocks = J) required to predict the real value of the individuals (hybrids), based on determination or pre-established precision (R2), was obtained in accordance
with Cruz & Regazzi (1997). In other words, the J value for one data point R2 was: J(R2) =
(1-g)R2/ g(1-R2). Error values for each experimental unit were estimated by considering the randomized block design (observed value minus overall mean, less block and hybrid effects). The error values were used to apply the normality Lilliefors test (Sprent & Smeeton, 2007). For the random error test, or sequence test (Sprent & Smeeton, 2007), the number of sequences of positive and negative errors followed a pre-established path. The test statistic, equal to the number of times in which a sign is changed by another as it passes through the sequence of errors in the experimental plots, was tested for approximation to a standard normal distribution. The Bartlett test (Steel et al., 1997) was applied to verify the homogeneity of the error variance between hybrids. The additivity of the mathematical model was verified using the non-additivity test of the Tukey mathematical model (Snedecor & Cochran, 1989). The hypotheses about the assumptions (normality, randomness, homogeneity, and additivity) were tested at 5% probability.
The errors were also estimated considering the completely randomized design (value observed minus overall mean and the hybrid effect). Using these values, the mean error for each experimental unit was estimated as the mean between the error of the unit in question and the errors of its existing, neighboring experimental units (to its right, left,
n
i i 1
FDI 200 m /[n(n 1)]
The value of the statistic R2 was established by the
coefficient of determination (Cargnelutti Filho & Storck, 2007), expressed by R2=MS
g/(MSg+MSE), where MSg is
the squared mean of hybrids. In addition, selective accuracy (SA) was estimated as follows: SA=(1-1/F)1/2, in
which F is the F test value for hybrids (Resende & Duarte, 2007; Cargnelutti Filho & Storck, 2009).
Considering the evaluations in each block as measurements performed on the same individual (hybrid), the intra-class correlation coefficient for hybrids, or repeatability coefficient (variance analysis method), was estimated: cultivars in the trial and mi is the number of averages that the i-th hybrid statistically exceeds after applying the Tukey test.
STORCK, L. et al. 1460
front, and back) (Cargnelutti Filho et al., 2003). The value for the mean error was deemed a covariate for the purpose of covariance analysis, in accordance with the completely randomized design (Steel et al., 1997; Storck et al., 2008), which corresponds to the use of the Papadakis (1937) method. Covariate values were submitted to variance analysis, in accordance with the random block design, and tested against the assumptions for normality, randomness, and homogeneity of variance.
The covariance analysis, with hypothesis tests for the effects of the covariate and adjusted hybrids, was carried out in accordance with Steel et al. (1997), and with estimates made of: amplitude (H) between means of adjusted hybrids, CV, D, MSD, FDI, R2, SA, , and J(R2).
The relative efficiency of covariate use in relation to the use of randomized block design was also estimated, and assumption hypotheses were tested (normality, randomness, and homogeneity of variance) regarding error in this model and the parallelism between hybrids, with respect to the covariate response (Seber, 1976). For all calculations, a specific program in Pascal language was prepared and compiled.
RESULTS AND DISCUSSSION
Over the ten years in which the 25 trials were conducted in the same experimental area, the average crop yield was 7.49 t ha-1, ranging between 4.42 and 10.86 t ha-1
(Table 1). These results reflect annual variations in both
Table 1 – Corn grain yield (t ha-1), mean square of block (MS
B), hybrid (MSg), and error (MSE), without using the
Papadakis method vs. year of harvest, cycle, and number (I) of hybrids evaluation in trials in Santa Maria.
* Significant for F test at 5% probability.
ˆg
Trial Year Cycle I t ha-1 MSB MSg MSE
Experimental precision in corn trials... 1461 the environment and the composition of hybrids in the
trials, as each hybrid was assessed, in general, for two consecutive years. In 12 trials (48%), the effect of blocks was significant (Table 1), which also indicates that variability was controlled in the experimental area.
The variation among hybrids, significant in 80% of experiments, and the occurrence of flaws in the assumptions (normality, randomness, homogeneity of variance and mathematical model additivity) (Table 2) was close to that found in the study of 307 corn trials (Marques et al., 2000), which does not constitute a reason to restrict the interpretation of results.
In all trials, the covariant (mean error in neighboring experimental units) was not significantly dependent on the hybrid effect (Table 2). This fact shows that the differences between the treatments was independent of covariant values, a prerequisite to proceed with analyzing covariance and adjusting hybrid averages in line with the covariant means (Steel et al., 1997). Furthermore, the assumptions of randomness and homogeneity of variance were validated. However, a lack of covariant normality was observed in five trials (20%), more than that observed (8%) for the variable grain yield error; this difference has also been seen in soybean trials (Storck et al., 2008). The blocks were heterogeneous in relation to the covariant in 60% of
trials, higher than that observed (38.9% of trials) in soybeans (Storck et al., 2008).
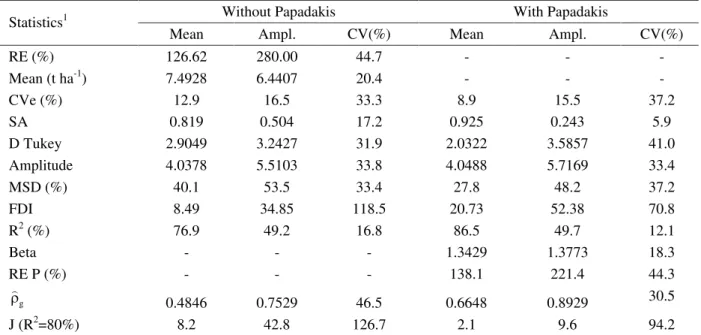
Mean relative efficiency in the use of blocks was 126.6% (Table 3), due to the 48% of trials with heterogeneous blocks. For soybean trials, Storck et al. (2008) calculated mean relative efficiency of 134.5% in just 28.8% of trials with heterogeneous blocks. This may be explained by the greater number of hybrids per block in the corn trials (Table 1) when compared with those for soybeans.
The application of the Papadakis method raised the proportion of trials with significant hybrid effect from 80% to 96% (Table 2); in 96% of the trials, the covariant effect was also significant. The use of the Papadakis method improved all experimental precision measures: reducing the mean coefficient of variation (CV) from 12.9% to 8.9%; reducing the mean minimum significant difference among hybrids, according to the Tukey test, from 2.90 t ha-1 to
2.03 t ha-1; reducing the mean minimum significant difference
among hybrids, according to the Tukey test and expressed as a percentage of the mean (MSD), from 40.1% to 27.8%; increasing mean selective accuracy (SA) from 0.819 to 0.925; increasing the mean Fasoulas differentiation index (FDI) from 8.49 to 20.73; and increasing the model’s coefficient of determination from 76.9% to 86.5% (Table 3). Similar variations in these precision measures were obtained for 226 soybean trials (Storck et al., 2008).
Table 2 – Number of cases in which different null hypotheses were rejected at 5% probability for analysis of variance (ANOVA), for covariant of Papadakis method, and for analysis using the Papadakis method, in 25 trials of competing corn hybrids.
Hypothesis about ANOVA Covariant Papadakis Blocks 12 (48%) 15 (60%) - Hybrids 20 (80%) 0 24 (96%) Covariant - - 24 (96%) Normality (N) 2 5 4 Randomness (Al) 0 0 0 Homogeneity (H) 1 1 2 Additivity (Ad) 2 - - N and Al 0 0 0 N and H 0 1 0 N and Ad 1 - - Al and H 0 0 0 Al and Ad 0 - - H and Ad 0 - - Parallelism of covariant - - 10*
STORCK, L. et al. 1462
Notably, selective accuracy (SA), an experimental precision measure appropriate for use in corn trials (Cargnelutti Filho & Storck, 2009), showed that precision was very high (SA 0.90) in 32% of the trials without the use of the Papadakis method. On the other hand, when the Papadakis was used, very high precision was observed in 76% of trials, which indicates the importance of using the Papadakis method to improve experimental precision. As well as raising mean selective accuracy, using the Papadakis method also reduced the variation amplitude and coefficient of variation of this precision measure; that is, experimental precision became more homogeneous and higher, which can also be seen in the FDI and R2 precision
measures.
On average, the use of the Papadakis method was 38.1% more efficient than that of the random block design model, as relative efficiency (RE P, Table 3) was equal to 138.1%, with variation of between 53.2% and 274.6% and a CV of 44.3%. Another aspect that favors the Papadakis method is that the error assumptions (normality, randomness, and homogeneity of variance) with the covariance analysis model were not fulfilled in similar
Table 3 – Mean amplitude (Ampl.) and coefficient of variation (CV) for different estimated statistics in trials of competing corn hybrids (grain yield, t ha-1) related to the use of the Papadakis method.
1RE = relative efficiency of the use of blocks; CVe = experimental error coefficient of variation; SA = selective accuracy; D Tukey =
minimum significant difference using Tukey test (5%); Amplitude = amplitude between means; MSD = D Tukey as a percentage of the mean; FDI = Fasoulas differentiation index; R2 = model’s coefficient of determination; Beta = effect of covariant, coefficient
of linear regression; RE P = relative efficiency of the use of the Papadakis method; ˆg = coefficient of repeatability; J(R2=80%) =
number of repetitions related to establishment or precision of 80%.
proportions to those found when using the random block design model (Table 2).
The mean linear regression coefficient (covariant effect, Beta) was 1.343, with amplitude of 1.377 (Table 3), indicating that grain yield values may vary significantly in 96% of the trials, upward or downward, with varying intensity in different trials. For every additional unit in the covariant (mean error for neighboring plots), plot value rises 34.3% (multiplied by 1.343), a lower value (1.44) than that obtained for soybean trials (Storck et al., 2008). However, for 60% of trials, the response (Beta value) was not parallel among the hybrids (Table 2). The lack of parallelism indicates that the hybrids of a given trial experience varying intensities of mean adjustment, depending on the coefficient of regression for each hybrid, with the mean adjustment taking place with the same coefficient of regression for all hybrids. This concern was also reported by Storck et al. (2008) for soybean trials, where parallelism was not observed in 49% of trials.
In the repeatability analysis, the mean value for the intra-class correlation coefficient ( ) estimated using theˆg Without Papadakis With Papadakis
Statistics1
Mean Ampl. CV(%) Mean Ampl. CV(%) RE (%) 126.62 280.00 44.7 - - - Mean (t ha-1) 7.4928 6.4407 20.4 - - -
CVe (%) 12.9 16.5 33.3 8.9 15.5 37.2 SA 0.819 0.504 17.2 0.925 0.243 5.9 D Tukey 2.9049 3.2427 31.9 2.0322 3.5857 41.0 Amplitude 4.0378 5.5103 33.8 4.0488 5.7169 33.4 MSD (%) 40.1 53.5 33.4 27.8 48.2 37.2 FDI 8.49 34.85 118.5 20.73 52.38 70.8 R2 (%) 76.9 49.2 16.8 86.5 49.7 12.1
Beta - - - 1.3429 1.3773 18.3 RE P (%) - - - 138.1 221.4 44.3
g
Experimental precision in corn trials... 1463 Papadakis method was 0.6648, and the reduction in the
number of repetitions required for a given level of precision was significant. Using the Papadakis method, on average just one-quarter of the number of repetitions was necessary to predict the real individual values (hybrids), based on determination or pre-established precision (R2=0.80), when
compared to conventional analysis (without using the Papadakis method) (Table 3).
In general practice, three repetitions are performed in corn trials, well under the eight repetitions that would be necessary to show differences existing between hybrids, with 80% confidence. However, using the Papadakis method, the same confidence level of 80% may be obtained with just three repetitions, and determination or precision would be R2 = 0.865.
CONCLUSIONS
In analyzing grain yields in trials of competing corn hybrids using the Papadakis method, in comparison to the random block design model, it can be seen that the assumptions of normality, randomness, homogeneity and additivity remain valid.
The Papadakis method, compared to the use of the random block model, improved indices of experimental precision measures, and enabled a reduction in the number of repetitions required to predict corn hybrid performance with the same level of precision in relation to grain yield.
Trials involving the conventional three repetitions, analyzed using the Papadakis method, enable the identification of superior corn hybrids in terms of grain yield.
ACKNOWLEDGEMENTS
The authors wish to express their particular thanks to the National Council for Scientific and Technological Development (CNPq) for their support.
REFERENCES
BANZATTO, D.A.; KRONKA, S.N. Experimentação Agrícola. 4.ed. Jaboticabal: Funep, 2006. 237p.
CARGNELUTTI FILHO, A.; STORCK, L. Estatísticas de avaliação da precisão experimental em ensaios de cultivares de milho. Pesquisa Agropecuária Brasileira, Brasília, v.42, p.17-24, 2007.
CARGNELUTTI FILHO, A.; STORCK, L. Medidas do grau de precisão experimental em ensaios de competição
de cultivares de milho. Pesquisa Agropecuária Brasileira, Brasília, v.44, n.2, p.111-117, 2009.
CARGNELUTTI FILHO, A.; STORCK, L.; LÚCIO, A.D. Ajustes de quadrado médio do erro em ensaios de competição de cultivares de milho pelo método de Papadakis. Pesquisa Agropecuária Brasileira, Brasília, v.38, p.467-473, 2003.
CATAPATTI, T.R.; GONÇALVES, M.C.; SILVA NETO, M.R.; SOBROZA, R. Tamanho de amostra e número de repetições para avaliação de caracteres agronômicos em milho-pipoca. Ciência e Agrotecnologia, Lavras, v.32, n. 3, p.855-862, maio/jun. 2008.
CRUZ, C.D.; REGAZZI, A.J. Modelos biométricos aplicados ao melhoramento genético. 2.ed. Viçosa, MG: UFV, 1997. 390p.
FASOULAS, A.C. Rating cultivars and trials in applied plant breeding. Euphytica, Wageningen, v.32, p.939-943, 1983.
GÓMEZ, K.A.; GÓMEZ, A.A. Statistical procedures for agricultural research. 2.ed. New York: J. Wiley, 1984. 680p.
MARQUES, D.G.; STORCK, L.; LOPES, S.J.; MARTIN, T.N. Qualidade dos ensaios de competição de cultivares de milho no Estado do Rio Grande do Sul. Ciência Rural, Santa Maria, v.30, p.381-385, 2000.
PAPADAKIS, J.S. Méthode statistique pour des expériences sur champ. Thessalonike: Institut d’Amélioration des Plantes à Salonique, 1937. 30p. (Bullettin, 23).
OLIVEIRA, R.L.; MUNIZ, J.A.; ANDRADE, M.J.B.de; REIS, R.L.dos. Precisão experimental em ensaios com a cultura do feijão. Ciência e Agrotecnologia, Lavras, v.33, n. 1, p.113-119, jan./fev., 2009.
RAMALHO, M.A.P.; FERREIRA, D.F.; OLIVEIRA, A.C. Experimentação em genética e melhoramento de plantas. 2.ed. Lavras: UFLA, 2005. 322p.
STORCK, L. et al. 1464
SEBER, G.A.F. Linear regression analysis. NewYork: J. Wiley, 1976. 465p.
SNEDECOR, G.W.; COCHRAN, W.G. Statistical methods. 8.ed. Ames: Iowa State University, 1989. 503p.
SPRENT, P.; SMEETON, N.C. Applied nonparametric statistical methods. 4.ed. Boca Raton: Chapman & Hall, 2007. 530p.
STEEL, R.G.D.; TORRIE, J.H.; DICKEY, D.A. Principles and procedures of statistics: a biometrical approach. 3.ed. New York: McGraw Hill Book, 1997. 666p.
STORCK, L.; CARGNELUTTI FILHO, A.; LÚCIO, A.D.; LOPES, S.J. Método de Papadakis e número de
repetições em experimentos de soja. Ciência Rural, Santa Maria, v.39, p.977-982, 2009.
STORCK, L.; GARCIA, D.C.; LOPES, S.J.; ESTEFANEL, V. Experimentação vegetal. 2.ed. Santa Maria: UFSM, 2006. 198p.