Improving the precision of genotype selection in wheat performance
trials
Giovani Benin1*, Lindolfo Storck1, Volmir Sérgio Marchioro2, Francisco de Assis Franco2, Ivan Schuster2 and Diego Maciel Trevizan1
Received 18 February 2013 Accepted 30 October 2013
Abstract – The aim of this study was to verify whether using the Papadakis method improves model assumptions and experimental accuracy in field trials used to determine grain yield for wheat lineages indifferent Value for Cultivation and Use (VCU) regions. Grain yield data from 572 field trials at 31 locations in the VCU Regions 1, 2, 3 and 4 in 2007-2011 were used. Each trial was run with and without the use of the Papadakis method. The Papadakis method improved the indices of experimental precision measures and reduced the number of experimental repetitions required to predict grain yield performance among the wheat genotypes. There were differences among the wheat adaptation regions in terms of the efficiency of the Papadakis method, the adjustment coefficient of the genotype averages and the increases in the selective accuracy of grain yield.
Key words: Triticum aestivum L., cultivar selection and recommendation, assumptions, accuracy measurements, spatial analysis.
Crop Breeding and Applied Biotechnology 13: 234-240 2013 Brazilian Society of Plant Breeding. Printed in Brazil
ARTICLE
1 Universidade Tecnológica Federal do Paraná, Via do Conhecimento, km 1, 85.503-390, Pato Branco, PR, Brazil. *E-mail: [email protected] 2 Cooperativa Central de Pesquisa Agrícola da Nossa Terra, BR 467, km 98, 85.813-450, Cascavel, PR, Brazil
INTRODUCTION
Value for Cultivation and Use (VCU) trials for wheat (Triticum aestivum L.) genotypes are important because the development of new cultivars that have high production potential and are well-adapted to the different cultivation regions of Brazil depends on these trials. For a new wheat cultivar to be added to the National Cultivar Registry (Registro Nacional de Cultivares) of the Ministry of Agri-culture, Livestock and Supply (Ministério da Agricultura, Pecuária e Abastecimento (RNC/MAPA), trials must be performed for three years in two locations (or for two years
in three locations) and the cultivar must have a coefficient
of variation (CV) of 20% or less to be considered valid (Brasil/MAPA 2008).
An assessment of the experimental accuracy of field
trials (and therefore the quality of the results) is essential for discarding low-precision results and validating the conclusions of the experiment. The CV<20% criterion is not a good indicator of trial quality. Many studies suggest
that selective accuracy statistics, heritability, the coefficient
of determination and the F test statistic are better suited to genotype studies (Cargnelutti Filho and Storck 2007, 2009, Cargnelutti Filho et al. 2009, Cargnelutti Filho et al. 2012).
The Papadakis method (Papadakis 1937), for improving experimental accuracy and selective accuracy (SA), works by adjusting the values obtained in the plots as a function of the means of the experimental errors between
neighbor-ing plots. The application of this method in field trials of
soybean (Storck et al. 2008), maize (Storck et al. 2010) and the common bean (Storck et al. 2011) cultivars has
resulted significant gains in experimental accuracy without
changing the assumptions of the experimental design. The
advantages of using the Papadakis method in field trials
of wheat genotypes performed at various sites within the different adaptation regions (VCU Regions 1, 2, 3 and 4) during different crop years are still unknown. As shown in previous trials of soybean, maize and the common bean, this method could be a useful procedure for improving experimental accuracy.
The aim of this study was to determine whether there were changes in experimental accuracy indicators or in the assumptions of the mathematical model for analysis of variance with the application of the Papadakis method in
field trials of wheat genotypes performed in different VCU
Grain yield data from 572 field trials at 31 locations in
the VCU Regions 1, 2, 3 and 4 from 2007 to 2011 were used (Table 1). The trials were performed by the wheat improvement program of the Central Cooperative of Agri-cultural Research (Cooperativa Central de Pesquisa Agrícola - COODETEC). The COODETEC assesses approximately 750 genotypes annually in preliminary and advanced trials. The trials used a randomized block design with three
replications. Each plot consisted of five rows that were 5.0
m long with 0.20 cm of space between the rows, for a total area of 5.0 m². The crops were treated according to the tech-nical recommendations for each crop type. At maturation, the crops were harvested and grain mass was assessed for the plot. Grain yield (kg ha-1) was subsequently estimated and corrected for 13% humidity.
Data on grain yield (kg ha-1) from each trial were sub-jected to an analysis of variance (ANOVA) with hypothesis testing (p<0.05) for blocks and genotypes. The relative
ef-ficiency (RE) of the blocks, the average yield per genotype,
the differences between genotype averages and the overall average ( ˆm) were estimated. In addition, the CV of the
experimental error and the Turkey’s minimum significant
difference (p=0.05) between genotypes (D) were estimated, where D = q(α;I;GLe) MSe/J, q(α;I;DFe) is the table value for the Tukey test, I is the number of genotypes, DFe is the degree of freedom of the error, MSe is the estimation of experimental error, and J is the number of blocks. Tukey’s
minimum significant difference (MSD) between genotypes
expressed as a percentage of the average was obtained us-ing MSD = 100 D / ˆm. The Fasoulas differentiation index (FDI) was used to assess the experimental accuracy and was estimated by the equation
∑
=
−
= n
1 i
i/[n(n 1)]
m 200 FDI
, where n is the number of genotypes of the trial and mi is
the number of averages that are statistically significant for
the i-th genotype according to the Tukey test.
The value of the R2 statistic, termed as coefficient of determination (Cargnelutti Filho and Storck 2007), was determined and expressed as R2 = MSg/(MSg + MSe), where MSg is the mean square of the genotype. In addition, selective accuracy (SA) was estimated by SA – (1 – 1/F)1/2, where F is the value of the F statistic for the genotype
(Re-sende and Duarte 2007, Cargnelutti Filho and Storck 2009). The assessments for each block were considered to be measurements performed on the same individual (genotype). Based on this assumption, one can estimate the intraclass
correlation coefficient (ICC) for the genotype or the coef
-ficient of repeatability (CoR) (analysis of variance method) as follows: ˆρg= ˆσ
2 g /(ˆσ
2 + ˆσ 2
g) , where ˆσ 2
g = (MSg – MSe)/J and ˆσ2 = MSe. The minimum number of measurements (repetitions = blocks = J) required to predict the actual value for each individual (genotype) based on the determination or pre-established accuracy (R2) was obtained according to Cruz and Regazzi (1997), in which the value of J for a given R2 is: J(R2) = (1 – ˆρ) R2/ˆρ(1 – R2).
The error for each experimental unit was estimated, taking into account the randomized block design (observed value minus the overall average, minus the block and geno-type effects). Using the values of the estimated error, the Lilliefors test (Sprent and Smeeton 2007) was applied to verify assumptions of normality. In a test for randomness of error or a sequence test (Sprent and Smeeton 2007), the number of error sequences (positive and negative) follows a pathway between the columns of the different rows (in the preset, the numbers follows one row and returns by other). The test statistic of the sequence test, which is equal to the number of times in which the signal for the preset pathway for the experimental plots is switched, was determined by its proximity to the standard normal distribution. Bartlett’s test (Steel et al. 1997) was applied to verify homogeneity of variance of error among the genotypes. The additivity
of the mathematical model was verified by Tukey’s test
of non-additivity (Snedecor and Cochran 1989). The as-sumptions for the hypothesis tests (normality, randomness,
homogeneity and additivity) were verified (p=0.05).
The errors were estimated by the application of the Papadakis method according to the completely randomized design (the observed value minus the overall average, minus the block and genotype effects). With these values, the mean error of each experimental unit was estimated as an average between the error of the given experimental unit and the errors of neighboring experimental units (to the right, left, front and back) (Cargnelutti Filho et al. 2003). The value of the mean error was used as a covariate in the analysis of covariance (ANCOVA) according to the completely
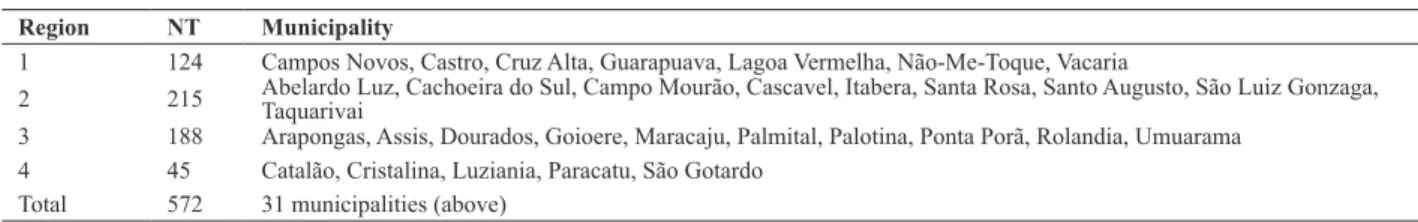
random-Table 1. Number of trials (NT) and their respective municipalities by wheat adaptation region for the years 2007-2011
Region NT Municipality
1 124 Campos Novos, Castro, Cruz Alta, Guarapuava, Lagoa Vermelha, Não-Me-Toque, Vacaria
2 215 Abelardo Luz, Cachoeira do Sul, Campo Mourão, Cascavel, Itabera, Santa Rosa, Santo Augusto, São Luiz Gonzaga, Taquarivai
3 188 Arapongas, Assis, Dourados, Goioere, Maracaju, Palmital, Palotina, Ponta Porã, Rolandia, Umuarama 4 45 Catalão, Cristalina, Luziania, Paracatu, São Gotardo
ized design (Steel et al. 1997, Storck et al. 2008), which corresponds to the application of the Papadakis method (Papadakis 1937). Previously, the values of the covariate were subjected to an analysis of variance according to the randomized block design, and the assumptions of normality,
randomness and homogeneity of variances were verified.
The ANCOVA (Papadakis method) was performed and the hypotheses for the effects of the covariate and the adjusted genotypes were tested according to Steel et al. (1997). The differences between the averages of the ad-justed genotypes and the CV, D, MSD, FDI, R2, h2, SA, ˆρ
g and J(R2) statistics were estimated. We also estimated the
relative efficiency (RE-P%) of the use of the covariate with
the Papadakis method compared to the randomized block
design and verified the assumptions of the hypothesis tests
(normality, randomness and homogeneity of the variances for the genotypes) for the error in ANCOVA model. The averages of the statistics, ˆm, RE-P%, Beta, the reduction in the number of repetitions and the increase in the SA due to the use of Papadakis method were compared for each VCU region two-by-two by a Bootstrap t-test with 5,000 simulations using BioEstat 5.0 software.
For calculating the statistics, we developed a specific
program in the Pascal language, and the values of the sta-tistics were transferred into an Excel spreadsheet. RESULTS AND DISCUSSION
The blocks were heterogeneous (p<0.05) in 36% of the trials (Table 2). In most trials (64%), blocking was unnec-essary either due to the spatial homogeneity of the area or because the direction of the blocks was oriented such that the blocks were not all within the same range of productivity. Of the trials with heterogeneous blocks, the average relative
efficiency was 133.3%, meaning that the estimated variance
of the averages for one genotype was 33.3% lower than the variance for the averages in the completely randomized design. The lowest and the highest occurrences of trials with heterogeneous blocks were in VCU Regions 1 (28%) and 3 (44%). The ANCOVA revealed that the frequency of heterogeneous blocks was approximately 50% and showed little variance among the four regions. Similar proportions of heterogeneous blocks were found in 39% of trials for soybean (Storck et al. 2008), 60% of maize trials (Storck et al. 2010) and 50% of trials for the common bean (Storck et al. 2011). These results show that the method of estimating the covariate (the average error between neighboring plots) in the wheat trials did not correct for the lateral differences between blocks. Possible explanations for the lateral variance between blocks include the method of mechanical sowing used in the trials, which created a greater lateral distance between the blocks than above and below the blocks, or the fact that the blocks did not always follow the linear patterns in soil fertility.
Differences between genotypes were significant (p<0.05)
in 93% of the trials, with similar proportions of genotypic
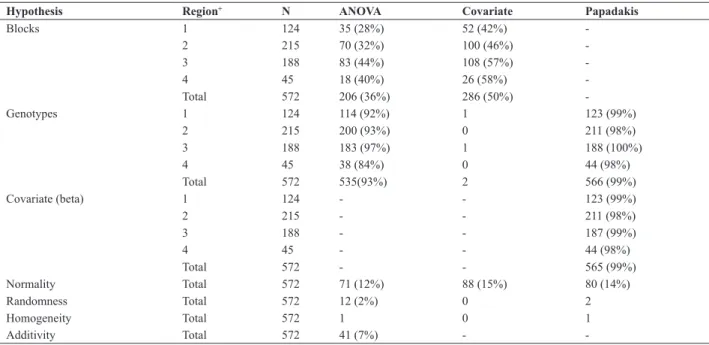
Table 2. Number of trials (N) by wheat adaptation region and the number of trials for which the null hypothesis was rejected (p<0.05) for the ANOVA,
the covariate of Papadakis method and the Papadakis analysis
Hypothesis Region+ N ANOVA Covariate Papadakis
Blocks 1 124 35 (28%) 52 (42%)
-2 215 70 (32%) 100 (46%)
-3 188 83 (44%) 108 (57%)
-4 45 18 (40%) 26 (58%)
-Total 572 206 (36%) 286 (50%)
-Genotypes 1 124 114 (92%) 1 123 (99%)
2 215 200 (93%) 0 211 (98%)
3 188 183 (97%) 1 188 (100%)
4 45 38 (84%) 0 44 (98%)
Total 572 535(93%) 2 566 (99%)
Covariate (beta) 1 124 - - 123 (99%)
2 215 - - 211 (98%)
3 188 - - 187 (99%)
4 45 - - 44 (98%)
Total 572 - - 565 (99%)
Normality Total 572 71 (12%) 88 (15%) 80 (14%)
Randomness Total 572 12 (2%) 0 2
Homogeneity Total 572 1 0 1
Additivity Total 572 41 (7%) -
variation for the VCU Regions 1, 2 and 3. In the VCU region 4, there were no differences between genotypes in 16% of the trials. Using the Papadakis method (neighboring plots), the proportion of trials with differences between genotypes (p<0.05) increased from 93 to 99%, with no variation among the four regions. Additionally, in 99% of the trials, the effect
of the covariate was significant (p<0.05).
In only two of the 572 trials (0.3%), the covariate (average
error between neighboring plots) was significantly affected
by genotype. This result, which has also been observed in other crops (Storck et al. 2008, Storck et al. 2010, Storck et al. 2011), indicates that the differences between genotypes are independent of the covariate values, which is a require-ment for performing the ANCOVA and adjusting the means of the genotype in relation to the covariate means (Steel et al. 1997). In addition, Pearce (1998) showed that the use of the Papadakis method implies an unbiased estimate of contrasts and a substantial reduction in the estimation of the experimental error, especially in trials with a rectangular shape. In the trials in this study, the blocks were 5.0 m wide and 25 m long (not very rectangular).
The proportion of trials with flawed assumptions (normal -ity, randomness, homogeneity of variance and additivity of the model) was low, with or without the use of the Papadakis method. This result is also similar to the results of other
studies (Marques et al. 2000, Storck et al. 2008, Storck et al. 2010, Storck et al. 2011). Given that there are no data for other crop cultures about the percentage of trials with
flawed assumptions, these results are an important reference. In the five years (2007-2011) during which the 572 trials
were performed in the 31 localities (VCU Regions 1 to 4), the average grain yield was of 3.589 t ha-1 with a range of 3.497 t ha-1 (Table 3). The highest average grain yield was in VCU Region 1 (compared to Regions 2 and 3), likely due to the fact that this region has a higher average altitude, which is related to a higher photothermal quotient (PQ) that enables a longer phenophases and greater differentiation in
the tillers and flower primordial (Fischer 1985, Magrin et
al. 1993, Cunha et al. 2005).The high average grain yield in VCU Region 1 was due to the adoption of more intensive management practice related to the use of irrigation. Dif-ferences in wheat yield potential between the VCU regions have also been observed by other authors (Caierão et al. 2006, Cargnin et al. 2006, Franceschi et al. 2010, Silva et al. 2011).
The use of the Papadakis method improved all measure-ments of experimental accuracy, reducing the average
coef-ficient of variation from 10.3 to 9.0%, the average Tukey’s
MSD between genotypes from 1.233 t ha-1 to 0.984 t ha-1 and the Tukey’s MSD between genotypes (expressed by
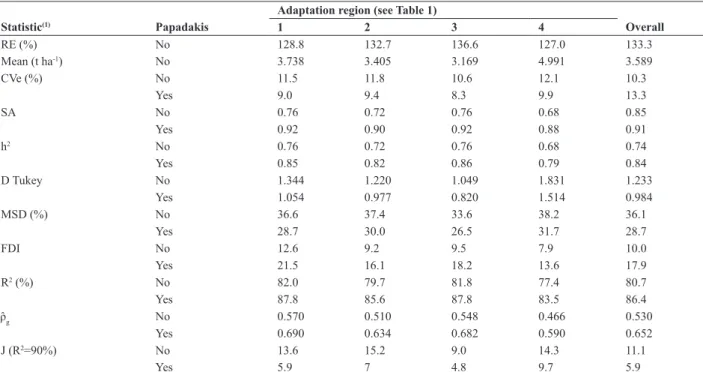
Table 3. Averages for the statistics estimated for the field trials of wheat genotypes (grain yield, t ha-1) by wheat adaptation region with use or non-use
of the Papadakis method
Adaptation region (see Table 1)
Statistic(1) Papadakis 1 2 3 4 Overall
RE (%) No 128.8 132.7 136.6 127.0 133.3
Mean (t ha-1) No 3.738 3.405 3.169 4.991 3.589
CVe (%) No 11.5 11.8 10.6 12.1 10.3
Yes 9.0 9.4 8.3 9.9 13.3
SA No 0.76 0.72 0.76 0.68 0.85
Yes 0.92 0.90 0.92 0.88 0.91
h2 No 0.76 0.72 0.76 0.68 0.74
Yes 0.85 0.82 0.86 0.79 0.84
D Tukey No 1.344 1.220 1.049 1.831 1.233
Yes 1.054 0.977 0.820 1.514 0.984
MSD (%) No 36.6 37.4 33.6 38.2 36.1
Yes 28.7 30.0 26.5 31.7 28.7
FDI No 12.6 9.2 9.5 7.9 10.0
Yes 21.5 16.1 18.2 13.6 17.9
R2 (%) No 82.0 79.7 81.8 77.4 80.7
Yes 87.8 85.6 87.8 83.5 86.4
ˆρg No 0.570 0.510 0.548 0.466 0.530
Yes 0.690 0.634 0.682 0.590 0.652
J (R2=90%) No 13.6 15.2 9.0 14.3 11.1
Yes 5.9 7 4.8 9.7 5.9
1 RE = relative efficiency of the trials with a significant effect for block; Mean = mean grain yield; CVe =coefficient of variation of the experimental error; SA = selective accuracy; h2= heritability, D Tukey = minimum significant difference by Tukey’s test (p<0.05); MSD= D Tukey as a percentage of the mean; FDI = Fasoulas index of differen -tiation; R2 = coefficient of determination of the model; ˆρ
g = coefficient of repeatability; J(R
the average) from 36.1 to 28.7%. The Papadakis method increased the average SA from 0.85 to 0.91, the average heritability (h2) from 0.74 to 0.84, the average of FDI from
10.0 to 17.9 and the coefficient of determination of the
model (R2) from 80.7% to 86.4%. In addition, the Papadakis
method increased the average coefficient of repeatability
and consequently reduced the number of repetitions needed for a determination of 90% accuracy. The improvements in accuracy measurements were similar in size and direction in the four adaptation regions. Gains in accuracy from the use of Papadakis method have been reported in other studies (Storck et al. 2008, Storck et al. 2010, Storck et al. 2011) to a similar degree (Table 4). Favorable results were also reported for the application of the Papadakis method in the genetic improvement of the common bean and maize (Souza et al. 2000, Costa et al. 2005). Conversely, however, Candido et al. (2009) concluded that the Papadakis method did not
improve either the experimental accuracy or the results in a study of yield potential (culms) of sugarcane genotypes. Selective accuracy, which is algebraically related to Fc, h2 and R2, is a measurement of experimental accuracy that has many favorable attributes (Resende and Duarte 2007, Cargnelutti Filho and Storck 2007, 2009, Cargnelutti Filho et al. 2009, Cargnelutti Filho et al. 2012). The SA statistic increased with the use of the Papadakis method across the four regions. However, in Region 4, the gain in SA (16%) was greater (p<0.05) than in Region 3 (6%), but with no difference between these regions than in the others (Table 5).
The relative efficiency of the Papadakis method
(RE-P%) as an average of the 572 trials was 91.7%. The highest value of RE-P% was from VCU Region 3 (95.9%), and this
value differed significantly (p<0.05) from the lowest value,
which occurred in Region 4 (85.4%). The highest values
Table 5. Number of field trials of wheat genotypes (NT), average grain yield (Yield, t ha-1), relative efficiency of the Papadakis method (RE-P%),
coefficient of linear regression of the covariate (Beta), reduction of the number of repetitions (RJ) and increase in the selective accuracy (ISA) due to
the use of Papadakis method, by wheat adaptation region
Region+ NT Yield RE-P (%) Beta RJ ISA
1 124 3.738 b* 92.8 ab 1.414 b 2.27 a 1.09 ab
2 215 3.405 c 88.6 b 1.407 b 2.01 a 1.11 ab
3 188 3.169 d 95.9 a 1.490 a 1.97 a 1.06b
4 45 4.891 a 85.8 b 1.345 b 1.82 a 1.16 a
Total/Overall 572 3.517 91.7 1.431 1.94 1.10
+ Region defined in Table 1
Means not followed by the same letter differ by a Bootstrap t test with 5,000 simulations (p<0.05).
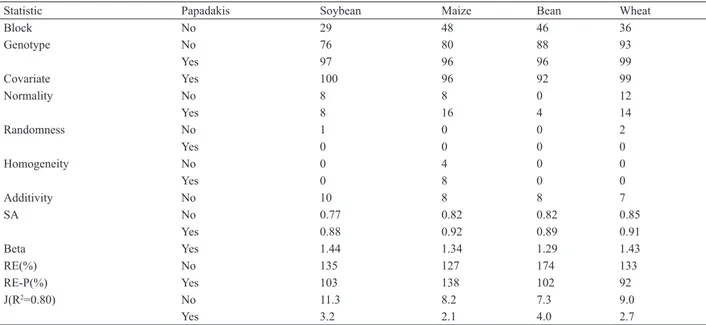
Table 4. Percentage of trials by crop showing significant effects (p<0.05) for block, genotype, covariate, normality, randomness, homogeneity of
variance and additivity of the model
Statistic Papadakis Soybean Maize Bean Wheat
Block No 29 48 46 36
Genotype No 76 80 88 93
Yes 97 96 96 99
Covariate Yes 100 96 92 99
Normality No 8 8 0 12
Yes 8 16 4 14
Randomness No 1 0 0 2
Yes 0 0 0 0
Homogeneity No 0 4 0 0
Yes 0 8 0 0
Additivity No 10 8 8 7
SA No 0.77 0.82 0.82 0.85
Yes 0.88 0.92 0.89 0.91
Beta Yes 1.44 1.34 1.29 1.43
RE(%) No 135 127 174 133
RE-P(%) Yes 103 138 102 92
J(R2=0.80) No 11.3 8.2 7.3 9.0
Yes 3.2 2.1 4.0 2.7
of RE-P% have been found for soybean, maize and the common bean (Table 4). Because the RE-P% refers to the
efficiency of using the covariate (Papadakis method) as are
placement for blocks, it can be assumed that the spatial range in the covariate estimation was affected by the relatively large distance between blocks (due to mechanical sowing).
The average coefficient of linear regression (effect of the covariate Beta), which was significant in 99% of the
trials, was 1.431. This result shows that the grain yield averages for each genotype can be adjusted (up or down) in relation to the difference between the covariate mean for each genotype and the overall covariate mean by up to 43%. Such adjustments can alter the order of magnitude for each genotype without changing the overall averages for the trials. Compared to the other VCU regions, Region 3 had a greater Beta (p<0.05), the lowest grain yield aver-age, the greatest RE-P% and a lower gain in SA when the
Papadakis method was used. These findings indicate that
in environments (regions) with lower grain yield potential, the RE-P% is higher because there is a greater adjustment in the averages for the genotypes (greater Beta), such that the gain in SA is lower but still positive.
In the analysis of repeatability, the mean value of the
intraclass correlation coefficient (ˆρg) estimated with the
Papadakis method was ˆρg= 0.652 as compared to ˆρg=0.530 without the use of the method. On average, the use of the Papadakis method reduced the number of repetitions needed for a determination of 90% accuracy by half for the four regions of adaptation. Therefore, using the Papadakis method, it is possible to reduce the number of repetitions by half while maintaining the same accuracy (SA), regardless of the adaptation region. This result demonstrates an opportunity
for economic savings by using fewer financial and human
resources to achieve the same goal. Being able to use the same number of repetitions in the different regions could help facilitate the design and establishment of rules for the
listing of cultivars on the Registry.
All wheat field trials in this study used three repetitions,
which was fewer than the 11 repetitions needed to detect
differences between cultivars at a 90% confidence level.
Nevertheless, using the Papadakis method and the same
confidence level (R2=90%), the three repetitions would not be enough and six repetitions would be required. There-fore, even with the use of the Papadakis method, either the number of repetitions must be increased or the standards for accuracy must be decreased.
Based on the results of this study, the Papadakis method is recommended for the major agricultural crops, including maize, soybean, the common bean and wheat. In the case of wheat, the degree of improvement in experimental ac-curacy with the use of the Papadakis method depends on the environment (adaptation region) in which the genotype
field trials are executed. In planning for future VCU tri -als, the degree of required accuracy should be considered individually for each experiment.
CONCLUSIONS
In an analysis of grain yield for wheat genotypes in
field trials using the Papadakis method, the assumptions of
normality, randomness and homogeneity were adequately maintained.
Using the Papadakis method improved the indices of experimental accuracy and reduced the number of repeti-tions needed to predict the grain yield performance of wheat genotypes, while maintaining the same degree of accuracy. There were differences among climate regions regarding
wheat productivity, the efficiency of the Papadakis method, the magnitude of the adjustment coefficient of the averages
of the genotypes and the gain in selective accuracy, which was always positive.
Melhoria da precisão de seleção de genótipos de trigo em ensaios de competição
Resumo – O objetivo deste trabalho foi verificar se o uso do método de Papadakis melhora os pressupostos do modelo e a precisão experimental da produtividade de grãos de em ensaios de competição de linhagens de trigo, em diferentes regiões de Valor de Cul-tivo e Uso (VCU). Foram usados os resultados da produtividade de grãos de 572 ensaios de competição, avaliados em 31 locais, nas regiões de VCU 1, 2, 3, e 4, nas safras agrícolas de 2007 a 2011. O método de Papadakis melhorou os índices das medidas de precisão experimental e reduziu o número de repetições necessário para a predição do rendimento de grãos de genótipos de trigo. Existe diferença entre as regiões de adaptação de trigo quanto à eficiência do método de Papadakis, a magnitude do coeficiente de ajustamento das médias de genótipos, o ganho na acurácia seletiva e a produtividade de grãos.
Palavras-chave: Triticum aestivum L., seleção e recomendação de cultivares, pressupostos, medidas de precisão, análise espacial.
REFERENCES
Brasil/MAPA - Ministério da Agricultura, Pecuária e Abastecimento (2008) Instrução normativa nº 58 com anexos, de 19 de novembro de 2008. MAPA, Brasília.
Caierão E, Silva MS, Scheeren PL, Del Duca, LJA, Junior NA and Pires
JL (2006) Análise da adaptabilidade e da estabilidade de genótipos de
trigo como ferramenta auxiliar na recomendação de novas cultivares.
Candido LS, Perecin D, Landell MGA and Pavan BE (2009) Análise de vizinhança na avaliação de genótipos de cana-de-açúcar. Pesquisa Agropecuária Brasileira 44: 1304-1311.
Cargnelutti Filho A, Storck L and Ribeiro ND (2009) Medidas da precisão experimental em ensaios com genótipos de feijão e de soja. Pesquisa Agropecuária Brasileira 44: 1225-1231.
Cargnelutti Filho A, Marchesan E, Silva LS and Toebe M (2012) Medidas de precisão experimental e número de repetições em ensaios de genótipos de arroz irrigado. Pesquisa Agropecuária Brasileira 47: 336-343.
Cargnelutti Filho A and Storck L (2007) Estatísticas de avaliação da precisão experimental em ensaios de cultivares de milho. Pesquisa Agropecuária Brasileira 42: 17-24.
Cargnelutti Filho A and Storck L (2009) Medidas do grau de precisão experimental em ensaios de competição de cultivares de milho. Pesquisa Agropecuária Brasileira 44: 111-117.
Cargnelutti Filho A, Storck L and Lúcio AD (2003) Ajustes de quadrado médio do erro em ensaios de competição de cultivares de milho pelo método de Papadakis. Pesquisa Agropecuária Brasileira 38: 467-473.
Cargnin A, Souza MA, Carneiro PCS and Sofiatti V (2006) Interação entre
genótipos e ambientes e implicações em ganhos com seleção em trigo. Pesquisa Agropecuária Brasileira 41: 987-997.
Costa JR, Bueno Filho JSS and Ramalho MAP (2005) Análise espacial e de vizinhança no melhoramento genético de plantas. Pesquisa Agropecuária Brasileira 40: 1073-1079.
Cruz CD and Regazzi AJ (1997) Modelos biométricos aplicados ao melhoramento genético. 2nd ed., UFV, Viçosa, 390p.
Cunha GR, Pires JLF, Pasinato A and Dalmago GA (2005) Variabilidade temporal e espacial do quociente fototermal no Rio Grande do Sul e suas implicações para a expressão do potencial de rendimento de grãos de trigo. Revista Brasileira de Agrometeorologia 13: 91-101.
Fischer RA (1985) Number of kernels in wheat crops and the influence
of solar radiation and temperature. Journal of Agricultural Science 105: 447-461.
Franceschi L, Benin G, Marchioro VS, Martin TN, Silva RR and Silva CL (2010) Métodos para análise de adaptabilidade e estabilidade em cultivares de trigo no estado do Paraná. Bragantia 69: 797-805.
Magrin GO, Hall AJ, Baldy C and Grondona MO (1993) Spatial and
interannual variations in the photothermal quotient: implications for the potential kernel number of wheat crops in Argentina. Agricultural and Forest Meteorology 67: 29-41.
Marques DG, Storck L, Lopes SJ and Martin TN (2000) Qualidade dos ensaios de competição de cultivares de milho no Estado do Rio Grande do Sul. Ciência Rural 30: 381-385.
Papadakis JS (1937) Méthode statistique pour des expériences sur champ. Thessalonike: Institut d’Amélioration des Plantes à Salonique, 30p. (Bullettin, 23).
Pearce SC (1998) Field experimentation on rough land: The method of Papadakis reconsidered. Journal of Agricultural Science 131: 1-11.
Resende MDV and Duarte JB (2007) Precisão e controle de qualidade em experimentos de avaliação de cultivares. Pesquisa Agropecuária Tropical 37: 182-194.
Silva RR, Benin G, Silva GO, Marchioro VS, Almeida JL and Matei G (2011) Adaptabilidade e estabilidade de cultivares de trigo em diferentes épocas de semeadura, no Paraná. Pesquisa Agropecuária Brasileira 46: 1439-1447.
Snedecor GW and Cochran WG (1989) Statistical methods. 8th ed., Iowa State University Press, Ames, 503p.
Souza EA, Geraldi IO and Ramalho MAP (2000) Alternativas experimentais na avaliação de famílias em programas de melhoramento genético do feijoeiro. Pesquisa Agropecuária Brasileira 35: 1765-1771.
Sprent P and Smeeton NC (2007) Applied nonparametric statistical methods. 4th ed., Chapman & Hall, Boca Raton, 530p.
Steel RGD, Torrie JH and Dickey DA (1997) Principles and procedures of statistics: a biometrical approach. 3rd ed., McGraw Hill Book, New York, 666p.
Storck L, Lopes SJ, Cargnelutti Filho A, Lúcio AD and Toebe M (2010) Experimental precision in corn trials using the Papadakis method. Ciência e Agrotecnologia 34: 1458-1464.
Storck L, Ribeiro ND and Cargnelutti Filho A (2011) Precisão experimental de ensaios de feijão analisada pelo método de Papadakis. Pesquisa Agropecuária Brasileira 46: 798-804.
Storck L and Ribeiro ND (2011) Valores genéticos de linhas puras de soja preditos com o uso do método de Papadakis. Bragantia 70: 753-758.