PEDOTRANSFER FUNCTIONS FOR WATER RETENTION IN
DIFFERENT SOIL CLASSES FROM THE CENTER-SOUTHERN
RIO GRANDE DO SUL STATE
Funções de pedotransferência para retenção de água em diferentes classes de solos no centro-sul do estado do Rio Grande do Sul
Walbert Júnior Reis dos Santos1, Nilton Curi2,
Sérgio Henrique Godinho Silva3, Elias Frank de Araújo4, João José Marques2
ABSTRACT
Water retention in soil is used in many agronomic and environmental applications, but its direct measurement is time-consuming and expensive. Therefore, pedotransfer functions (PTFs) are alternatives to obtain this information faster and more economically. The objectives of this study were to generate and validate PTFs to estimate the water content at potentials of -33 kPa (field capacity) and -1500 kPa (permanent wilting point) for different soil classes from the central-south portion of Rio Grande do Sul State. The physical and chemical analyses database from soil surveys of the Celulose Riograndense Corp were used. The database is composed of particle size distribution (coarse and fine sand, silt and clay), soil organic matter, and water content data at the above mentioned potentials, besides other information concerning the behavior of the soil classes at field conditions. Firstly, the data were stratified by soil classes and depths, and then 70% of the data were separated for PTF generation and 30% for validation. PTFs were generated for each specific soil class and also general PTFs which were not stratified by soil class, by means of stepwise multiple regression. In most situations, PTFs for a specific soil class showed a better fit than the general PTFs. Proper adjustment of the data showed that the water retention values at potentials of -33 kPa and -1500 kPa can be estimated for the soils from the central-south portion of Rio Grande do Sul State that do not have such analyses through the use of PTFs.
Index terms: Permanent wilting point, field capacity, water retention curve.
RESUMO
A retenção de água no solo é utilizada em diversas aplicações agronômicas e ambientais, porém sua medição direta consome tempo e dinheiro. Por isso, funções de pedotransferência (FPTs) são alternativas para a obtenção dessas informações de forma mais rápida e econômica. Neste trabalho, objetivou-se gerar e validar FPTs, para estimar o conteúdo de água nos potenciais de -33 kPa (capacidade de campo) e -1500 kPa (ponto de murcha permanente) para diferentes classes de solos na porção centro-sul do Rio Grande do Sul. Utilizou-se o banco de dados de análises físicas e químicas dos levantamentos de solos da empresa Celulose Riograndense, que é composto por dados de textura (areia grossa e fina, silte e argila), matéria orgânica do solo e dados de conteúdo de água nos potenciais supracitados, entre outras informações sobre o comportamento das classes de solo em condições de campo. Primeiramente, os dados foram estratificados por classes de solos e profundidades e, posteriormente, 70% dos dados foram separados para geração das FPTs e 30% para validação. Geraram-se FPTs específicas para cada classe de solo e também FPTs gerais, sem estratificação por classe de solos, por meio de regressão múltipla stepwise. Na maioria das situações, as FPTs específicas por classe
de solo apresentaram melhor ajuste do que as FPTs gerais. Na maioria dos casos, o ajuste adequado dos dados demonstrou que os valores de retenção de água nos potenciais de -33 kPa e -1500 kPa podem ser estimados por meio de FPTs para os solos da porção centro-sul do Rio Grande do Sul que não possuem tais análises.
Termos para indexação: Ponto de murcha permanente, capacidade de campo, curva de retenção de água.
(Received in august 21, 2012 and approved in november 20, 2012)
1Universidade Federal de Lavras/UFLA – Departamento de Ciência do Solo – Cx. P. 3037 – 37200-000 – Lavras – MG – Brasil – [email protected]
2Universidade Federal de Lavras/UFLA – Departamento de Ciência do Solo – Lavras – MG – Brasil
3Universidade Federal de Lavras/UFLA – Lavras – MG – Brasil
4CMPC Celulose do Brasil Ltda – Brasil
INTRODUCTION
Water retention by soils is used in projects involving water availability for plants, such as irrigation and drainage projects, hydric stress, movement of solutes in the soil
made unfeasible by practical or financial restrictions (SCHAAP et al., 2001). Furthermore, laboratory problems, delays and inaccuracy can often occur (OLIVEIRA et al., 2002). To overcome those difficulties, great efforts have been employed to determine pedotransfer functions (PTFs) for water retention estimative in soils.
Examples of PTFs can be seen in: Balland et al. (2008) who proposed equations to estimate the water retention and the hydraulic conductivity from the particle size distribution and organic matter of the soil for a wide variety of soils in Canada; Khodaverdiloo et al. (2011) who generated PTFs to estimate the water retention in the soil at various potentials for soils derived from limestone in Iran; and Tomasella et al. (2000) who used various soil survey data in Brazil to generate PTFs to predict the water retention parameters of the van Genuchten equation and to estimate the water retention; among other works as in Oliveira et al. (2002), and Piedallu et al. (2011).
Michelon et al. (2010) generated PTFs for the RS State, however they utilized data from undisturbed samples. Here, as in the great majority of the soil surveys (base for this research), the data concerning water retention came from disturbed samples. This aspect and the fact that the entries of data of generated PTFs are different from the ones generated here do not allow comparison of models. Also there is need to develop PTFs using simpler and cheaper data entry (DASHTAKI et al., 2010) as performed in this work.
The term PTF was coined in 1987 by Bouma and Lanen (STUMPP et al., 2009) and it described functions that related easily measurable soil attributes, such as particle size distribution and organic matter, to the soil hydraulic characteristics (BOUMA; LANEN, 1987). In other words, PTFs, or simply pedofunctions, are mathematical models that allow transforming basic soil information, available for instance in soil survey reports, into other information more difficult to obtain and of higher cost (MICHELON et al., 2010). It is noted, though, that with the intention of reducing the prediction errors of the estimated attribute, a specific PTF should not be extrapolated beyond the region and soil class for which it was developed (DASHTAKI et al., 2010; NEMES et al., 2009). This is because the more homogeneous the soils that compose the PTF database, the better their performance will be (DASHTAKI et al., 2010). It is important to mention that the effect of soil mineralogy can sometimes overlap the effect of the soil class in this context.
Based on the above, the objectives of this work were to generate and to validate PTFs to estimate the water
content at the potentials of -33 kPa and -1500 kPa (concepts somewhat limited but still useful) for different soil classes in the central-south portion of the State of Rio Grande do Sul.
MATERIAL AND METHODS
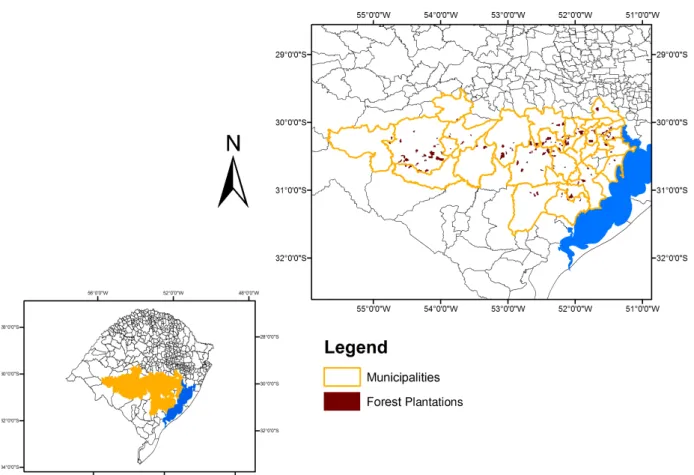
The study areas belong to CMPC Celulose Riograndense Corp. They are located between 29º57’ and 31º3’ S latitude, and 54º49’ and 51º38’ W longitude, in the center-south portion of Rio Grande do Sul, including the municipalities of Arroio dos Ratos, Butiá, Caçapava do Sul, Cachoeira do Sul, Camaquã, Cristal, Dom Feliciano, Encruzilhada do Sul, Lavras do Sul, Mariana Pimentel, Pantano Grande, Rio Pardo, Rosário do Sul, Santa Margarida do Sul, Santa Maria, São Gabriel, São Lourenço do Sul, São Sepé, and Vila Nova do Sul (Figure 1).
PTFs were developed from the database of semidetailed soil surveys (scale: 1:25,000) of 111 forest plantations (Figure 1), and the detailed soil surveys of two small watersheds (scale: 1:10,000), making up a total of approximately 54,600 ha, with about 800 field observations, soil descriptions, and direct measurements. The database is composed of the physical and chemical results of the collected samples, according to Embrapa (1997) for the 0-20 and 40-70 cm depths. The soil classifications were conducted according to Embrapa (2006).
The water retention at the potentials of -33 and -1500 kPa was obtained through sample equilibrium at those potentials in a suction unit and in a Richards chamber, respectively, calculating the soil moisture after having obtained the dry weight in an oven at 105º C (EMBRAPA, 1997). The water content was estimated at potentials of -33 kPa and -1500 kPa, which correspond, respectively, to the water content at field capacity (FC), considered the upper limit of the range of water availability to plants, and the permanent wilting point (PWP), considered the lower limit of water availability to plants (EMBRAPA, 1995).
In this work it were utilized disturbed samples considering that in the great majority of soil surveys (base for this research) the water retention parameters are obtained in this way, taking into account time and cost saving (BELL; VAN KEULEN, 1995 ). Beyond that, Oliveira et al. (2002) found adequate PTFs adjustments utilizing disturbed soil samples.
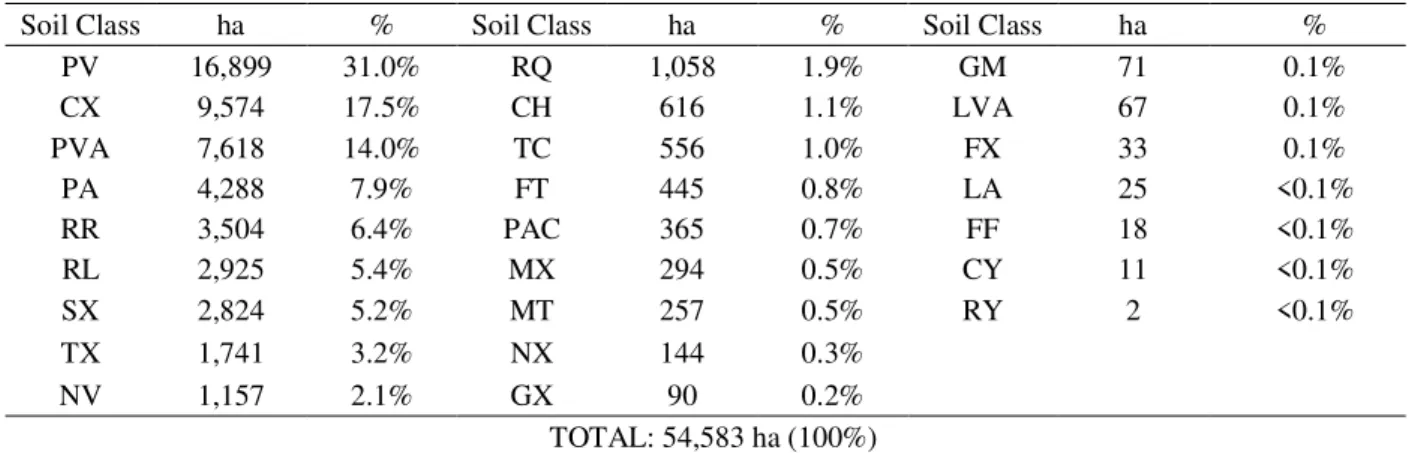
(Table 1). I t can be obser ved th a t th e seven predominant soil classes (Red Argisol-PV, Haplic Cambisol-CX, Red-Yellow PVA, Yellow Argisol-PA, Regolithic Neosol-RR, Litholic Neosol-RL, and Haplic Planosol-SX) occupy about 90% of the total area, which correspond to the following soil classes in the USA Soil Taxonomy (Soil Survey Staff, 1999): Udalf, Udept, Udalf, Udalf, Orthent, Orthent, and Aqualf. At this second categorical level, the Brazilian Soil Classification System is more specific for our conditions. Those classes were selected for the preparation of PTFs due to the high geographical expression and number of sampled points.
Afterwards, in order to homogenize the data, they were separated into two groups according to the sampling depth (0 to 20 and 40 to 70 cm). In each combination of soil class and depth, 70% of the data were randomly separated to generate PTFs and the remaining (30%) were set aside to validate the generated PTFs. The data were submitted to multiple regression in the R programming language,
through the stepwise package, since that method selects only the independent variables that decisively influence the dependent variable of the study (TAVARES FILHO et al., 2012). This methodology utilizes the highest AIC (Akaike Information Criterion) for the choice of the independent variables (AKAIKE, 1974). The independent variables used to generate PTFs were coarse sand, fine sand, clay, and soil organic matter.
PTFs were also generated without stratifying by soil classes for the depths from 0 to 20 and 40 to 70 cm, here denominated as general PTFs, in order to verify the efficiency of the separation of the data by soil classes, and also for users of PTFs where the soil class is not available.
The performance of the PTFs was evaluated through statistical indicators: the coefficient of determination (R²), the mean error (ME), the root mean square error (RMSE), and graphically by the 1:1 ratio of the estimated data versus the observed. The ME and RMSE were obtained through the following equations (1 and 2):
Figure 1 – Municipalities where the forest plantations are located, in the central-southern Rio Grande do Sul.
where: n is the number of observations, ei is the estimated value by PTF of the variable of interest and the mi is the measured value of the variable of interest.
The ME is an indicator of the accuracy of the estimative that reveals the tendency of PTF to overestimate (positive values) or to underestimate (negative values), while RMSE quantifies the dispersion of the measured data in relation to the estimated data. Based on the results of the statistical indicators, general and specific PTFs were compared ranking them according to the lowest absolute value of the ME, RMSE and the highest R². PTFs that presented any two of the three appraised indexes as best (low ME, low RMSE, or high R²) were considered as those of best performance (CORNELLIS et al., 2001). For specific PTFs with statistical indexes equal to the general PTFs, the PTF with the lowest ME was considered the best performer. The 1:1 ratio graphics were utilized for verifying the agreement between measured and estimated data.
The values of organic matter, particle size distribution, and soil moisture are presented in dag kg-1, which is numerically equal to weight percentage, to facilitate comparisons and reduce
the conservative effect of the ME and RMSE statistical indicators for low degrees of moisture (OLIVEIRA et al., 2002). Such modification does not alter the accuracy of the PTFs.
RESULTS AND DISCUSSION
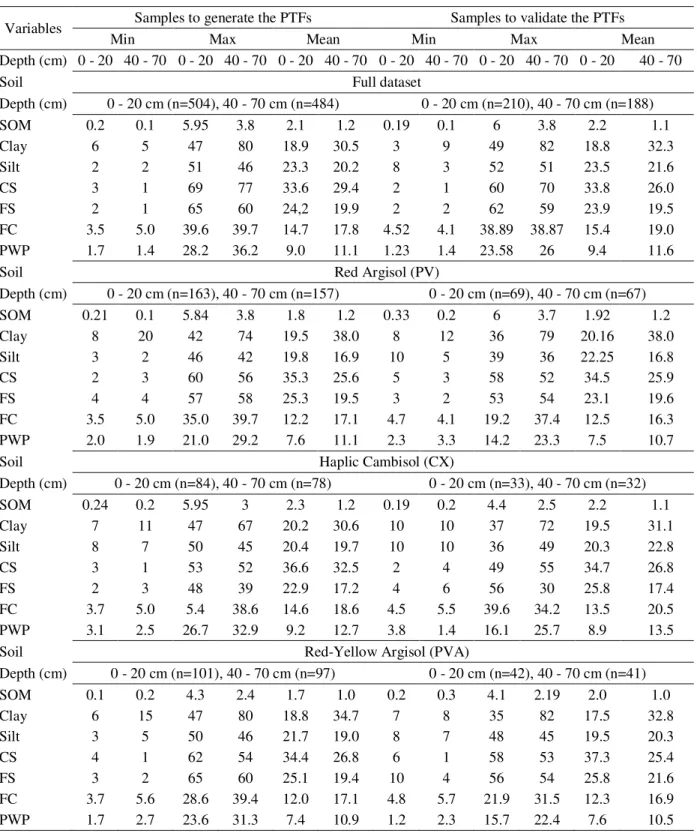
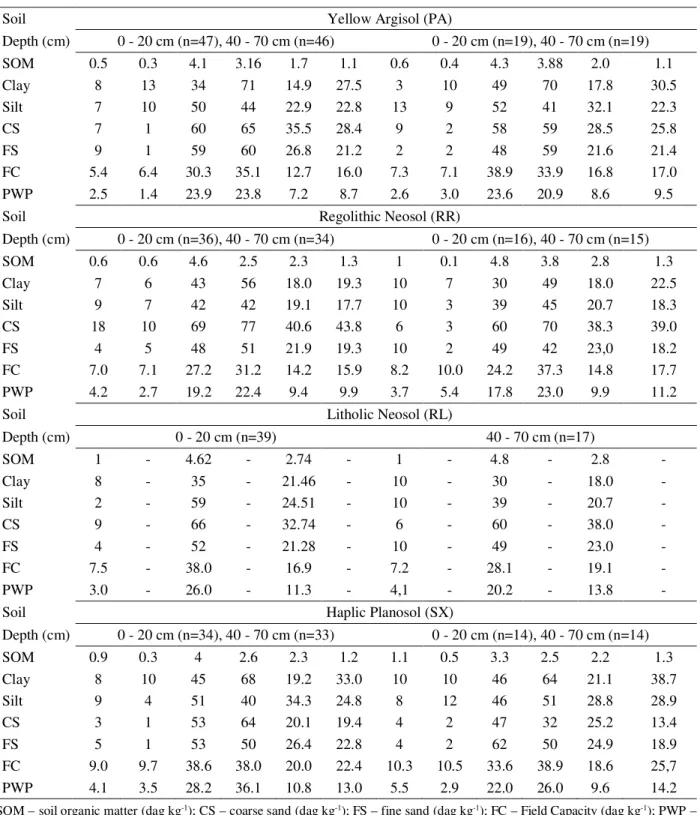
Organic matter, physical properties and water retention Table 2 presents the minimum, maximum, and mean values of the database samples for each soil class used to generate and validate specific PTFs at the 0 to 20 and 40 to 70 cm depths. It can be seen that the samples used to generate PTFs present a distribution similar to that of samples employed to validate PTFs.
There is a wide range in the data, which is favorable and essential for the generation of PTFs (GIAROLA et al., 2002; PACHEPSKY; RAWLS, 1999), and it reflects the different parent materials and soil formation processes of the database. This amplitude of database favors to obtain functions for the whole data and does not imply on functions accuracy.
Table 2 shows that the soil moisture values, at the potential -1500 kPa (PWP) as well as at -33 kPa (FC), are higher at the 40 to 70 cm depth. That is associated to the higher clay content at that depth, mainly due to the significant occurrence of soils with a textural B horizon (PV, PVA and PA) and a planic B (SX). The clay increases the specific area of the soil matrix and as a consequence, favors the water adsorption and retention processes (REICHERT, et al., 2009).
(1)
(2)
Table1 – The complete database of soil classes with their respective geographic distribution.
Where: PV – Red Argisol; CX – Haplic Cambisol; PVA – Red-Yellow Argisol; PA – Yellow Argisol; RR – Regolithic Neosol; RL – Litholic Neosol; SX – Haplic Planosol; TX – Haplic Luvisol; NV – Red Nitosol; RQ – Quartzarenic Neosol; CH – Humic Cambisol; TC – Chromic Luvisol; FT – Argilluvic Plinthosol; PAC – Gray Argisol; MX – Haplic Chernosol; MT – Argilluvic Chernosol; NX – Haplic Nitosol; GX – Haplic Gleisol; GM – Melanic Gleisol; LVA – Red-Yellow Latosol; FX – Haplic Plinthosol; LA – Yellow Latosol; FF – Petric Plintosol; CY – Fluvic Cambisol; RY – Fluvic Neosol.
n 1
ME= (ei-mi)
n i=1
n
i=1
1
RMSE= (ei-mi)²
n
Soil Class ha % Soil Class ha % Soil Class há %
PV 16,899 31.0% RQ 1,058 1.9% GM 71 0.1%
CX 9,574 17.5% CH 616 1.1% LVA 67 0.1%
PVA 7,618 14.0% TC 556 1.0% FX 33 0.1%
PA 4,288 7.9% FT 445 0.8% LA 25 <0.1%
RR 3,504 6.4% PAC 365 0.7% FF 18 <0.1%
RL 2,925 5.4% MX 294 0.5% CY 11 <0.1%
SX 2,824 5.2% MT 257 0.5% RY 2 <0.1%
TX 1,741 3.2% NX 144 0.3%
NV 1,157 2.1% GX 90 0.2%
Table 2 – Minimum, maximum, and mean values in the database used to generate and validate the pedotransfer functions (PTFs) at two soil depths.
Continued...
Variables Samples to generate the PTFs Samples to validate the PTFs
Min Max Mean Min Max Mean
Depth (cm) 0 - 20 40 - 70 0 - 20 40 - 70 0 - 20 40 - 70 0 - 20 40 - 70 0 - 20 40 - 70 0 - 20 40 - 70
Soil Full dataset
Depth (cm) 0 - 20 cm (n=504), 40 - 70 cm (n=484) 0 - 20 cm (n=210), 40 - 70 cm (n=188)
SOM 0.2 0.1 5.95 3.8 2.1 1.2 0.19 0.1 6 3.8 2.2 1.1
Clay 6 5 47 80 18.9 30.5 3 9 49 82 18.8 32.3
Silt 2 2 51 46 23.3 20.2 8 3 52 51 23.5 21.6
CS 3 1 69 77 33.6 29.4 2 1 60 70 33.8 26.0
FS 2 1 65 60 24,2 19.9 2 2 62 59 23.9 19.5
FC 3.5 5.0 39.6 39.7 14.7 17.8 4.52 4.1 38.89 38.87 15.4 19.0
PWP 1.7 1.4 28.2 36.2 9.0 11.1 1.23 1.4 23.58 26 9.4 11.6
Soil Red Argisol (PV)
Depth (cm) 0 - 20 cm (n=163), 40 - 70 cm (n=157) 0 - 20 cm (n=69), 40 - 70 cm (n=67)
SOM 0.21 0.1 5.84 3.8 1.8 1.2 0.33 0.2 6 3.7 1.92 1.2
Clay 8 20 42 74 19.5 38.0 8 12 36 79 20.16 38.0
Silt 3 2 46 42 19.8 16.9 10 5 39 36 22.25 16.8
CS 2 3 60 56 35.3 25.6 5 3 58 52 34.5 25.9
FS 4 4 57 58 25.3 19.5 3 2 53 54 23.1 19.6
FC 3.5 5.0 35.0 39.7 12.2 17.1 4.7 4.1 19.2 37.4 12.5 16.3
PWP 2.0 1.9 21.0 29.2 7.6 11.1 2.3 3.3 14.2 23.3 7.5 10.7
Soil Haplic Cambisol (CX)
Depth (cm) 0 - 20 cm (n=84), 40 - 70 cm (n=78) 0 - 20 cm (n=33), 40 - 70 cm (n=32)
SOM 0.24 0.2 5.95 3 2.3 1.2 0.19 0.2 4.4 2.5 2.2 1.1
Clay 7 11 47 67 20.2 30.6 10 10 37 72 19.5 31.1
Silt 8 7 50 45 20.4 19.7 10 10 36 49 20.3 22.8
CS 3 1 53 52 36.6 32.5 2 4 49 55 34.7 26.8
FS 2 3 48 39 22.9 17.2 4 6 56 30 25.8 17.4
FC 3.7 5.0 5.4 38.6 14.6 18.6 4.5 5.5 39.6 34.2 13.5 20.5
PWP 3.1 2.5 26.7 32.9 9.2 12.7 3.8 1.4 16.1 25.7 8.9 13.5
Soil Red-Yellow Argisol (PVA)
Depth (cm) 0 - 20 cm (n=101), 40 - 70 cm (n=97) 0 - 20 cm (n=42), 40 - 70 cm (n=41)
SOM 0.1 0.2 4.3 2.4 1.7 1.0 0.2 0.3 4.1 2.19 2.0 1.0
Clay 6 15 47 80 18.8 34.7 7 8 35 82 17.5 32.8
Silt 3 5 50 46 21.7 19.0 8 7 48 45 19.5 20.3
CS 4 1 62 54 34.4 26.8 6 1 58 53 37.3 25.4
FS 3 2 65 60 25.1 19.4 10 4 56 54 25.8 21.6
FC 3.7 5.6 28.6 39.4 12.0 17.1 4.8 5.7 21.9 31.5 12.3 16.9
Table 2 – Continued.
SOM – soil organic matter (dag kg-1); CS – coarse sand (dag kg-1); FS – fine sand (dag kg-1); FC – Field Capacity (dag kg-1); PWP –
Permanent Wilting Point (dag kg-1); n - number of samples used.
Soil Yellow Argisol (PA)
Depth (cm) 0 - 20 cm (n=47), 40 - 70 cm (n=46) 0 - 20 cm (n=19), 40 - 70 cm (n=19)
SOM 0.5 0.3 4.1 3.16 1.7 1.1 0.6 0.4 4.3 3.88 2.0 1.1
Clay 8 13 34 71 14.9 27.5 3 10 49 70 17.8 30.5
Silt 7 10 50 44 22.9 22.8 13 9 52 41 32.1 22.3
CS 7 1 60 65 35.5 28.4 9 2 58 59 28.5 25.8
FS 9 1 59 60 26.8 21.2 2 2 48 59 21.6 21.4
FC 5.4 6.4 30.3 35.1 12.7 16.0 7.3 7.1 38.9 33.9 16.8 17.0
PWP 2.5 1.4 23.9 23.8 7.2 8.7 2.6 3.0 23.6 20.9 8.6 9.5
Soil Regolithic Neosol (RR)
Depth (cm) 0 - 20 cm (n=36), 40 - 70 cm (n=34) 0 - 20 cm (n=16), 40 - 70 cm (n=15)
SOM 0.6 0.6 4.6 2.5 2.3 1.3 1 0.1 4.8 3.8 2.8 1.3
Clay 7 6 43 56 18.0 19.3 10 7 30 49 18.0 22.5
Silt 9 7 42 42 19.1 17.7 10 3 39 45 20.7 18.3
CS 18 10 69 77 40.6 43.8 6 3 60 70 38.3 39.0
FS 4 5 48 51 21.9 19.3 10 2 49 42 23,0 18.2
FC 7.0 7.1 27.2 31.2 14.2 15.9 8.2 10.0 24.2 37.3 14.8 17.7
PWP 4.2 2.7 19.2 22.4 9.4 9.9 3.7 5.4 17.8 23.0 9.9 11.2
Soil Litholic Neosol (RL)
Depth (cm) 0 - 20 cm (n=39) 40 - 70 cm (n=17)
SOM 1 - 4.62 - 2.74 - 1 - 4.8 - 2.8 -
Clay 8 - 35 - 21.46 - 10 - 30 - 18.0 -
Silt 2 - 59 - 24.51 - 10 - 39 - 20.7 -
CS 9 - 66 - 32.74 - 6 - 60 - 38.0 -
FS 4 - 52 - 21.28 - 10 - 49 - 23.0 -
FC 7.5 - 38.0 - 16.9 - 7.2 - 28.1 - 19.1 -
PWP 3.0 - 26.0 - 11.3 - 4,1 - 20.2 - 13.8 -
Soil Haplic Planosol (SX)
Depth (cm) 0 - 20 cm (n=34), 40 - 70 cm (n=33) 0 - 20 cm (n=14), 40 - 70 cm (n=14)
SOM 0.9 0.3 4 2.6 2.3 1.2 1.1 0.5 3.3 2.5 2.2 1.3
Clay 8 10 45 68 19.2 33.0 10 10 46 64 21.1 38.7
Silt 9 4 51 40 34.3 24.8 8 12 46 51 28.8 28.9
CS 3 1 53 64 20.1 19.4 4 2 47 32 25.2 13.4
FS 5 1 53 50 26.4 22.8 4 2 62 50 24.9 18.9
FC 9.0 9.7 38.6 38.0 20.0 22.4 10.3 10.5 33.6 38.9 18.6 25,7
Generation and validation of specific pedotransfer functions
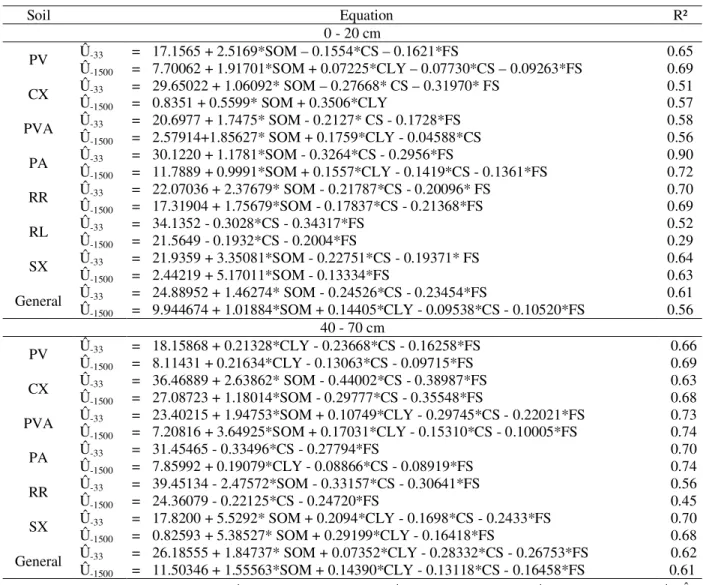
Table 3 shows PTFs for all samples at the -33 kPa and -1500 kPa potentials, with their respective R². For the RL soil, the data were insufficient to generate PTFs at the depth above 40 cm as this is, by definition, soil shallower than 50 cm (EMBRAPA, 2006).
Stratifying the soil class data generated PTFs with R² very close or above that of the general PTFs, except for RL and RR, which presented much lower coefficients of determination at the 0 to 20 and 40 to 70 cm depths and at the potentials of -1500 kPa (0.29 and 0.45, respectively)
compared to general PTFs (0.56 and 0.61, respectively). Possibly, that occurred because RL, as well as RR, are very poorly developed soils (by definition they do not have a B horizon), tending to present a wide variation in their mineralogy (EMBRAPA, 2003; OLIVEIRA et al., 2002; REICHERT et al., 2009). It can be observed that at the 0-20 cm depth and -1500 kPa matric potential, the RR presents a R² value of 0.69, probably reflecting the relatively higher weathering degree of this layer, decreasing the mineralogical variability. A similar trend was verified by Oliveira et al. (2002), who generated PTFs for soils with different degr ees of pedogenetic
Soil Equation R²
0 - 20 cm
PV Û-33 = 17.1565 + 2.5169*SOM – 0.1554*CS – 0.1621*FS 0.65
Û-1500 = 7.70062 + 1.91701*SOM + 0.07225*CLY – 0.07730*CS – 0.09263*FS 0.69
CX Û-33 = 29.65022 + 1.06092* SOM – 0.27668* CS – 0.31970* FS 0.51
Û-1500 = 0.8351 + 0.5599* SOM + 0.3506*CLY 0.57
PVA Û-33 = 20.6977 + 1.7475* SOM - 0.2127* CS - 0.1728*FS 0.58
Û-1500 = 2.57914+1.85627* SOM + 0.1759*CLY - 0.04588*CS 0.56
PA Û-33 = 30.1220 + 1.1781*SOM - 0.3264*CS - 0.2956*FS 0.90
Û-1500 = 11.7889 + 0.9991*SOM + 0.1557*CLY - 0.1419*CS - 0.1361*FS 0.72
RR Û-33 = 22.07036 + 2.37679* SOM - 0.21787*CS - 0.20096* FS 0.70
Û-1500 = 17.31904 + 1.75679*SOM - 0.17837*CS - 0.21368*FS 0.69
RL Û-33 = 34.1352 - 0.3028*CS - 0.34317*FS 0.52
Û-1500 = 21.5649 - 0.1932*CS - 0.2004*FS 0.29
SX Û-33 = 21.9359 + 3.35081*SOM - 0.22751*CS - 0.19371* FS 0.64
Û-1500 = 2.44219 + 5.17011*SOM - 0.13334*FS 0.63
General Û-33 = 24.88952 + 1.46274* SOM - 0.24526*CS - 0.23454*FS 0.61
Û-1500 = 9.944674 + 1.01884*SOM + 0.14405*CLY - 0.09538*CS - 0.10520*FS 0.56
40 - 70 cm
PV Û-33 = 18.15868 + 0.21328*CLY - 0.23668*CS - 0.16258*FS 0.66
Û-1500 = 8.11431 + 0.21634*CLY - 0.13063*CS - 0.09715*FS 0.69
CX Û-33 = 36.46889 + 2.63862* SOM - 0.44002*CS - 0.38987*FS 0.63
Û-1500 = 27.08723 + 1.18014*SOM - 0.29777*CS - 0.35548*FS 0.68
PVA Û-33 = 23.40215 + 1.94753*SOM + 0.10749*CLY - 0.29745*CS - 0.22021*FS 0.73
Û-1500 = 7.20816 + 3.64925*SOM + 0.17031*CLY - 0.15310*CS - 0.10005*FS 0.74
PA Û-33 = 31.45465 - 0.33496*CS - 0.27794*FS 0.70
Û-1500 = 7.85992 + 0.19079*CLY - 0.08866*CS - 0.08919*FS 0.74
RR Û-33 = 39.45134 - 2.47572*SOM - 0.33157*CS - 0.30641*FS 0.56
Û-1500 = 24.36079 - 0.22125*CS - 0.24720*FS 0.45
SX Û-33 = 17.8200 + 5.5292* SOM + 0.2094*CLY - 0.1698*CS - 0.2433*FS 0.70
Û-1500 = 0.82593 + 5.38527* SOM + 0.29199*CLY - 0.16418*FS 0.68
General Û-33 = 26.18555 + 1.84737* SOM + 0.07352*CLY - 0.28332*CS - 0.26753*FS 0.62
Û-1500 = 11.50346 + 1.55563*SOM + 0.14390*CLY - 0.13118*CS - 0.16458*FS 0.61
Where: SOM – soil organic matter (dag kg-1); CS – coarse sand (dag kg-1); FS – fine sand (dag kg-1); CLY – clay (dag kg-1); Û –
Estimated moisture (dag kg-1); PV – Red Argisol; CX – Haplic Cambisol; PVA – Red-Yellow Argisol; PA – Yellow Argisol; RR –
Regolithic Neosol; RL – Litholic Neosol; SX – Haplic Planosol.
development from Pernambuco. Only the specific PTF for Neosols presented significant R² variation when compared to PTF without division by soil development degree.
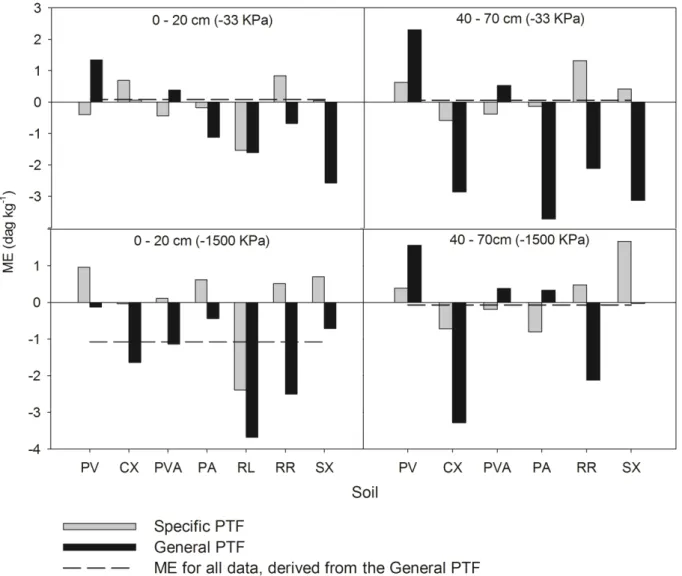
Figures 2, 3, and 4 present the ME, RMSE, and the graphs of the 1:1 ratios of the specific PTF results for each soil class and of the general PTFs for each depth. The general MEs, for the potential of -33 kPa at the depths from 0 to 20 and 40 to 70 cm, were 0.08 and 0.06 dag kg-1, and for the -1500 kPa potential, were -1.08 and -0.07 dag kg-1, respectively, showing the trend of the general PTFs to overestimate the moisture value for the -33 kPa potential and underestimate it for the potential of -1500 kPa. That same behavior was also
verified in the works of Nebel et al. (2010), Reichert et al. (2009), and Tomasella et al. (2000).
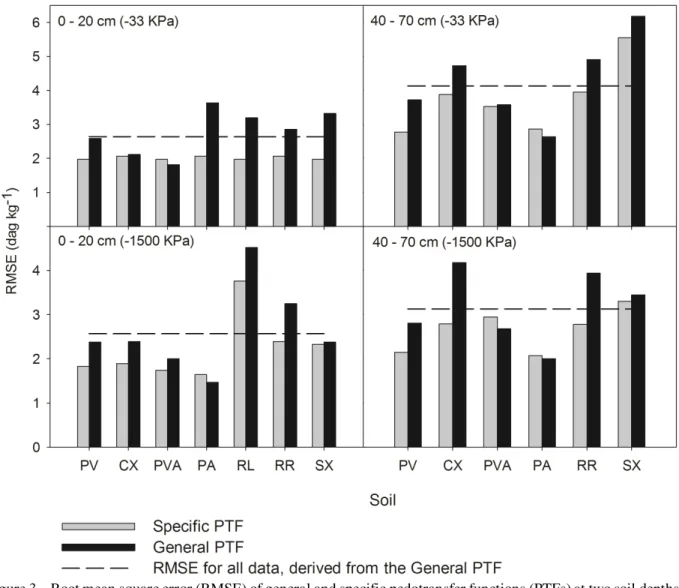
The values were underestimated mainly in the very poorly developed soils (RL and RR), and poorly developed soil (CX) at the potential of -1500 kPa and using general PTFs. When stratified by soil classes, specific PTFs of those soils had a reduced absolute ME value (Figure 2). Such behavior indicates the need for generation of more specific PTFs for such soils. That is confirmed in figure 3, where for all of the situations, the RMSEs of RR, RL and CX specific PTFs were considerably lower compared with general PTFs.
For practically all soils, PTFs presented lower RMSEs when separated into soil classes. When that did
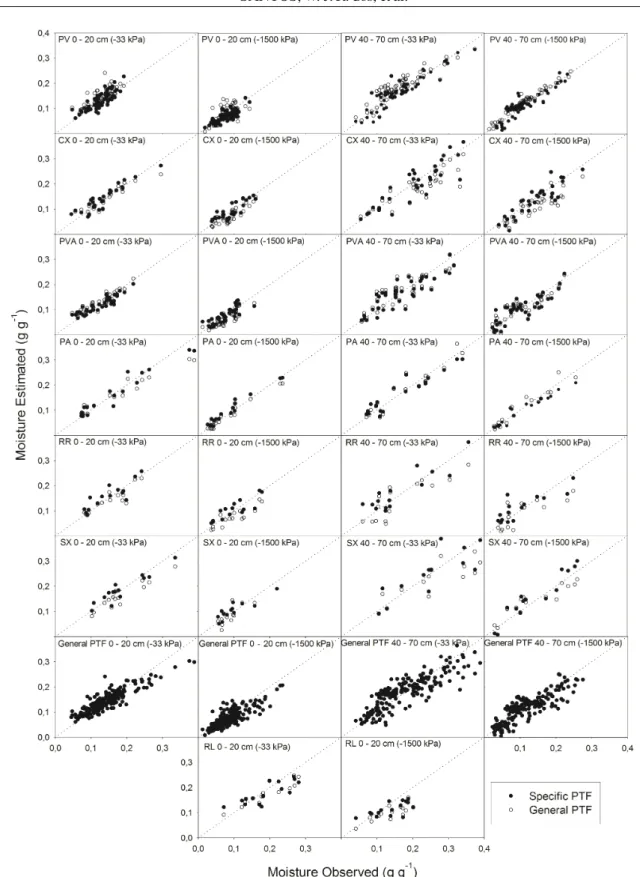
not occur, the RMSE values were very close (Figure 3), as in PVA at the potential of -33 kPa at the 0 to 20 cm depth, PA at the potential of -1500 kPa at the depth from 0 to 20 cm and in the two appraised potentials for the 40 to 70 cm depth, and SX at the potential of -1500 kPa at the 40 to 70 cm depth. However, in figure 4, it can be seen that the results between the estimated and observed data in those soils presented very similar results to those of both PTFs (general and specific).
According to the ranking among specific and general PTFs, at the potential of -33 kPa at the 0 to 20 cm depth, only the CX and PVA soils presented better results with general PTFs. Nevertheless, under such conditions, the performance between specific and
general PTFs was similar, that can be confirmed by the behavior of the observed and estimated data for those soils in figure 4.
Out of the 26 analyzed conditions (2 potentials x 7 soil classes-depth from 0 to 20 cm + 2 potentials x 6 soil classes-depth from 40 to 70 cm), specific PTFs were shown less efficient in only four conditions, but with results very close to general PTFs, indicating that the stratifying of the data by soil classes presented better result in most of th e cases, because th e more homogeneous the soils that compose the database for the generation of the PTFs, the better the data estimative, as also observed by Piedallu et al. (2011); Poggio et al. (2010) and Santra and Das (2008).
Figure 4 – 1:1 ratio graphics between observed and estimated values through pedotransfer functions (PTFs) generated at two soil depths.
-CONCLUSIONS
For the soils studied in the central-south portion of Rio Grande do Sul, water retention data at the 33 and -1500 kPa potentials can be reliably estimated from simple attributes such as particle size distribution and soil organic matter through PTFs.
In the vast majority of situations, the stratifying of the data by soil classes increased the accuracy of PTFs for the soils in the central-south portion of Rio Grande do Sul, above all for the less pedogenetically-developed soils.
ACKNOWLEDGEMENTS
The authors thank FAPEMIG, CNPq and CAPES for the financial support.
REFERENCES
AKAIKE, H. A new look at the statistical model
identification. IEEE Transactions on Automatic Control, v.19, n.6, p.716–723, 1974.
BALLAND, V.; POLLACCO, A. P.; ARP, P. Modeling soil hydraulic properties for a wide range of soil conditions. Ecological Modelling, Amsterdam, v.219, p.300-316, 2008.
BELL, M.A.; VAN KEULEN, H. Soil pedotransfer functions for four Mexican soils. Soil Science Society of America Journal, Madison, v.59, p.865–871, 1995.
BOUMA, J.; VAN LANEN, J. A. J. Tranfer functions and thresh-old values: from soil characteristics to land qualities. In: BEEK, K. J. (Ed.). Quantified land evaluation. Washington: International Institute of Aerospace Survey Earth, 1987. p.106-110.
CORNELIS, W. M. et al.Evaluation of pedotransfer functions for predicting the soil moisture retention curve. Soil Science Society of America Journal, Madison, v.65, p.638-648, 2001.
DASHTAKI, S. G.; HOMAEE, M.; KHODABERDILOO, H. Derivation and validation of pedotransfer functions for estimating soil water retention curve using a variety of soil data. Soil Use and Management, Malden, v.26, p.68-74, 2010. EMPRESA BRASILEIRA DE PESQUISA
AGROPECUÁRIA. Centro Nacional de Pesquisas de Solos. Manual de métodos de análises de solos. Rio de Janeiro, 1995. 247 p.
EMPRESA BRASILEIRA DE PESQUISA
AGROPECUÁRIA - EMBRAPA. Centro Nacional de Pesquisa de Solos. Manual de métodos de análises de Solos. 2. ed. Rio de Janeiro, 1997. 212 p.
EMPRESA BRASILEIRA DE PESQUISA
AGROPECUÁRIA - EMBRAPA. Centro Nacional de Pesquisa de Solos. Revisão sobre funções de
pedotransferência (PTFs) e novos métodos de predição de classes e atributos do solo. Rio de Janeiro, 2003. 50 p. (Documentos, 45).
EMPRESA BRASILEIRA DE PESQUISA
AGROPECUÁRIA - EMBRAPA. Centro Nacional de Pesquisas de Solos. Sistema brasileiro de classificação de solos. 2. ed. Rio de Janeiro, 2006. 306 p.
GIAROLLA, N. F. B.; SILVA, A. P.; IMHOFF, S. Relações entre propriedades físicas e características de solos da Região Sul do Brasil. Revista Brasileira de Ciência do Solo, Viçosa, v.26, p.885-893, 2002.
KHODAVERDILOO, H. et al. Deriving and validating pedotransfer functions for some calcareous soils. Journal of Hydrology, Amsterdam, v.399, p.93-99, 2011.
MICHELON, J.M. et al. Funções de pedotransferência para estimativa da retenção de água em alguns solos do Rio Grande do Sul. Ciência Rural, Santa Maria, v.41, p.848-853, 2010.
NEBEL, A. L. C. et al. Pedotransfer functions related to spatial variability of water retention attributes for lowland soils. Revista Brasileira de Ciência do Solo, Viçosa, v.34, p. 669-680, 2010.
NEMES, A. et al. Evaluation of the pedotransfer functions for their applicability at the U.S. National Scale. Soil Science Society of America Journal, Madison, v.73, p.1638-1645, 2009.
OLIVEIRA L.B. et al. Funções de pedotransferência para predição da umidade retida a potenciais específicos em solos do Estado de Pernambuco. Revista Brasileira de Ciência do Solo, Viçosa, v.26, p.315-323, 2002.
PIEDALLU, C. et al. Mapping soil water holding capacity over large areas to predict potential production of forest stands. Geoderma, Amsterdam, v.160, p.355-366, 2011.
POGGIO, L. et al. Soil available water capacity interpolation and spatial uncertainty modelling at multiple geographical extents. Geoderma, Amsterdam, v.160, p.175-188, 2010.
REICHERT, J.M. et al. Estimation of water retention under availability in soils of Rio Grande do Sul. Revista Brasileira de Ciência do Solo, Viçosa, v.33, p.1547-1560, 2009.
SANTRA, P.; DAS, B. S. Pedotransfer functions for soil hydraulic properties developed from a hilly watershed of Eastern India. Geoderma, Amsterdam, v.146, p.439-448, 2008.
SCHAAP, M. G.; LEIJ, F. J. ; GENUCHTEN, M. T. Rosetta/ : a computer program for estimating soil hydraulic parameters with hierarchical pedotransfer
functions. Journal of Hydrology, Amsterdam, v.251, p.163-176, 2001.
STUMPP, C. et al. Evaluation of pedotransfer functions for estimating soil hydraulic properties of prevalent soils in a catchment of the Bavarian Alps. European Journal of Forest Research, Heidelberg, v.128, n.6, p.609-620, 2009.
TAVARES FILHO, J. et al. Atributos de solo
determinantes para a estimativa do índice de estabilidade de agregados. Pesquisa Agropecuária Brasileira, Brasilia, v.47, p.436-441, 2012.
TOMASELLA, J.; HODNETT, M. G.; ROSSATO, L. Pedotransfer functions for the estimation of soil water retention in Brazilian soils. Soil Science Society of America Journal, Madison, v.64, p.327- 338, 2000.
TWARAKAVI, N. K. C.; ŠIMÙNEK, J.; SCHAAP, M. G. Development of pedotransfer functions for estimation of soil hydraulic parameters using support vector