2018 | Lavras | Editora UFLA | www.editora.ufla.br | www.scielo.br/cagro http://dx.doi.org/10.1590/1413-70542018426022818
Assessment of soil loss vulnerability in data-scarce
watersheds in southern Brazil
Avaliação da vulnerabilidade à perda de solos em uma bacia hidrográfica
com dados escassos no sul do Brasil
Alice Alonzo Steinmetz1*, Felício Cassalho2, Tamara Leitzke Caldeira1, Vinícius Augusto de Oliveira3, Samuel Beskow1, Luis Carlos Timm4
¹Universidade Federal de Pelotas/UFPEL, Pelotas, RS, Brasil
²Instituto Nacional de Pesquisas Espaciais/INPE, São José dos Campos, SP, Brasil 3Universidade Federal de Lavras/UFLA, Lavras, MG, Brasil
4Universidade Federal de Pelotas/UFPEL, Capão do Leão, RS, Brasil *Corresponding author: alicesteinmetz@gmail.com
Received in October 1, 2018 and approved in November 16, 2018
ABSTRACT
Soil erosion is currently one of the main concerns in agriculture, water resources, soil management and natural hazards studies, mainly due to its economic, environmental and human impacts. This concern is accentuated in developing countries where the hydrological monitoring and proper soil surveys are scarce. Therefore, the use of indirect estimates of soil loss by means of empirical equations stands out. In this context, the present study proposed the assessment of the Revised Universal Soil Loss Equation (RUSLE) with the aid of Geographical Information Systems (GIS) and remote sensing for two agricultural watersheds in southern Rio Grande do Sul – Brazil. Among all RUSLE factors, LS showed the closest patterns to the local when compared to the total annual soil loss, thus being a good indicator t of risk areas. The total annual soil loss varied from 0 to more than 100 t ha-1 yr-1, with the vast majority (about 65% of the total area) classified from slight to moderate rates of soil loss. The results estimated according to RUSLE indicated that over 10% of the study area presented very high to extremely high soil loss rates, thus requiring immediate soil conservation practices. The present study stands out as an important scientific and technical support for practitioners and decision-makers, being probably the first of its nature applied to extreme southern Brazil.
Index terms: Soil erosion; revised universal soil loss equation; geographical information systems; remote sensing.
RESUMO
A erosão do solo é atualmente uma das principais preocupações nos estudos de agricultura, recursos hídricos, manejo do solo e desastres naturais, principalmente devido aos impactos econômicos, ambientais e humanos associados à erosão. Esta situação é agravada nos países em desenvolvimento, onde o monitoramento hidrológico e os levantamentos adequados do solo são escassos. Portanto, destaca-se o uso de estimativas indiretas de perda de solo por meio de equações empíricas. Neste contexto, o presente estudo propôs a aplicação da Equação Universal de Perdas de Solo Revisada (RUSLE) com o auxílio de Sistemas de Informações Geográficas (SIG) e Sensoriamento Remoto para duas bacias hidrográficas agrícolas no Rio Grande do Sul - Brasil. Entre todos os fatores RUSLE, o LS apresentou a distribuição espacial mais próxima quando comparada à perda total anual de solo, sendo um bom indicador de áreas de risco. A perda total anual de solo variou de 0 a mais de 100 t ha-1 ano-1, sendo a grande maioria (cerca de 65% da área total) classificada de leve a moderado níveis de perda de solo. Mais de 10% da área de estudo apresenta níveis altos a extremamente altos de perda de solo, exigindo intervenções imediatas. O presente estudo destaca-se como uma importante ferramenta para praticantes e tomadores de decisão, sendo o primeiro estudo de sua natureza no extremo sul do Brasil.
Termos para indexação: Erosão do solo; equação universal da perda de solo revisada; sistemas de informações
geográficas; sensoriamento remoto.
INTRODUCTION
Due to the strong human, economic, environmental, and social dependence, soil is considered one of the most important natural resources (Abdo; Salloum, 2017a). Soil erosion has been historically treated as one of the most common and relevant environmental threats (Xu; Xu;
Meng, 2012). According to Perović et al. (2013), soil erosion is defined as a complex time and space varying mechanism influenced by different factors (e.g. land use
Water erosion is a natural and irreversible geomorphological phenomenon that results in land degradation and loss of soil fertility (Jiang et al., 2015). According to Beskow et al. (2009), water erosion can be
classified into: i) rill erosion, in which the soil is detached and transported by concentrated flow, and ii) interrill
erosion caused by the soil detachment resulting from the impact of water droplets, which is transported along with surface runoff. As a consequence of the ever-growing population and the intensification of anthropogenic activities, such as agricultural malpractices, urbanization,
deforestation, fire, mining, overgrazing, overstocking,
and use of pesticides (Kisan et al., 2016; Napoli et al., 2016), water erosion has become a severe and globally widespread environmental hazard (Napoli et al., 2016; Abdo; Salloum, 2017a).
Natural hazards caused by soil erosion are grouped as on-site (e.g. changes of soil physical and chemical properties) or off-site such as. damage to hydraulic structures downstream, diversion of streams, deposition
on riverbeds and reservoirs, and floods (Kisan et al., 2016).
Some strategies are adopted to mitigate the impacts of soil erosion in a properly managed watershed (Naqvi et al.,
2013). However, such management practices are directly
dependent on information related to soil loss estimations and mapping (Ganasri; Ramesh, 2016), which are not frequently available to the watershed of interest (Markose; Jayappa, 2016).
Ideally, soil losses are measured on standard plots, but such direct approach is usually neither labor nor time
efficient (Pan; Wen, 2014). Moreover, the availability of such data is limited or inexistent, which hampers the implementation of an efficient watershed management
(Markose; Jayappa, 2016). Even though direct soil loss measurements are indispensable for a sustainable land use management, indirect estimates obtained according to water erosion models have become a widely accepted
approach (Xu; Xu; Meng, 2012). By definition, soil erosion models include several complex interactions among driving mechanisms (Pan; Wen, 2014). These prediction models can be classified into empirical, physical, and conceptual models (Fakhri et al., 2014).
Empirical models are easily applied due to their simple structures and reliability (Chen; Zha, 2016). Several empirical models have been discussed in the literature,
such as the: Bureau of Land Management (BLM),
Ephemeral Gully Erosion Model (EGEM), Erosion Potential Method (EPM), Erosion Productivity Impact Calculator (EPIC), Food and Agriculture Organization Model, Geoland 2 (G2), Musgrave Model, Pacific
Southwest Interagency Committee (PSIAC), Revised
Universal Soil Loss Equation (RUSLE), Scalogram Model, Soil Loss Estimation for Southern Africa (SLEMSA), Stehlik Model, Universal Soil Loss Equation (USLE) (Fakhri et al., 2014).
In contrast to empirical models, physically-based models describe the set of mechanisms controlling the water erosion process, thus better representing the physical world (Beskow et al., 2009; Chen; Zha, 2016). Among
these models, Perović et al. (2013), Fakhri et al. (2014),
and Chen and Zha (2016) highlight the Areal Non-point Source Watershed Environment Response Simulation (ANSWERS), Chemical Runoff and Erosion from Agricultural Management System (CREAMS), European Erosion Simulation (EUROSEM), Griffth University
Erosion System Template (GUEST), EROSION 3D, Kinematic Erosion Simulation (KINEROS), Limburg Soil Erosion Model (LISEM), Modular Soil Erosion
System (MOSES), Pan-European Soil Erosion Risk Assessment (PESERA), and Water Erosion Prediction Project (WEEP). Conceptual (i.e. semi-empirical) models have elements from empirical and physical
models (Fakhri et al., 2014). These authors point out the following conceptual models: Agricultural Non-Point Source Model (AGNPS), Large Scale Catchment Model (LASCAM), Simulator for Water Resources in Rural Basin-Soil and Water Assessment Tool (SWRRB-SWAT), Topographical Model (TOPMODEL), and Water and Tillage Erosion Model (WATEM).
The USLE family models developed by Wischmeier
and Smith (1965) and afterwards revised by Renard et al.
(1991) (Revised Universal Soil Loss Equation – RUSLE) and modified by Williams and Berndt (1977) (Modified Universal Soil Loss Equation – MUSLE) remain as
the most worldwide used tool for estimating spatially distribution of soil erosion due their comprehensive structure and wide availability of input data to be applied along with GIS and remote sensing (Abdo; Salloum, 2017a;
Perović et al., 2013). Differently than its predecessors, the USLE family may be used if its factors are accurately estimated, having as main goals to: i) represent long term
average soil loss by means of a single number, ii) predict soil loss from local meteorological and soil data, and iii) be free from geographically oriented bases (Renard et
al., 1997). It should be mentioned that the USLE family
Although these models have been proposed in a developed country there is a large amount of available data, they have been used to estimate soil loss in developing countries. Recent applications are found in Brazil (Beskow
et al., 2009; Oliveira et al., 2014), India (Kisan et al., 2016), Serbia (Perović et al., 2013), Syria (Abdo; Salloum, 2017a), and Turkey (Ozcan et al., 2008), reinforcing the
importance of such models in developing countries, where
the use of more complex models is limited due to the lack of adequate input data (Perović et al., 2013).
The present study proposes the application of the RUSLE coupled with GIS and remote sensing techniques in two data-scarce watersheds in southern Brazil: Fragata
river watershed (FRW) and Pelotas river watershed (PRW).
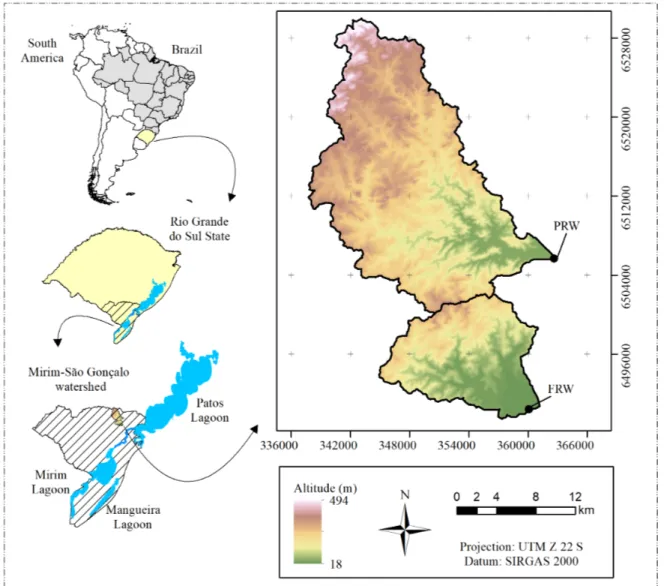
These watersheds are part of the Mirim-São Gonçalo
watershed (MSGW), which is a transboundary watershed
with a drainage area of approximately 62,250 km², where 47% is located in Brazil and the remaining 53%
in Uruguayan territory. MSGW plays a fundamental economic role in the south of Rio Grande do Sul state as it is the main source of water for agriculture, public supply and transportation. In addition, according to the Brazilian
Atlas of Natural Disasters (CEPED, 2013), MSGW has a high incidence of natural disasters due to floods which may aggravate the erosion processes. In this context, the main objectives are to: i) estimate the total annual
soil loss, ii) identify the most susceptible locations with respect to soil erosion in order to aid decision-makers in the proposal of watershed and soil management practices in the FRW and PRW.
MATERIAL AND METHODS
Study area
The annual soil loss was estimated for two
data-scarce watersheds located in Southern Brazil, the Fragata river watershed (FRW) and Pelotas river watershed (PRW).
These watersheds are the main tributaries of an important transboundary river watershed, the Mirim-São Gonçalo watershed (MSGW). The MSGW is located between the latitudes 31º30’S and 34º30’S and longitudes 52ºW and 56ºW, with a drainage area of approximately 62,250 km², in which 47% and 53% are located in the Brazilian and
Uruguayan territories, respectively (Figure 1).
The irrigated rice production stands out as the main
agricultural activity in the Brazilian territory of the MSGW, playing an important role in both economic and social sectors, followed by soybeans, wheat, and corn. In addition, it also contains preservation areas of ecological systems
such as the Taim Ecological Station, which is recognized by the United Nations Educational Scientific and Cultural
Organization (UNESCO) as a Biosphere Reserve.
The FRW and PRW are located in southern Rio
Grande do Sul State (Figure 1), having a drainage area
of 132 km² and 368 km², respectively. According to the Köppen classification method, the regional climate is classified as Cfa, and has a humid oceanic climate with
hot summer; the mean annual temperature is 17.8 °C,
mean annual minimum and maximum temperatures range from 13.8 to 22.9 °C, while mean annual precipitation
corresponds to 1,367 mm.
The Revised Universal Soil Loss Equation (RUSLE)
The RUSLE model (Equation 1) estimates the long-term annual average soil loss under specific conditions, such as rill and inter-rill erosion (Renard; Freimund, 1994).
Inter-rill erosion occurs when soil particles are detached by
raindrops and transported by shallow overland flows, whereas
rill erosion is the detachment and transport of soil particles
by concentrated flows. This detached soil is then transported
and delivered as sediment downstream (Silva; Montenegro;
Santos, 2012). To evaluate the potential soil loss and its distribution in the FRW and PRW, the RUSLE model was
applied within a GIS environment with the aid of map algebra.
A = R × K × LS × C × P (1)
where A is average annual soil loss (t ha-1 yr-1), R refers
to rainfall erosivity factor (MJ mm ha-1 h-1 yr-1), K
corresponds to soil erodibility factor (t h MJ-1 mm-1), LS
is hillslope length and steepness factor (dimensionless), C corresponds to cover management factor (dimensionless), and P is the erosion control practice factor (dimensionless).
Rainfall erosivity (R)
Rainfall erosivity (R) represents the potential of
rainfall to cause erosion in a given unprotected soil. The R factor, which is influenced by rainfall intensity and
raindrop size (Beskow et al., 2009), takes into account both total precipitation and raindrops kinetic energy. It is calculated by the product of rainfall kinetic energy
and the maximum 30-minute rainfall intensity (EI30)
(Pandey; Chowdary; Mal, 2007; Wischmeier; Smith,
1978). The R factor is often determined from rainfall
intensity information whenever such data are available
(Bagherzadeh, 2014). Due to lack of detailed rainfall
records, the rainfall erosivity map of the present study was generated based on geostatistical procedures in accordance
Figure 1: Location of the Mirim-São Gonçalo watershed in the Brazil, the study area and digital elevation models of Fragata and Pelotas river watersheds.
Thus, the multivariate geographical model proposed by Mello et al. (2013) for Southern Brazil was applied (Equation 2). This multivariate model allows
the estimation of the mean annual rainfall erosivity from latitude, longitude and altitude of each cell,
characterizing the R factor in a distributed manner. The
model for estimating the R factor in Southern Brazil
region is given by (Mello et al., 2013):
R = 2610770 – 60.44 × A + 98839 × LO – 1114.68
× LA2 + 938.47
× LO2 – 1.185
× A
× LO + 1.1885 × LA2× LO2 + 0.01494 × LA2
× LO3
(2)
where R is average annual erosivity (MJ mm ha-1 h-1 yr-1), A is altitude (m), LA corresponds to latitude and LO refers
to longitude, both in negative decimal degrees.
R values may be highly variable worldwide, with the highest values found for tropical regions. In a literature review Oliveira, Wendland and Nearing (2012) observed that R values for tropical regions were found to be as low as 2,980 MJ mm ha-1 h-1 yr-1 (in Honduras) and as high as 33,500 MJ mm ha-1 h-1 yr-1 in the Australian tropics. While,
values for Brazilian conditions adopted Carvalho (2008)
is presented in Table 1. Soil erodibility (K)The K factor corresponds to the soil erodibility or the soil intrinsic susceptibility to erosion, which reflects
the spatial variability of possible soil erosion depending on its structural and compositional characteristics (Abdo;
Salloum, 2017b). This factor can be determined through experiments carried out in field plots; however, field trials for estimating the K factor are expensive and time consuming. Therefore, it is commonly obtained from predefined estimates (Beskow et al., 2009).
The spatial distribution of the main soil types found
in the study area, as proposed by Cunha, Silveira and
Severo (2006), is depicted in Figure 2. This map was used as a reference to define the spatially distributed K factor.
Table 1: R factor values classes according to Carvalho (2008).
Erosivity
(MJ mm ha-1 h-1 yr-) Erosivity class
0 – 2,452 Low erosivity
2,452 – 4,905 Medium erosivity
4,905 – 7,357 Medium-strong erosivity
7,357 – 9,810 Strong erosivity
>9,810 Very strong erosivity
Based on the main soil classes (Figure 2) and on the published literature reporting soil erodibility values for soil classes observed in different regions of Brazil, the K
values used in this study are presented in Table 2.
represent larger disaggregation of soils due to rainfall
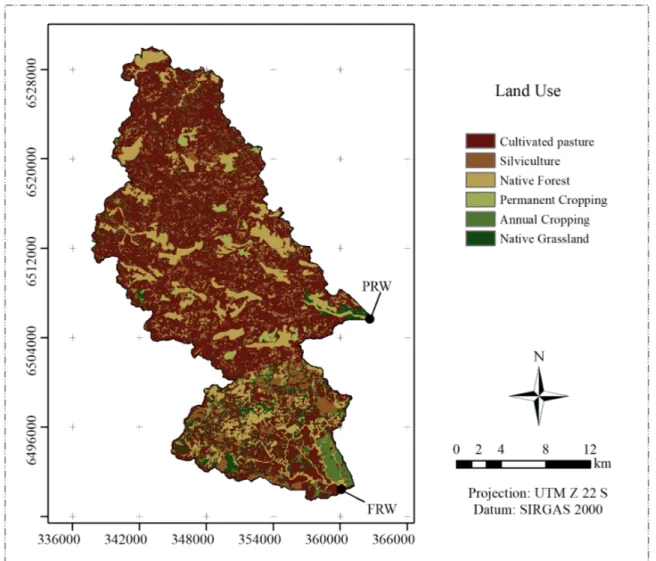
droplet impact and surface runoff (Oliveira et al., 2014). C values were obtained from the land use map (Figure 3)
combined with published literatures regarding such factor
for different regions of Brazil (Table 3).
The land use map (Figure 3) was generated from the Landsat 5 images provided by the National Institute for Space Research (INPE). These images
were interpreted with the aid of a supervised spectral
classification using the maximum likelihood method. This interpretation took into account 200 known land use field samples, which were obtained through Global
Positioning System (GPS).
Erosion control practice factor (P)
The erosion control practice factor (P) is the ratio
between soil erosion under a particular support practice and that observed uphill and downhill slope cultivation
(Pandey; Chowdary; Mal, 2007). The P factor varies from 0 to 1 and expresses the potential of the surface and
management practices to reduce soil erosion (Oliveira et
al., 2014). The lower the P factor, the more effective the
conservation practice is in terms of reduction in the soil
erosion (Bagherzadeh, 2014). The P factor was considered
to be 1 for both FRW and PRW, since no erosion control practices were identified. Several studies have also
considered this factor as 1 due to the lack of significant
erosion control practices, such as Abdo and Salloum (2017a), Bera et al. (2017), Beskow et al. (2009), Oliveira
et al. (2014) and Ozsoy et al. (2012).
RESULTS AND DISCUSSION
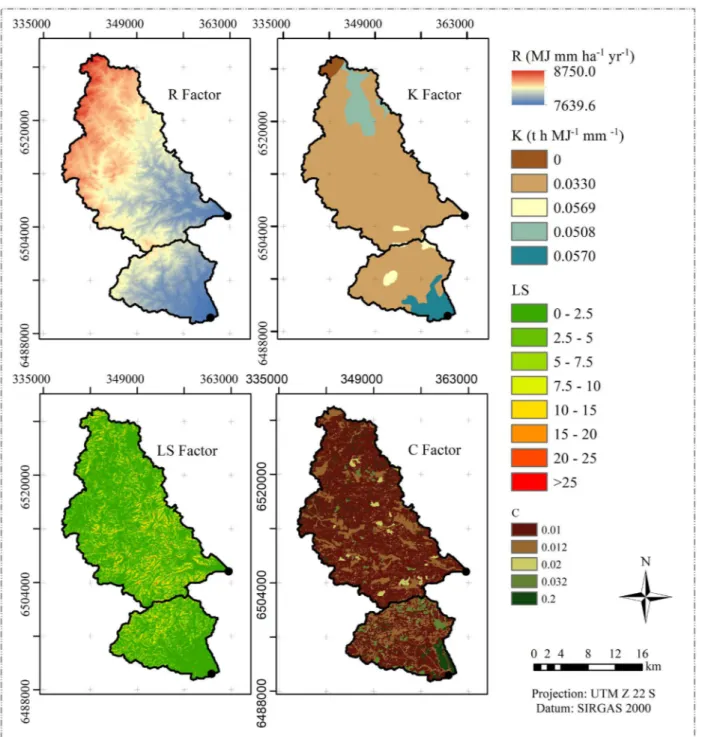
According to Naqvi et al. (2013), R is one of the most important factors influencing the soil loss rate. As shown in Figure 4, the study area presents low variability in terms of R values (7,640 to 8,750 MJ mm ha-1 h-1 yr-1).
Despite the low variability, the R values observed for the study region are considerably higher when compared to those reported in studies conducted worldwide. In a study
in the Mashhad plain – Iran, Bagherzadeh (2014) found R values ranging from 107 to 146 MJ mm ha-1 h-1 yr-1; Jiang et al. (2015) got R values for the Lower Jinsha River Basin – China from 923.5 to 2,534.9 MJ mm ha-1 h-1 yr-1; Ganasri and Ramesh (2016) estimated maximum R values up to 4,711.4 MJ mm ha-1 h-1 yr-1 for the Nethravathi Basin in southern India. However, higher values might be expected
when considering Brazilian conditions. On conducted a study in the Rio Verde basin, situated in southeastern
Brazil, Oliveira et al. (2014) observed R values ranging
Table 2: K factor values adopted in this study.
Soil class K fator
(t h MJ-1 mm-1) Reference Neosol 0.0569 Marques et al. (1997)
Planosol 0.0570 Silva, Paiva and Santos (2009)
Cambisol 0.0508 Araújo, Salviano and Neto (2011)
Argisol 0.0330 Sá et al. (2004)
Topographic factor (LS)
The topographic factor (LS) represents the intrinsic
impact of the terrain on soil erosion with respect to the direct surface runoff movement on a hillslope; this representation is considered by means of the slope steepness (S) and slope
length (L) factors (Beskow et al., 2009; Biswas; Pani, 2015). Thus, the LS factor (Equation 3) depends not only on steepness and length of slope but also on the flow expected
to occur on land and later to be concentrated in the water
courses (Saygın et al., 2014). LS-factor layer was derived
from the Digital Elevation Model (DEM) with a spatial
resolution of 30 m. The LS equation considered in this study was presented by Abdo and Salloum (2017a):
0.4 1.3
sin( )
22.13 0.0896
FA CS S
LS
(3)
where FA is the flow accumulation expressed as the
number of grid cells, CS is the raster spatial resolution (m), and S is the slope (degrees). All the parameters of this equation are represented by means of a raster map, i.e.
there is a value for each 30-m cell of the map.
Cover management factor (C)
Vegetation plays an important role in protecting soil from erosion by dissipating the kinetic energy
of raindrops and reducing runoff speed. The cover
Table 3: C factor values for the each land use in the FRW and PRW.
Land use C factor Reference
Native forest 0.012 Farinasso et al. (2006)
Planted forest 0.032 Adapted from Panagos et al. (2015)
Annual cropping 0.2 Adapted from Panagos et al. (2015)
Cultivated pasture 0.01 Tomazoni et al. (2005)
Native grassland 0.01 Tomazoni et al. (2005)
Permanent cropping 0.02 Adapted from Panagos et al. (2015)
Figure 3: Land use maps for the Fragata (FRW) and Pelotas (PRW) river watersheds.
from 7,086 to 15,115 MJ mm ha-1 h-1 yr-1. Also, Durães,
Coelho Filho and Oliveira (2016) determined R values
Figure 4: Rainfall erosivity (R), Soil erodibility (K), Topographic (LS) and Conservation support practice (P) factors for Fragata and Pelotas river watershed.
The R values presented in Figure 4 also corroborate Mello et al. (2013) who considered datasets from 733
rain gauges when estimating spatially distributed rainfall
erosivity for Brazil. The aforementioned authors found a
high variability in terms of R values in the country, ranging
from 2,224 in the driest areas (Brazilian northeast) to more than 23,000 MJ mm ha-1 h-1 yr-1 in the Amazon rainforest.
values, while PRW presented larger R values, especially in the headwater region. In addition, it should be pointed out the importance in considering the spatial distribution of R, as the application of a mean value for the entire study area has been a common practice. Nonetheless, the entire
study area’s erosivity may be classified as Strong erosivity
according to Carvalho (2008).
Figure 4 also presents the spatial distribution of the
soil erodibility factor (K) which follows the previously
mentioned map of soil classes (Figure 2). The lowest
value of the K factor was attributed to the region of PRW covered by rock outcrop. For this area, a K value of 0 was attributed, since there is no structured soil and therefore no soil erosion. A low K value was also set to the most frequent soil class found in the study area (Argissol). Sá
et al. (2004) estimated Argisols erodibility based on soil
desagregations by ultrasound analysis and recommended
the use of K values of 0.033 t h MJ-1 mm-1. Smaller portions
of the watersheds having Neosols and Cambisols are
also found in higher altitudes. These less developed soils present higher K values (Table 2) according to Marques
et al. (1997) and Araújo, Salviano and Neto (2011),
who carried out studies in Brazil. The predominance of
Argisols over Neosols and Cambisol may lower annual soil losses in the highlands, which may be considered the most vulnerable regions due to their greater R and slope
factor (S) values. The higher values of K are found in the flattest regions of FRW, where there is predominance of
Planosols. As adopted by Silva, Paiva and Santos (2009) for a watershed situated between the Brazilian States of Pernambuco and Alagoas, a K value of 0.057 was set to the Planosols in the present study.
A special attention should be given to the topographic factor, since it characterizes the surface runoff speed, in other words, it is a good indication of soil
erosion risk (Beskow et al., 2009). The spatial distribution of the LS factor (Figure 4) indicates that about 98 and 96% of the FRW and PRW, respectively, had values less
than 10. According to Beskow et al. (2009), areas with
LS values greater than 10 can be considered as high
vulnerability to erosion, thus conservation practices are generally encouraged in order to reduce runoff energy
gain due to the topography. The greatest LS values are
not concentrated but rather spatially distributed in both watersheds, reinforcing the need of a broad watershed erosion management.
Relative to the cover management factor (C), there
was a predominance of low values (Figure 4) associated with cultivated pasture and forested areas (Figure 3). Greater LS values were mostly observed in areas with
cultivated pasture and areas covered by native forest, thereby implying in the reduction of the resulting annual soil loss when applying Equation 1. Moreover, there was a concentration of higher C values in the southern region
of FRW as a result of annual cropping. These areas also presented a concentration of low R and LS values (Figure 4), which may reduce the resulting soil loss rates.
On the other hand, since most of this area is covered by Planosols, where the greatest soil erodibility values are found, a rather spatially heterogeneous soil erosion vulnerability is observed (Figure 5).
Figure 5 illustrates the spatial distribution of the soil erosion vulnerability in FRW and PRW resulting
from the interaction among the aforementioned RUSLE factors (Figure 4). Several soil erosion classification
methods are presented in the literature. Among these methods, those proposed by Abdo and Salloum (2017a)
for Syria, and by Bagherzadeh (2014) for Iran should be highlighted. The qualitative classification considered
in the present study was proposed by Beskow et al.
(2009) for Brazilian conditions. This method divides
the soil loss rates into classes ranging from “slight” to
“extremely high” according to soil erosion vulnerability (Table 4).
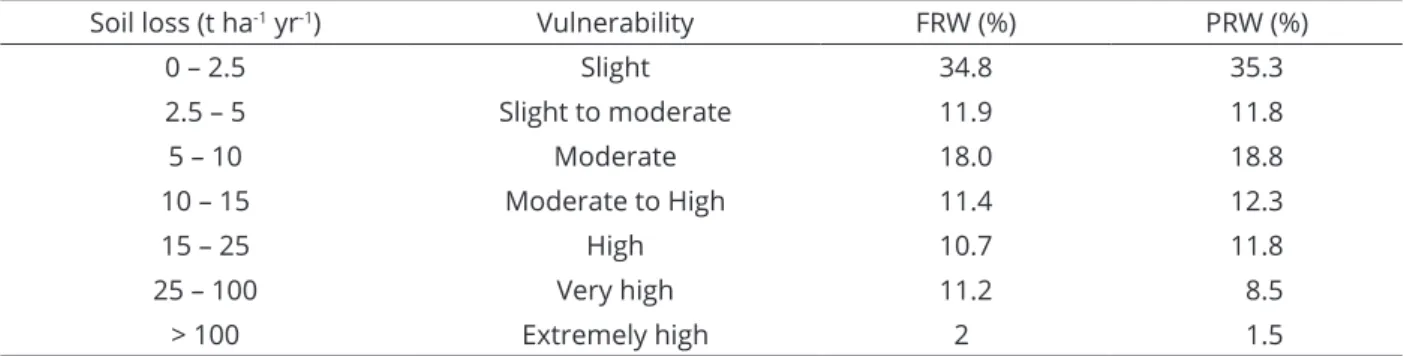
There is a predominance of slight soil erosion vulnerability in both watersheds (Table 4). Soil loss rates
less than 2.5 t ha-1 yr-1 are spatially distributed throughout the study area (Figure 5). However, there are concentration
areas in the PRW headwater where rock outcrop is found in the lowlands and in some areas covered by native
forests. The percentage area classified as slight soil erosion
vulnerability is followed by the moderate class in both
watersheds (Table 4).
On analyzing Table 4, one can infer that a large part of FRW and PRW (~ 47%) is estimated to have an
average annual soil loss of less than 5 t ha−1 yr−1, which may be considered as low erosion levels (Pandey; Chowdary; Mal, 2007). Several factors might have
caused low erosion rates in most of the study area. These
low soil erosion rates can be partially attributed to the low C values (Beskow et al., 2009) in both watersheds,
which were experienced in areas under cultivated pasture,
silviculture and native forests.
Soil losses between 5 and 11 t ha−1 yr−1 may limit agricultural productivity (Abdo; Salloum, 2017a), thus requiring awareness for those areas with moderate, high
or extremely high soil loss vulnerability. These researchers
Table 4: Soil erosion vulnerability according to categories suggested by Beskow et al. (2009), as well as the percentage of the area occupied by each class.
Soil loss (t ha-1 yr-1) Vulnerability FRW (%) PRW (%)
0 – 2.5 Slight 34.8 35.3
2.5 – 5 Slight to moderate 11.9 11.8
5 – 10 Moderate 18.0 18.8
10 – 15 Moderate to High 11.4 12.3
15 – 25 High 10.7 11.8
25 – 100 Very high 11.2 8.5
> 100 Extremely high 2 1.5
Overall, the soil loss vulnerability in the study area
can be associated with the LS factor. This study made it possible to observe that: i) high soil erosion vulnerability
occurs in the Planosols whenever it is associated with annual cropping; ii) very high vulnerability coincides
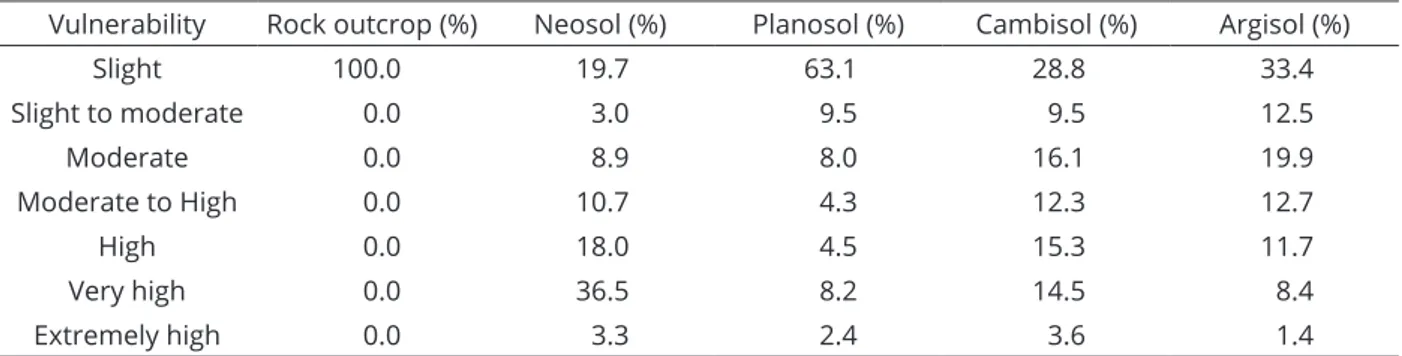
with high LS values even when land cover is native forest; and iii) extremely high vulnerability is associated with annual cropping as well as high LS values. In addition, soil class may have also influenced high values of soil loss (Table 5).
As presented in Table 5, Neosols have the largest
percentage of high and very high soil loss vulnerability. According to Figure 2 this soil class is mostly found in the headwaters of both watersheds which correspond
to areas of high R and LS factors. On the other hand,
Planosols, which are found for the lowest altitude areas
of FRW, are the least vulnerable with more than 63% of its area being classified as slight vulnerability despite the
fact that most of its area is covered by annual cropping
and cultivated pasture (Figure 3). Argisol and Cambisols
present similar results, with Cambisols found in the high altitude areas of PRW (Figure 1, 2), being more vulnerable than the former.
The results presented in Figure 5, Table 4 and Table 5 stand out as an important tool for water resources
and soil erosion managers in the region, as well as policy
makers, allowing not only the identification of vulnerable
areas but also the spatially distributed estimated amounts of annual soil loss in FRW and PRW. Simulations considering different erosion control practices (P) and land cover (C) may also aid decision-makers on building future scenarios in order to determine the most
suitable management practices. In this context, the use of Universal Soil Loss family equations gains even more
importance in developing countries due to the scarcity in soil loss data or even reliable input data for physically-based soil erosion models (Beskow et al., 2009; Ozcan et al., 2008).
Despite the importance of such approach, some limitations must be highlighted. As a parametric equation, uncertainties in the input values play an important role in the final soil loss. Parameters K
and C, for example, are derived from studies that
may not be the most adequate to the study area, since they were estimated for other regions of Brazil. In addition, factor C was derived from satellite imagery
classification, which by itself contains intrinsic errors
and generalizations. On the other hand, the factors R and
LS were derived from equations instead of published values. However, due to their spatial dependence, in
terms of latitude, longitude, altitude, and slope, there might be a considerable amount error propagation not only by the equations but also by the DEM used in the present study.
Table 5: Soil erosion vulnerability for each soil class.
Vulnerability Rock outcrop (%) Neosol (%) Planosol (%) Cambisol (%) Argisol (%)
Slight 100.0 19.7 63.1 28.8 33.4
Slight to moderate 0.0 3.0 9.5 9.5 12.5
Moderate 0.0 8.9 8.0 16.1 19.9
Moderate to High 0.0 10.7 4.3 12.3 12.7
High 0.0 18.0 4.5 15.3 11.7
Very high 0.0 36.5 8.2 14.5 8.4
CONCLUSIONS
The study proposes that the use of GIS and RUSLE constitute an effective approach for estimating
the magnitude and spatial distribution of soil erosion rates in Southern Brazil. Soil loss was estimated to the entire study area, ranging from 0 to more than 100 t ha-1 yr-1. The most susceptible areas were found in areas with the greatest LS values, therefore reinforcing
the need of conservation practices in order to promote sustainable agricultural practices in such steep terrains.
The results found in this study stand out as one of the
pioneer studies of its nature for the FRW and PRW, thus playing an important role for the regional soil and water resources management. Future studies should focus on
direct field measurements of soil loss in the Fragata and
Pelotas river watershed to validate the results estimated
according to the RUSLE.
REFERENCES
ABDO, H.; SALLOUM, J. Spatial assessment of soil erosion in Alqerdaha basin (Syria). Modeling Earth Systems and Environment, 3(26):7, 2017a.
ABDO, H.; SALLOUM, J. Mapping the soil in Marqya basin: Syria using RUSLE model in GIS and RS techniques. Environmental Earth Sciences, 76(3):114, 2017b.
ARAÚJO, F.; SALVIANO, A.; NETO, M. Estimativa da erodibilidade de latossolos do Piauí. Scientia Plena, 7(10):6, 2011.
BAGHERZADEH, A. Estimation of soil losses by USLE model using GIS at Mashhad plain, Northeast of Iran. Arabian Journal of Geosciences, 7(1):211-220, 2014.
BERA, A. Assessment of soil loss by universal soil loss equation (USLE) model using GIS techniques: A case study of Gumti River Basin, Tripura, India. Modeling Earth Systems and Environment, 3(1):29, 2017.
BESKOW, S. et al. Soil erosion prediction in the Grande River Basin, Brazil using distributed modeling. Catena, 79(1):49-59, 2009.
BISWAS, S.; PANI, P. Estimation of soil erosion using RUSLE and GIS techniques: A case study of Barakar River basin, Jharkhand, India. Modeling Earth Systems and Environment, 1(4):42, 2015.
CARVALHO, N. O. Hidrossedimentologia Prática. Editora Interciência, 2008. v.2, 599p.
CENTRO UNIVERSITÁRIO DE ESTUDOS E PESQUISAS SOBRE DESASTRES (CEPED). Atlas brasileiro de desastres
naturais 1991 a 2012: Volume Rio Grande do Sul. CEPED-UFSC, 2013. 185p.
CHEN, S.; ZHA, X. Evaluation of soil erosion vulnerability in the Zhuxi watershed, Fujian Province, China. Natural Hazards, 82(3):1586-1607, 2016.
CUNHA, N. G.; SILVEIRA, R. J. C.; SEVERO, C. R. C. Solos e terras do planalto Sul-Rio-Grandense e planícies costeiras. Pelotas: Embrapa Clima Temperado, 2006. 42p. (Embrapa Clima Temperado. Circular técnica, 55).
DURÃES, M. F.; COELHO FILHO, J. A. P.; OLIVEIRA, V. A. D. Water erosion vulnerability and sediment delivery rate in upper Iguaçu river basin–Paraná. Revista Brasileira de Recursos Hídricos, 21(4):728-741, 2016.
FAKHRI, M. et al. Flow and sediment transport modeling in rivers. ESLAMIAN, S. Handbook of Engineering Hydrology. CRC press, v.2, 2014. p.233-275.
FARINASSO, M. et al. Avaliação qualitativa do potencial de erosão laminar em grandes áreas por meio da EUPS utilizando novas metodologias em sig para os cálculos dos seus fatores na região do Alto Parnaíba-Pi-MA. Revista Brasileira de Geomorfologia, 7(2):73-85, 2006.
GANASRI, B. P.; RAMESH, H. Assessment of soil erosion by RUSLE model using remote sensing and GIS – A case study of Nethravathi Basin. Geoscience Frontiers, 7(6):953-961, 2016.
JIANG, L. et al. Estimation of soil erosion in some sections of Lower Jinsha River based on RUSLE. Natural Hazards, 76(3):1831-1847, 2015.
KISAN, M. V. et al. Remote sensing and GIS based assessment of soil erosion and soil loss risk around hill top surface mines situated in Saranda Forest, Jharkhand. Journal of Water and Climate Change, 9(2):68-82, 2016.
MARKOSE, V. J.; JAYAPPA, K. S. Soil loss estimation and prioritization of sub-watershed of Kali River basin, Karnataka, India, using RUSLE and GIS. Environmental Monitoring and Assessment, 188(4):225-241, 2016.
MARQUES, J. J. et al. Adequação de métodos indiretos para estimativa da erodibilidade de solos com horizonte B textural no Brasil. Revista Brasileira de Ciência do Solo, 21(3):447-456, 1997.
MELLO, C. R. et al. Erosividade mensal e anual da chuva no Estado de Minas Gerais. Pesquisa Agropecuária Brasileira, 42(4):537-545, 2007.
NAPOLI, M. et al. Simulation of field-measured soil loss in
Mediterranean hilly areas (Chianti, Italy) with RUSLE. Catena, 145:246-256, 2016.
NAQVI, H. R. et al. Multi-temporal anual soil loss risk mapping employing Revised Universal Soil Loss Equation (RUSLE) model in Nun Nadi Watershedm Uttrakhand (India). Arabian Journal of Geosciences, 6(40):4045-4056, 2013.
OLIVEIRA, P. T. S.; WENDLAND, E.; NEARING, M. A. Rainfall erosion in Brazil: A review. Catena, 100:139-147, 2012.
OLIVEIRA, V. et al. Soil erosion vulnerability in the Verde river basin, southern Minas Gerais. Ciência e Agrotecnologia, 38(3):262-269, 2014.
OZSOY, G. et al. Determination of soil erosion risk in the Mustafakemalpasa river basin, Turkey, using the revised universal soil loss equation, geographic information system, and remote sensing. Environmental Management, 50(4):679-694, 2012.
OZCAN, A. U. et al. Use of USLE/GIS technology integrated with
geostatistics to assess soil erosion risk in different land uses
of Indagi Mountain Pass – Çankırı, Turkey. Environmental Geology, 53(8):1731-1741, 2008.
PAN, J.; WEN, Y. Estimation of soil erosion using RUSLE in Caijiamiao watershed, China. Natural Hazards, 71(3):2187-2205, 2014.
PANAGOS, P. et al. Estimating the soil erosion cover-management factor at the European scale. Land Use Policy, 48:38-50, 2015.
PANDEY, A.; CHOWDARY, V. M.; MAL, B. C. Identification of critical erosion prone areas in the small agricultural watershed using USLE, GIS and remote sensing. Water Resources Management, 21(4):729-746, 2007.
PEROVIĆ, V. et al. Spatial modeling of soil erosion potential
in a mountainous watershed of South-eastern Serbia. Environmental Earth Sciences, 68(1):115-128, 2013.
RENARD, K. G. et al. Predicting Soil Erosion by Water: A guide to conservation planning with the Revised Universal Soil Loss Equation (RUSLE). U.S. Department of Agriculture, Agriculture Handbook No. 703, 1997, 404p.
RENARD, K. G.; FREIMUND, J. R. Using monthly precipitation data to estimate the R-factor in the revised USLE. Journal of Hydrology, 157(1-4):287-306, 1994.
RENARD, K. G. et al. RUSLE - Revised universal soil loss equation. Journal of Soil and Water Conservation, 46(1):30-33, 1991.
SÁ, M. A. C. et al. Estimativa da erodibilidade pela desagregação por ultra-som e atributos de solos com horizonte B textural. Pesquisa Agropecuária Brasileira, 39(7):691-699, 2004.
SAYGIN, S. D. et al. The combined RUSLE/SDR approach integrated with GIS and geostatistics to estimate annual
sediment flux rates in the semi-arid catchment, Turkey.
Environmental Earth Sciences, 71(4):1605-1618, 2014.
SILVA, R. M.; MONTENEGRO, S. M. G. L.; SANTOS, C. A. G. Integration of GIS and remote sensing for estimation of soil loss and prioritization of critical sub-catchments: A case study of Tapacurá catchment. Natural Hazards, 62(3)953-970, 2012.
SILVA, R. M.; PAIVA, F. M.; SANTOS, C. A. Análise do grau de erodiblidade e perdas de solo na bacia do Rio Capiá baseado em SIG e sensoriamento remoto. Revista
Brasileira de Geografia Física, 2(1):26-40, 2009.
TOMAZONI, J. C. et al. A sistematização dos fatores da EUPS
em SIG para quantificação da erosão laminar na bacia do
rio Anta Gorda (PR). Revista Eletrônica de Geografia, 3(1):01-21, 2005.
XU, L.; XU, X.; MENG, X. Risk assessment of soil erosion in
different rainfall scenarios by RUSLE model coupled with Information Diffusion Model: A case study of Bohai Rim,
China. Catena, 100:74-82, 2012.
WILLIAMS, J. R.; BERNDT, H. D. Sediment yield prediction based on watersehd hydrology. Transactions of the American Society of Agricultural and Biological Engineers, 20(6):1100-1104, 1977.
WISCHMEIER, W. H.; SMITH, D. D. Predicting rainfall erosion losses from cropland east of the Rocky Mountain. Washington, DC: ARS/USDA, 1965. 49p.