Tânia Isabel da Silva Carvalho
Mestre em Biotecnologia
Development of Ion Jelly thin films for
electrochemical devices
Dissertação para obtenção do Grau de Doutor em Química Sustentável
Orientador: Prof. Doutora Susana Barreiros, Professora Associada com
Agregação da Faculdade de Ciência e Tecnologia da Universidade Nova de
Lisboa
Co-orientador: Prof. Doutora Madalena Dionísio, Professora Auxiliar da
Faculdade de Ciência e Tecnologia da Universidade Nova de Lisboa
Co-orientador: Doutor Pedro Vidinha, Investigador Convidado do
REQUIMTE, Faculdade de Ciência e Tecnologia da Universidade Nova de
Lisboa
Júri:
Presidente: Prof. Doutora Maria Paula Pires dos Santos Diogo Arguentes: Prof. Doutor Joaquim José de Azevedo Moura Ramos
Doutor Pedro Miguel Pimenta Góis
Vogais: Prof. Doutora Maria Gabriela Machado de Almeida
Tânia Isabel da Silva Carvalho
Mestre em BiotecnologiaDevelopment of Ion Jelly thin films for electrochemical
devices
Orientador: Prof. Doutora Susana Barreiros, Professora Associada com Agregação
da Faculdade de Ciência e Tecnologia da Universidade Nova de Lisboa
Co-orientador: Prof. Doutora Madalena Dionísio, Professora Auxiliar da Faculdade
de Ciência e Tecnologia da Universidade Nova de Lisboa
Co-orientador: Doutor Pedro Vidinha, Investigador Convidado do REQUIMTE,
Faculdade de Ciência e Tecnologia da Universidade Nova de Lisboa
Júri:
Presidente: Prof. Doutora Maria Paula Pires dos Santos Diogo Arguentes: Prof. Doutor Joaquim José de Azevedo Moura Ramos
Doutor Pedro Miguel Pimenta Góis
Vogais: Prof. Doutora Maria Gabriela Machado de Almeida
“O homem bom tira coisas boas
do bom tesouro que está em seu coração, e o homem mau tira coisas más do mal que está em seu coração, porque a sua boca
fala do que está cheio o coração.”
D
EVELOPMENT OFI
ONJ
ELLY THIN FILMS FOR ELECTROCHEMICAL DEVICES“Copyright”
Tânia Isabel da Silva Carvalho Faculdade de Ciências e Tecnologia Universidade Nova de Lisboa
ACKNOWLEGEMENTS
Depois de tantas vezes a pensar que está quase…só falta mais uma coisinha…agora é que é! Com os agradecimentos termino o último “capítulo” desta tese. Apesar de no papel estar apenas o meu nome enquanto autora, muitos outros nomes teriam que ser acrescentados. Aqui vão alguns deles.
Agradeço à Professora Madalena Dionísio por todo o carinho, disponibilidade, a paciência em me explicar algo que era tão novo para mim. Foi um privilégio trabalhar consigo e espero continuar a fazê-lo por mais alguns anos. Foi muito mais do que orientadora, todas as páginas desta tese não seriam suficientes para lhe agradecer! Aprendi muito consigo, quer a nível profissional, quer a nível pessoal. Esta tese nunca teria sido possível sem a professora.
Á Professora Susana Barreiros por me acolher no seu laboratório por todos estes anos, que vêm desde o tempo da licenciatura! Muito obrigada por me ter permitido continuar um trabalho que me satisfaz muito.
Ao Pedro Vidinha, que me motivou e iniciou no mundo maravilhoso da investigação. Quando comecei há alguns anos atrás, a minha ideia era apenas fazer a licenciatura. No entanto, comecei por ouvir um convite para um mestrado, e depois um: “Tânia vais concorrer para doutoramento!”. Obrigada por tudo o que me ensinaste e partilhamos. Foi também muito importante para mim o teu apoio durante todo o tempo da doença do meu pai. Obrigada pela amizade, carinho e compreensão.
Á minha querida Natália Correia. És uma fonte de inspiração para mim. Espero vir a chegar, pelo menos, a metade do teu nível de conhecimento. Obrigada pelo teu apoio, por tudo quanto me ensinaste. Mesmo estando em Lille, estiveste sempre por perto e todo este trabalho tem a tua muito preciosa ajuda.
Ao professor Eurico, pelas preciosas contribuições na análise das amostras por NMR. Ao professor Carlos Dias, por toda a ajuda nos fittings das permitividades.
Ao professor Jonas Gruber. Muito obrigada por tudo professor. Enquanto estive no Brasil fui muito bem recebida, senti-me da família! Obrigada pela disponibilidade, tanto em trabalhar no seu laboratório, como para irmos ao sushi obrigada também pelo convite a participar no congresso em Santa Bárbara.
Aos amigos e colegas da USP, Bruna, Boza, Juliana e Elaine.
À Ana Rita Brás. Obrigada querida Rita pois todo este mundo da relaxação dieléctrica começou contigo. Obrigada por toda a paciência e disponibilidade, mesmo quando estavas a escrever a tua tese.
Ao Alexandre Paiva. Não posso ser muito lamechas porque isto vai ficar escrito e depois não tenho como negar! E isto dos agradecimentos tem que acabar, desde a tese de mestrado que te ando a agradecer! Obrigada por tudo foste e és um enorme apoio para mim. Agora vem trabalhar, já estiveste muito tempo de férias e não bebo café há mais de 2 semanas porque estou à tua espera para irmos para baixo!!
imaginários, mais os ILs…..obrigada pelo teu esforço e paciência.
Ao Ângelo Rocha e ao Nuno Lourenço pela síntese dos líquidos iónicos! Sem eles esta tese teria ficado muito mais pobre.
À minha Dianinha, tudo o que partilhamos foi muito bom, desde os tempos de laboratório, aos tempos do Cambrigde e as skype sessions
À Gabriela que atravessou o Atlântico para vir conhecer o incrível mundo do DRS/DSC! Muito obrigada pelo teu trabalho, o capítulo 5 desta tese é inteirinho dedicado a ti.
À minha mana, não de sangue mas de coração, Ana Pina. Estás sempre presente na minha vida e, claro está, também tinhas que ter estado ao meu lado nesta corrida contra o tempo!! Muito obrigada!!!! Mas só aceitei a tua ajuda porque já não fazias noitadas há muito tempo!
Á D. Idalina e à D. Conceição, por todo o carinho e disponibilidade. Quantas vezes andámos a pedir coisas….muito obrigada!
À minha mãe, que esteve sempre ao meu lado, apoiando-me, acarinhando-me. Esta tese reflecte muito do teu trabalho e do teu amor na minha vida. E não foi nada pouco…és a melhor mãe do mundo. Amo-te muito.
Á minha mana, cujos testes psicotécnicos lhe deram Química Aplicada!!! Tu não te metas nisto!
muito obrigada pelo teu carinho, amizade, cumplicidade…amo-te muito!
Ao António, és muito mais do que um namorado. Tens sido o meu braço direito… e o esquerdo…obrigada por toda a tua paciência, pelo teu amor, pelo teu apoio. És uma bênção maravilhosa de Deus para mim. Amo-te muito!
ABSTRACT
Ionic liquids (ILs) are promising materials which have been used in a wide range of applications. However, their major limitation is their physical state. In order to address this challenge, a self-supported IL-based material was developed by combining gelatine with an IL, originating a quasi-solid material named Ion Jelly (IJ). This is a light flexible material, dimensionally stable, with promising properties to develop safe and highly conductive electrolytes. This thesis is focused on the characterization of IJ films based on different ILs. The conductive mechanisms of IJ materials were studied using dielectric relaxation spectroscopy (DRS) in the frequency range 10-1−106
Hz. The study was complemented by differential scanning calorimetry (DSC) and pulsed field gradient nuclear magnetic resonance (PFG NMR) spectroscopy.
A glass transition was detected by DSC for all materials allowing to classify them as glass formers. From dielectric measurements, transport properties such as mobility and diffusion coefficients were extracted. Moreover, it was found that the diffusion coefficients and mobility are similar for the IL and IJ, especially for the IL EMIMDCA.
Since for BMIMDCA, those properties significantly change upon hydration, the influence of water content [0.4 - 30% (w/w)] was also studied for the ILs. In particular for BMPyrDCA with 30% water, it was analyzed the reorientational polarization by the complex permittivity and electric modulus, from which three different processes were identified: a secondary relaxation with Arrhenian temperature dependence, the process that is believed to be behind the dynamic glass transition and the mobility of charge carriers.
An application of the IJs was successfully explored with a chemoresistive gas sensor made up by different IJs as active layer, which is an electronic nose formed by an array of such sensors. The performance of this e-nose revealed its ability to correctly detect eight common volatile solvents.
RESUMO
Os líquidos iónicos (LIs) são materiais promissores utilizados numa vasta gama de aplicações. No entanto, a sua maior limitação é o seu estado físico. A fim de enfrentar este desafio, foi desenvolvido um novo material baseado em LIs, o qual resultou da combinação de gelatina com um LI, originando um material quase sólido denominado Ion Jelly (IJ). Este é um dispositivo flexível, leve, dimensionalmente estável com propriedades promissores para desenvolver electrólitos seguros e condutores. Esta tese está focada na caracterização de IJs baseados em diferentes LIs. Para a caracterização dos IJs foi utilizada espectroscopia de relaxação dieléctrica (ERD) na gama de frequências 10-1-106 Hz. O estudo foi complementado por calorimetria de varrimento diferencial (CVD)
e gradiente de espectroscopia de ressonância nuclear magnética de campo pulsado (GE RMN). Por CVD detectou-se uma transição vítrea para todos os materiais, o que permite classificá-los como materiais formadores de vidro. Das medidas dieléctricas, foram obtidas propriedades de transporte como a mobilidade e coeficientes de difusão. Para além disso, verificou-se que os coeficientes de difusão e mobilidade são semelhantes para o LI e IJ, especialmente para o LI EMIMDCA.
Uma vez que para o LI BMIMDCA essas propriedades alteraram significativamente após hidratação, a influência do teor em água [0.4-30% (w / w)] do LI foi também estudada. Em particular, para o LI BMPyrDCA com 30% de água, foi analisada a polarização de reorientação pela permitividade e módulo eléctrico, a partir do qual são identificados três processos diferentes: relaxamento com dependência Arrheniana da temperatura, o processo que acreditamos estar envolvido na origem da transição vítrea e a mobilidade dos portadores de carga.
O IJ foi aplicado com sucesso num sensor de gases quimioresistivo, um nariz electrónico, composto por um conjunto de diferentes IJs que actuam como sensores. O desempenho deste nariz electrónico revelou grande capacidade para detectar correctamente oito solventes voláteis comuns.
Table of Contents
1. INTRODUCTION ...3
1.1. Electrochemical Devices ...3
1.1.1. ILs ...4
1.1.2. IJ ...8
1.2. Polarization and Dielectric Relaxation Spectroscopy (DRS) ... 11
1.2.1. Polarization Mechanisms ... 11
1.2.2. Dielectric Spectroscopy ... 14
1.2.3. Theoretical Principles of Dielectric Relaxation ... 15
1.2.4. Debye Behaviour ... 16
1.2.5. Transport Properties ... 19
1.3. Differential Scanning Calorimetry ... 22
1.4. Bibliography ... 24
2. EXPERIMENTAL SECTION ... 35
2.1 Materials ... 35
2.2. Ion Jelly preparation ... 35
2.3. Techniques ... 35
2.3.1. Karl Fischer titration... 35
2.3.2 Van der Waals radii ... 37
2.3.3 Dielectric Relaxation Spectroscopy ... 37
2.3.3.1 Impedance Analyzers...39
2.3.3.2 Alpha High Resolution Impedance Analyzer and Temperature Control...40
2.3.4 Differential Scanning Calorimetry ... 42
2.3.5. Nuclear Magnetic Resonance ... 44
2.3.6. Electronic Nose ... 44
2.4. Bibliography ... 46
3. UNDERSTANDING THE ION JELLY CONDUCTIVITY MECHANISM ... 49
3.1. Thermal Characterization ... 49
3.2. Dielectric Characterization ... 51
3.2.1. Conductivity ... 51
3.4. Bibliography ... 66
4. IMPROVING AND UNDERSTANDING IJ CONDUCTIVE PROPERTIES USING DCA BASED ILS 73 4.1. Thermal Characterization ... 73
4.2. Dielectric Characterization ... 79
4.2.1. Conductivity ... 79
4.2.1.1 BMIMDCA and BPyDCA...79
4.2.1.2 1-Buthyl-1-Methyl Pyrrolidinium Dicyanamide (BMPyrDCA)...83
4.2.1.3 EMIMDCA...86
4.3. Fragility... 102
4.4. Bibliography ... 105
5. UNDERSTANDING THE IMPACT OF WATER ON THE GLASS TRANSITION TEMPERATURE AND TRANSPORT PROPERTIES OF IONIC LIQUIDS ... 113
5.1. EMIMDCA ... 114
5.1.1. Thermal Characterization ... 114
5.1.2. Dielectric Relaxation Spectroscopy Characterization ... 119
5.1.2.1 Conductivity...119
5.1.2.2 Transport properties...122
5.2. BMPyrDCA ... 124
5.2.1. Thermal Characterization ... 124
5.2.2. DRS Characterization ... 125
5.2.2.1 Conductivity...125
5.2.2.2 Transport properties...131
5.3. Conclusion... 134
5.4. Bibliography ... 135
6. ELECTRONIC NOSE (E-NOSE) BASED ON ION JELLY MATERIALS ... 141
6.1 Introduction... 141
6.2. Results and Discussion ... 145
6.3 Conclusion ... 149
6.4. Bibliography ... 150
FIGURES INDEX
CHAPTER 1:INTRODUCTION
Figure 1.1 – Ionic liquid structures: 1-butyl-3-methyl imidazolium dicyanamide (BMIMDCA), 1-ethyl-3-methyl imidazolium dicyanamide (EMIMDCA), 1-butyl-1-1-ethyl-3-methyl pyrrolidinium dicyanamide
(BMPyrDCA) and 1-butyl pyridinium dicyanamide (BPyDCA)……… 10
Figure 1.2 – (a) - Electro Magnetic Spectrum; (b) – Time domain dielectric spectroscopy (adapted from: http://www.colourtherapyhealing.com/colour/electromagnetic_spectrum.php; Y. Feldman, “The Physics of dielectrics”, lecture 1, in http://aph.huji.ac.il/courses/2008_9/83887/index.html, accessed in March 2013)... 12
Figure 1.3 - A dielectric permittivity spectrum over a wide range of frequencies. ε′ and ε″ denote the real and the imaginary part of the permittivity, respectively. Various processes are labelled on the image: ionic and dipolar relaxation, and atomic and electronic resonances at higher energies (Redrawn from reference [51])……….. 13
Figure 1.4 – Debye single relaxation time model for dipole orientation showing a (a) frequency dependence of the real, ε', and imaginary, ε^'', permittivities and (b) Imaginary part vs. real part of permittivity, ε*... 17
Figure 1.5 – Illustrative representation of frequency dependence of real conductivity at 193 K for IJ3……….. 20
Figure 1.6 – A schematic DSC curve showing the crystallization temperature (Tc), the melting temperature (Tm) and the glass transition temperature (Tg) at the onset (Tg, on), midpoint (Tg, mid) and endset (Tg, end)... 23
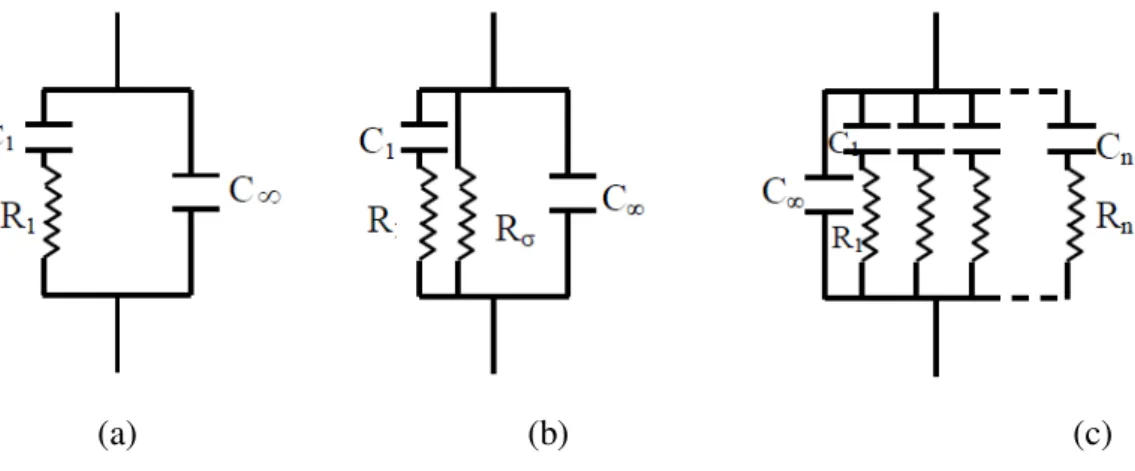
CHAPTER 2:EXPERIMENTAL SECTION Figure 2.1– Circuit diagrams for a material exhibiting: (a) a relaxation process with a single relaxation time and induced polarization, (b) a relaxation process with a single relaxation time, conduction and induced polarization and (c) a distribution of relaxation times and induced polarization (reproduced from reference[4]………. 39
Figure 2.2– Principle of the impedance measurement (reproduced from reference [5])………... 40
Figure 2.3 – Temperature control device and its connection to the sample cell (reproduced from reference [5])………... 41
Figure 2.4 –DSC apparatus………. 43
Figure 2.5 – Ion Jelly gas sensor………. 44
Figure 3.1 - DSC scans obtained in heating mode at 20 K.min-1 for BMIMDCA
1.9%water,
BMIMDCA6.6%water and both IJ showing the heat flow jump at the glass transition; in the studied
temperature range no transitions are detected for gelatine. The inset shows the second heating scan for BMIMDCA6.6%water and IJ3, where cold crystallization and melt are observed for the IL and avoided
for the IJ (see text)……….. 49
Figure 3.2 – (a-g) - Complex conductivity measured at different temperatures of BMIMDCA1.9%water
and BMIMDCA6.6%water (in steps of 2 K from 163 K to 213 K) and Ion Jelly (in steps of 5 K starting at
163K (IJ3) and 188K (IJ1)): (a-d) real, ´, and (d-g) imaginary, ´´, components; the onset of the calorimetric Tg occurs at a temperature in between the isotherms represented in filled symbols
(indicated by the arrow). The insets display the respective real ´ (a-d) and imaginary ´´ (e-h) parts of the complex dielectric function………. 52
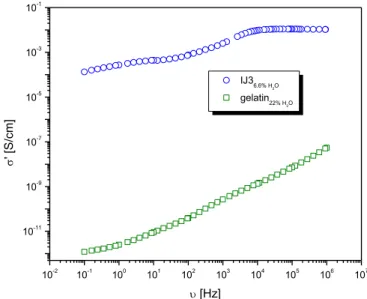
Figure 3.3. Frequency dependence of real conductivity at 298 K for IJ3 (which has 6.6% (w/w) water content) compared with a blank of a gelatine film with 22% (w/w) of water……….. 53
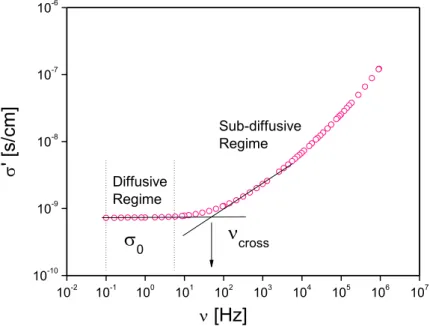
Figure 3.4 – Real part of conductivity for IJ3 from 178 to 233 K in steps of 5K. The solid lines are the obtained fits by the Jonscher law (eq. (2)). Data collected at 208 K are plotted in full circles being the same spectrum presented in the inset together with the respective derivative d(log’())/d(log()) (open circles); the continuous increase of the derivative value with the frequency increasing, confirms the sub-diffusive dynamics (see text)……….. 54
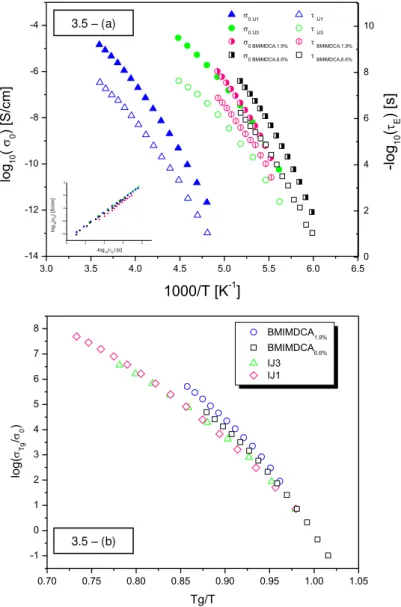
Figure 3.5 – (a).Temperature dependence of the dc conductivity, 0, and of the relaxation time, e,
taken from the crossover frequency. The correlation between both is displayed in the inset (BNN plot) for which a slope near 1 and a r2=0.99 was found: log(0)=(1.060.02)log(e) - (12,950,09). (b)
Temperature dependence of conductivity normalized for the value measured at the calorimetric glass transition temperature (Tg); the temperature axis is scaled to the glass transition temperature, Tg… 55
Figure 3.6 – (a-c) – Thermal activation plot for a) diffusion coefficients of BMIM (cation) and DCA (anion) (equations 1.20-a and 12.0-b), replacing the mean-square displacement by the vdW diameters, and b) mobilities,, (equation 1.15-b) by taking D=D++D- for the four materials. (c) Values
of the cation diffusion coefficients (D+) determined from PFG NMR and the VFT fit (solid lines); data
represented by stars for IJ3 were estimated also through equation 10a but using the BNN relationship to obtain the crossover frequency from σ0 (see text)……….... 59
Figure 3.7 - (a-d) Real permittivity spectra, ´, of BMIMDCA1.9%water, BMIMDCA6.6%water, and both IJs;
CHAPTER 4:IMPROVING AND UNDERSTANDING IJ CONDUCTIVE PROPERTIES USING DCA BASED ILS
Figure 4.1 (a) - DSC scans obtained in heating mode at 20 K.min−1 for BPyDCA
0.4%water,
BPyDCA9%water, and BPyDCAIJ showing the heat flow jump at the glass
transition………... 76
Figure 4.1 (b) - DSC scans obtained in heating mode at 20 K.min−1 for BMIMDCA0.4%water,
BMIMDCA9%water, and BMIMDCAIJ showing the heat flow jump at the glass transition. The inset shows
the second heating scan for BMIMDCA9%water and BMIMDCAIJ, where cold crystallization and melt are
observed for the IL and avoided for the IJ (see text)………. 76
Figure 4.1 (c) - DSC scans obtained in heating mode at 20 K.min−1 for BMPyrDCA
0.4%water,
BMPyrDCA9%water, and BMPyrDCAIJ showing the heat flow jump at the glass transition. The inset
shows the second heating scan for BMIPyrDCA9%water and BMPyrDCAIJ, where cold crystallization and
melt are observed for the IL and avoided for the IJ (see text)……….……… 77
Figure 4.1 (d) - DSC scans obtained in heating mode at 20 K.min−1 for BMPyrDCA
0.4%water,
BMIPyrDCA9%water, and BMPyrDCAIJ showing the heat flow jump at the glass transition. The inset
shows thesecond heating scan for BMIPyrDCA9%water and BMPyrDCAIJ, where cold crystallization and
melt are observed for the IL and avoided for the IJ (see text)………. 77
Figure 4.2 - Real (o) and imaginary (o) parts of the complex permittivity of BMIMDCA0.4%water, as a
function of the frequency at 175.15 K. Inset: The conductivity as a function of frequency. See text for
the meanings of the abbreviations………... 80
Figure 4.3 (a – f ) - Complex conductivity measured at different temperatures of: (a) BPyDCA0.4%water,
(b) BPyDCA9%water and (c) BPyDCAIon Jelly; (d) BMIMDCA0.4%water, (e) BMIMDCA9%water and (f),
BMIMDCA Ion Jelly (in steps of 2 K from 163 K to 103 K): (a-f) real, ´, components; the estimated onset
of the calorimetric Tg occurs at a temperature in between the isotherms represented in filled symbols
(indicated by the arrow).……… 82
Figure 4.4 – Correlation between the Tg extracted from DSC (in green) and predicted from DRS (in
blue), in which of the studied samples: 1-BPyDCA0.4%, 2-BPyDCA9%, 3-BPyDCAIJ; 4-BMIMDCA0.4%,
5-BMIMDCA9%, 6-BMIMDCAIJ; 7-BMPyrDCA0.4%, 8-BMPyrDCA9%, 9-BMPyrDCAIJ; 10-EMIMDCA0.4%,
11-EMIMDCA9%, 12-EMIMDCAIJ ….……… 83
Figure 4.5 - Imaginary part of the complex dielectric function for a relaxation process in BMPyrDCA0.4%... 84
Figure 4.6 - (a – c) - Complex conductivity measured at different temperatures of BMPyrDCA0.4%water,
BMPyrDCA9%water and BMPyrDCAIon Jelly (in steps of 2 K from 163 K to 103 K): (a-c) real, ´,
components; the estimated onset of the calorimetric Tg occurs at a temperature in between the
isotherms represented in filled symbols (indicated by the arrow)……… 85
Figure 4.7 - (a-c) - Complex conductivity measured at different temperatures of EMIMDCA0.4%water,
represented in filled symbols (indicated by the arrow).………... 86
Figure 4.8 (a-f) – Real part of conductivity for BPyDCA0.4%, BPyDCA9% and BPyDCAIJ from 189 to 213
K, 171 to 207K and 179 to 213K, respectively, in steps of 2K and for BMIMDCA0.4%, BMIMDCA9% and
BMIMDCAIJ from 171 to 203 K, 167 to 201K and 175 to 208K, respectively. The solid lines are the
obtained fits by the Jonscher law (eq. 1.14). Data collected at 211 K for BPyDCA0.4% , 197K for
BPyDCA9% , 201 K for BPyDCAIJ, 191 K for BMIMDCA0.4%, 189K for BMIMDCA9% and 198 K for
BMIMDCAIJ, are plotted in full circles being the same spectrum presented in the inset together with the
respective derivative d(log’())/d(log()) (open circles); the continuous increase of the derivative value with the frequency increasing, confirms the sub-diffusive dynamics (see text)……… 88
Figure 4.9 (a-f) – Real part of conductivity for BMPyrDCA0.4%, BMPyrDCA9% and BMPyrDCAIJ from 18
to 197 K, 163 to 199K and 169 to 209K, respectively, in steps of 2K and for EMIMDCA0.4%,
EMIMDCA9% and EMIMDCAIJ from 169 to 195 K, 161 to 283 K and 167 to 203K, respectively. The
solid lines are the obtained fits by the Jonscher law (eq. 1.14). Data collected at 187 K for BMPyrDCA0.4%, 185K for BMPyrDCA9% , 195 K for BMPyrDCAIJ, 189 K for EMIMDCA0.4%, 177K for
EMIMDCA9% and 193 K for EMIMDCAIJ, are plotted in full circles being the same spectrum presented
in the inset together with the respective derivative d(log’())/d(log()) (open circles); the continuous increase of the derivative value with the frequency increasing, confirms the sub-diffusive dynamics (see text)……….. 89
Figure 4.10 (a-d) - Temperature dependence of the dc conductivity, 0, and of the relaxation time, e,
taken from the crossover frequency. The correlation between both is displayed in the inset (BNN plot) for which a slope near 1 is found (the lowest correlation factor is r2=0.994)………. 92
Figure 4.11 – To and calorimetric Tg (figure 4.11 – (a)); conductivity and diffusion coefficient both at
room temperature, respectively rT and D rT, (figure 4.11 – (b)) versus van der Waals radii. ………… 93
Figure 4.12 – Dependence of the cohesion of salts of weakly polarisable cations and anions, assessed by the Tg value, on the ambient-temperature molar volume, Vm, and, hence, on the interionic spacing [(r+ +
r-) Vm1/3]. A broad minimum in the ionic liquid cohesive energy is seen at a molar volume of 250 cm3 mol-1, which corresponds to an interionic separation of ~0.6 nm, assuming a
face-centered cubic packing of anions about the cations. The lowest Tg value in the plot should
probably be excluded from consideration, because of the nonideal Walden behaviour for this IL (MOMNM2E+BF4-). The line through the points is a guide to the eye. (background figure retrieved from
ref [43])……….……… 95
Figure 4.13 - Normalized conductivity with pure conductivity in function of frequency.……... 96
Figure 4.14 - (a – d) - Mobilities,, (equation 4.3) by taking D=D++D- for the four ILs……… 98
EMIM (cation) and DCA (anion) (equations 4.4 – (a) and 4.4 – (b)), replacing the mean-square
displacement by the vdW diameters……… 99
Figure 4.16 - (a-d) - Values of the cation diffusion coefficients (D+) determined from PFG NMR and
the VFT fit (solid lines).………100
Figure 4.17 - (a-c) - Thermal activation plot for diffusion coefficients of BPy, BMIM, BMPyr and EMIM (cation) (equation 1.20-a) with 0.4% water content, b) with 9% water content and c) the IJ correspondent of each IL, replacing the mean-square displacement by the vdW diameters……….. 101
CHAPTER 5:UNDERSTANDING THE WATER IMPACT IN DIFFERENT IONIC LIQUIDS
Figure 5.1 - DSC thermograms obtained for EMIMDCA 9% showing the heat flow jump at the glass transition as well as the crystallization and melting phase transitions, from the fourth scan. The inset shows in more detail the evolution of the glass transition with sample dehydration. All the scans were obtained in successive sweeps with increasing final temperature.………. 115
Figure 5.2 – Plot of the glass transition temperatures for EMIMDCA9% for each cycle. The inset shows the two phase transformations, crystallization and melting. It was used a 20 K.min-1 rate scan……… 116
Figure 5.3- DSC scans obtained for EMIMDCA with 0.4%, 9%, 12% and 30% water content, showing the heat flow jump at the glass transition temperature during the first cycle. The curves were vertically shifted to allow a better comparison of both heat flux discontinuity in the glass transition region and endothermal water evaporation. The inset shows the second heating run in which crystallization and
melting are observed.……….. 117
Figure 5.4 - Real part of conductivity of EMIMDCA IL_0.4%. The solid lines are the fits obtained by the Jonscher law (eq 1.14), for isotherms in steps of 4K between 169 K and 189 K for EMIMDCA IL_0.4%. The isotherms for the highest temperatures were taken between 258K and 268 K in steps of 5 K; the isotherms between 201 K and 211 K in steps of 2 K, were included to illustrate the crystallization effect. The inset a) shows the isochronal plot of the conductivity at 4x10⁵ Hz, illustrating the effect of crystallization and melting. The inset b) displays the conductivity as a function of the
the data while the black circles represent the values directly extracted from the plateau; the lack of points in the intermediate temperature region is due to the occurrence of crystallization. The solid line is the VFTH fitting curve.……… 120
Figure 5.5 - Real part of complex conductivity (σ’) of EMIMDCA with 0.4%, 9%, 12% and 30% water contents versus frequency () (from 10-1
to 106 Hz) at -98ºC.………. 121
Figure 5.6 - Diffusion coefficient of EMIM (given as log D+) in EMIMDCA with 0.4%, 9%, 12% and
30% water content, as a function of inverse temperature... 122
Figure 5.8 – Real part of conductivity, at -74ºC, as a function of frequency using two different
electrode materials, keeping the same geometry.……… 123
Figure 5.9 - DSC thermograms normalized by mass obtained for BMPyrDCA with 0.4%, 9%, 12% and 30% water content showing the heat flow jump at the glass transition during the first cycle. The inset displays the thermograms collected during a second heating run, after water removal, showing that the glass transition of all systems remains invariant………. 124
Figure 5.10Real part of complex conductivity (σ’) of BMPyrDCA with 0.4%, 9%, 12% and 30% water content versus frequency () (from 10-1
to 106 Hz) measured at temperatures from -120ºC to
40ºC.……….. 126
Figure 5.11 Imaginary part of complex permittivity of BMPyrDCA with water content as a function as frequency () (from 10-1 to 106 Hz) for temperatures from -112ºC to -60 ºC. The -98 ºC and -86 ºC
isotherms are in solid circles to emphasize the dielectric loss peak.……….. 127
Figure 5.12 – Preferred orientation of water molecules towards (a) a cation with high surface-charge density, (b) a cation with low surface-charge density and (c) an anion. The arrow indicates the direction of the water dipole moment. (Retrieved from [8])………... 127
Figure 5.13 – 3-D Spectra of the imaginary part of the electric modulus spectra M’’ as a function of temperature and frequency for BMPyrDCA30% in the temperature range -110 ºC to -78 ºC.……….. 129
Figure 5.14 – Relaxation times, , as a function of inverse temperature obtained by DRS for different processes: □ – -relaxation obtained from M’’, ○ - -relaxation obtained from , ○ - - relaxation process and○ - the relaxation process that results from conductivity, through the M’’; solid
lines are the fitting by VFTH.……… 130
Figure 5.15 Real part of complex conductivity (σ’) of BMPyrDCA with 0.4%, 9% and 12% water content as a function of frequency () (from 10-1
to 106 Hz) at -104ºC. ………. 131
Figure 5.16 Diffusion coefficient of BMPyr (given as log D+) in BMPyrDCA with 0.4%, 9% and
12%water content as a function of inverse temperature.……….. 132
Figure 5.17 Mobility (given as log ) of BMPyrDCA with 0.4%, 9% and 12% water content as a
function of inverse temperature.……… 132
CHAPTER 6:ELECTRONIC NOSE (E-NOSE) BASED ON ION JELLY MATERIALS
Figure 6.1 – Types of sensors utilized in e-noses (adapted from [31])……….. 142
Figure 6.2 – Comparison of the mammalian olfactory system and the e-nose system (adapted from [33])……… 143
period and G2 is the conductance at the end of the exposure period………. 144
Figure 6.4 - Response of the sensors to a sequence of 15 exposures/recoveries. Exposure periods of 65 s to air saturated with methanol at 30º C and recovery periods of 65 s were employed. Sensor 1 – BMIMDCAIJ; sensor 2 - EMIMDCAIJ; sensor 3 - BMPyrDCAIJ and sensor 4 – BMIMBr……….. 146
Figure 6.5 –Typical structure of a conductive polymer composite sensor………146
Figure 6.6 –Relative response for sensor 1: BMIMDCAIJ……… 147
Figure 6.7 –Relative response for sensor 2: EMIMDCAIJ……… 147
Figure 6.8 –Relative response for sensor 3: BMPyrDCAIJ……….. 148
Figure 6.9 –Relative response for sensor 4: BMIMBrIJ……… 148
CHAPTER 1:INTRODUCTION
Table 1.1 - A selection of Electrical Conductivities of Liquids [18]... 5
Table 1.2 - A selection of Electrical Conductivities of Ionic Liquids [18]...5
Table 1.3 - The twelve principles of Green Chemistry (retrieved from [27])... 7
CHAPTER 2:EXPERIMENTAL SECTION
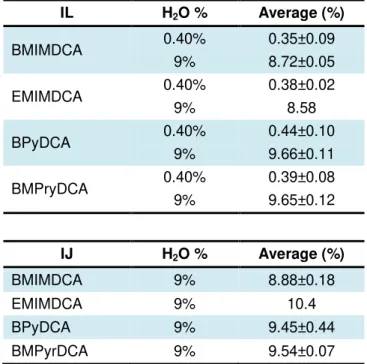
Table 2.1 –Water content on the neat IL, aqueous solutions and respective IJs (chapter 4)... 36
Table 2.2 –Water content on the neat IL and the aqueous solutions (chapter 5)... 36
Table 2.3 – Van de Waals radii and cation volumes for the ILs tested in the present work (chapters 4 and 5)... 37
CHAPTER 3:UNDERSTANDING THE ION JELLY CONDUCTIVITY MECHANISM
Table 3.1- Glass Transition Temperatures Taken at the Onset (on), Midpoint (mid) and Endset (end) of the Heat Flow Jump for both BMIMDCA and both Ion Jellies, Obtained during a First Heating Ramp at 20 K/min, and Heat Capacity Associated with the Glass Transition... 50
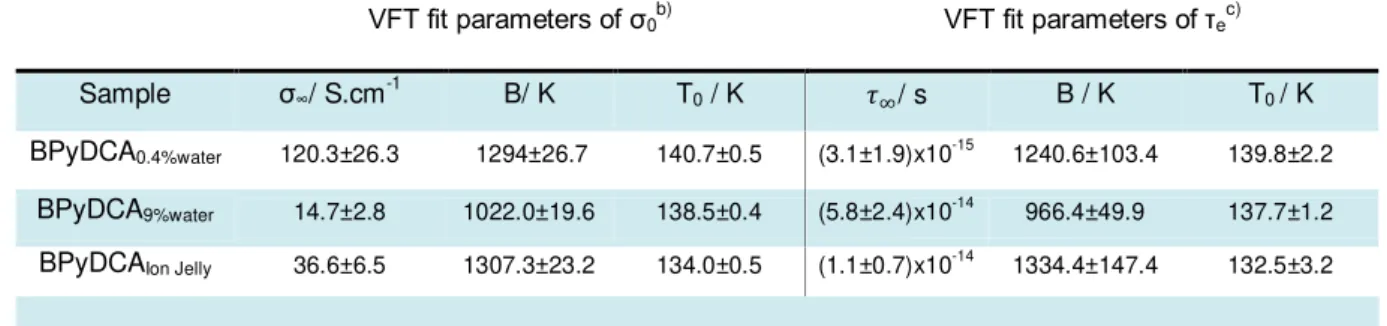
Table 3.2 - Fit Parameters Obtained According to the VFT Law for the Conductivity (eq. 3.1 – (b)) and the Relaxation Times (eq. 3.1 – (a))a
... 57
Table 3.3 – VFT parameters estimated for each process used in the HN fit to the ´ data... 63
CHAPTER 4:IMPROVING AND UNDERSTANDING IJ CONDUCTIVE PROPERTIES USING DCA BASED ILS
Table 4.1 - Glass Transition Temperatures Taken at the Onset (on), Midpoint (mid) and Endset (end) of the Heat Flow Jump for both BPyDCA, BMIMDCA, BMPyrDCA, EMIMDCA and respective IJ, obtained during a First Heating Run at 20 K/min; melting and crystallization temperatures obtained from a second heating run.………... 78
Table 4.2 - Fit Parameters Obtained According to the VFT Law for the Relaxation Times (eq. 4.1) and the Conductivity (eq. 4.2)a)………... 91
Table 4.3 –Fragilities of the twelve samples, according to Eq. 4.5………... 104
CHAPTER 5:UNDERSTANDING THE WATER IMPACT IN DIFFERENT IONIC LIQUIDS
of the Heat Flow Jump for EMIMDCA9%, obtained during a First Heating Run at 20 K/min; melting and
crystallization temperatures obtained from the fourth heating run... 116
Table 5.2 - Glass transition temperatures taken at the onset (on), midpoint (mid) and endset (end) of the heat flow jump for EMIMDCA0.4%, EMIMDCA9%, EMIMDCA12% and EMIMDCA30% obtained during
a first and a second heating run at 20 K/min; melting and crystallization temperatures obtained from the minimum and maximum of the peak, respectively... 118
Table 5.3 – Temperature range covered in the DRS measurements and temperature domain where electrical anomalies were registered for EMIMDCA with different water contents... 119
Table 5.4 - Glass transition temperatures taken at the onset (on), midpoint (mid) and endset (end) of the heat flow jump for BMPyrDCA0.4%, BMPyrDCA9%, BMPyrDCA12% and BMPyrDCA30% obtained
during a first and second heating run at 20 K/min; melting and crystallization temperatures were not observed... 125
Table 5.5 – Summary of the VFTH parameters for the detected processes in the ´´ and M´´ representations... 131
Table 5.6 - Glass transition temperatures taken at the onset (on), midpoint (mid) and endset (end) of the heat flow jump for BMIMDCA0.4%, BMIMDCA9%, BMIMDCA12% and BMIMDCA30% obtained during a first and second heating run at 20 K/min; melting and crystallization temperatures obtained from the minimum/maximum of the respectively peak...133
Table 5.7 - Glass transition temperatures taken at the onset (on), midpoint (mid) and endset (end) of the heat flow jump for EMIMEtSO4_0.4%, EMIMEtSO4_9%, EMIMEtSO4_12% and EMIMEtSO4_30%
obtained during a first and second heating run at 20 K/min; melting or crystallization temperatures were not observed... 133
CHAPTER 6:ELECTRONIC NOSE (E-NOSE) BASED ON ION JELLY MATERIALS
CHAPTER 4: IMPROVING AND UNDERSTANDING IJ CONDUCTIVE PROPERTIES USING DCA BASED ILS
Scheme 4.1- ILs cations structures and respective van-der-Walls ratios... 94
CHAPTER 5:UNDERSTANDING THE WATER IMPACT IN DIFFERENT IONIC LIQUIDS
BDS: Broadband dielectric spectroscopy
BMIMBr: 1-butyl-3-methyl imidazolium bromide
BMIMDCA : 1-butyl-3-methyl imidazolium dicyanamide
BMIMDCA1.9%water : 1-butyl-3-methyl imidazolium dicyanamide with 1.9% water amount
BMIMDCA6.6%water: 1-butyl-3-methyl imidazolium dicyanamide with 6.6% water amount
BMPyrDCA: 1-butyl-1-Methyl Pyrrolidinium Dicyanamide
BNN: Barton–Nakajima–Namikawa
BPyDCA: 1-buthyl pyridinium dicyanamide
BPyrDCA: 1-buthyl pyrrolidinium dicyanamide
CCP: Composite Conductive Polymers
CA: Cluster Analysis
DCA: Dicyanamide
DFA: Discriminant Function Analysis
DFT: Density Functional Theory
DRS: Dielectric Relaxation Spectroscopy
DSC: Differential Scanning Calorimetry
EMIMDCA: 1-ethyl-3-methyl imidazolium dicyanamide
EMIMEtSO4: 1-ethyl-3-methyl imidazolium ethylsulfate
E-nose: Electronic nose
EP: Electrode polarization
FRA: Frequency Response Analyzer
FTIR: Fourier Transform Infrared Spectroscopy
Gelatin22%water: Gelatin with 22% water content
H-Bonds: Hydrogen Bonds
IJ: Ion Jelly
IJ1: Ion Jelly with a ratio 1:1 (gelatin/ionic liquid)
IJ3: Ion Jelly with a ratio 1:3 (gelatin/ionic liquid)
IL: Ionic Liquid
LNCS: Liquid Nitrogen Cooling System
MLR: Multiple Linear Regressions
MOS: Metal oxide semi conductors
NMR: Nuclear Magnetic Resonance
PCA: Principal components analysis
PCL: Poly (-caprolactone)
PED: Printed electrochemical devices
PFG: Pulse Field Gradient
PLS: Partial Least Squares
Ra: Relative responses
RTIL: Room temperature Ionic Liquid
SD: Region of sub-diffusive conductivity
SPEs: Solid polymer electrolytes
SOS: Poly (styrene-block-ethylene oxide-block-styrene)
Tc: Crystallization temperature
TFB: Thin film battery
Tg: Glass Transition Temperature
Tm: Melting temperature
UHF: Ultra high frequency
VHF: Very high frequency
VHOC: Volatile halogenated organic compounds
VFT: Vogel Fülcher Tammann-Hesse
Chapter 1
1. INTRODUCTION
1.1. Electrochemical Devices
Electrochemistry was born as a science at the end of the 18th century when, for the first time,
Alessandro Volta, an Italian Physicists, announced to the scientific community, based on Galvani’s experiments (Luigi Galvani, an Italian Physicists too, who had also studied medicine
)
, the invention of the electric battery, a device which would later revolutionize the concept of energy production having a large potential application [1-2]. This invention had such a huge impact in the scientific world, that currently it is considered as the birth of Electrochemistry [3]. Nonetheless, it is very interesting to note that, despite the fact that Galvani’s conclusions about his experiments were not exactly correct, the same experiments gave rise to an exhaustive work made by Alessandro Volta, who is considered the “Father of the Electrochemistry”. However, his work is based on Galvani´s observations and, for that reason, the importance of Luigi Galvani cannot be disregarded. It is noticeable that Galvani was the first to discover the current flow in an electrochemical system. However he did not realize it. The recognition of his notable work in this area is related to the battery name: galvanic cell [1].Nowadays, electrochemistry is one of the main pathways of chemistry giving rise to a wide range of technological advances due to the combination of many different materials in electrochemical cells. Consequently, new electroactive polymeric materials are produced every day, with very different properties, for instance, electroluminescence [4], semiconductor [5], electronic and ionic properties [6] or electrochromism [7]. From the arrangement between different polymers with several components, arises new opportunities of creating high performance electrochemical devices for commercial purposes. New polymers have been developed with multiple applications such as active electrodes in electronically conducting polymers, solid electrolytes in ionic conducting polymers and as transparent substrates (optically transparent plastic electrodes) [3].
The conductivity associated to a given material is based on the free mobility of ions which transport the current known as ionic conductors. The first ionic conductors were aqueous electrolytes. Later on, polymer and solid electrolytes appeared as a great innovation to fill some gaps related with liquid electrolytes.
The main characteristics sought in electrolyte solutions are nonvolatility and high ion conductivity, i. e., the ability to perform ion transfer between two electrodes of an electrochemical device, e.g. thin films batteries (TFBs), lithium ion batteries, photoelectrochemical cells, fuel cells and double layer capacitors. These are the crucial properties of advanced and safe electrolyte solutions that are needed for this kind of energy devices put in outdoor use. Nowadays, for these types of applications, safety is more an issue than performance and has to be taken into account in future material developments.
can avoid many of these problems. Nevertheless, solid electrolytes still have low conductivity at room temperature, when compared with liquid electrolytes, low biodegradability and high cost. However, a new solid electrolyte, Ion Jelly (IJ), was developed showing, in some cases, very competitive conductivities when compared with the conductivity of the pure IL (see section 1.1.2 and chapter IV).
There is a wide range of liquid electrolytes [8], ILs being a the suitable solution for electrochemical devices due to their unique properties.
1.1.1. ILs
ILs are also called molten salts; however, molten salts are normally solid salts whereas the IL can be liquid at room temperature. ILs are called room temperature ionic liquids (RTILs). The relationship between ILs and molten salts has been discussed for decades.
Michael Faraday in the 1830s was the first to investigate systematically, the electrolysis of molten salts and used his results to assist and establishing the fundamental law of electrolysis which bears his name.
It is now accepted that pure molten salts consist predominantly of ions. They differ, therefore, from all other classes of liquids in that they are the only group of pure liquids in which positively and negatively
charged particles coexist and could therefore logically be called “liquid electrolytes” or “ionic liquids” (Harry
Bloom, Liverpool 1961, from the Eleventh Spires Memorial Lecture in The Structure and Properties of Ionic
Melts: A General Discussion of the Faraday Society).
Molten salts imply a salt that is normally solid in a standard state of 298 K (25 ºC) and 1 bar, while a RTIL implies a liquid. Nevertheless, both are only composed of ions. Ideally, an IL should have a freezing point below 100 ºC. However, this is not a rule without exception, otherwise, what should we call pyridinium chloride (mp 144 ºC) or pyridinium ethanoate (mp < 25 ºC)? Therefore a suitable description of an IL is a liquid composed of ions and ion pairs (or parent molecules), dominant forces being ion-ion interactions [8].
The earliest IL referred in the literature is believed to be ethylammonium nitrate [EtNH3][NO3],
which was described by Paul Walden in 1914 [9]. Many ILs were discovered since then. For instance, in the late 40s, the first RTIL based on chloroaluminate anion was patented[10-11] and in the 60s a similar system was introduced, based on chlorocuprate anion, CuCl2-, and tetraalkylammonium cation
[12], one of the most important families of ILs. In 1967 the application of tetra-n-hexylammonium benzoate as a solvent was published [13]. In the 90s, the major event in this area was the discovery of a new type of ILs based on the 1-ethyl-3-methylimidazolium cation and the tetrafluoroborate anion [14-17]. Nevertheless, novel combinations of cations and anions have been proposed, giving rise to new ILs with very different and interesting properties and applications. One of the most remarkable properties for this work is undoubtedly their conductivity. A system containing both anions and cations that are free to move, will conduct electricity.
Table 1.1 - A selection of Electrical Conductivities of Liquids[18]
Electrolyte Solvent σ/S.cm-1 T/K
H2SO4 (30 wt. %) H2O 0.730 298
KOH (29.4 wt. %) H2O 0.540 298
NH4Cl (25 wt. %) H2O 0.400 298
[Et4N]+[BF4]- ( 1 mol/dm3) AN 0.060 298
LiN(CF3SO2)2 ( 1 mol/dm3) EC + DME (1:1) 0.0133 298
LiN(CF3SO2)2 ( 1 mol/dm3) EC + DC (1:1) 6.5x10⁻³ 298
LiCF3SO3 ( 1 mol/dm3) EC + DME (1:1) 8.3x10⁻³ 298
LiPF6 ( 1 mol/dm3) EC + DME (1:1) 0.016 298
[Et4N]+[BF4]- ( 0.65 mol/dm3) PC 0.0106 298
[EMim]+[BF4]- ( 2 mol/dm3) AN 0.047 298
[EMIm]+[BF
4]- ( 2 mol/dm3) PC 0.016 298
In table 1.2 it is possible to observe the electrical conductivities of several ILs and compare them with the liquid electrolytes above. Some ILs show very promising conductivities.
Table 1.2 - A selection of Electrical Conductivities of Ionic Liquids[18].
System σ/S.cm-1 T/K
[Bu3HexN][CF3SO2)2N] 1.60x10⁻⁴ 298
[MPPip][CF3SO2)2N] 1.51x10⁻³ 298
[BPy][BF4] 1.94x10⁻³ 298
[BMPyr][PF6] 7.65x10⁻³ 368
[EMIM][(CF3SO2)2N] 7.73x10⁻³ 298
[EMIM][DCA] 9.53x10⁻³ 298
[BMIM][DCA] 9.54x10⁻³ 298
[BMPyr][DCA] 9.83x10⁻³ 298
[EMIM][BF4] 0.01305 298
[EMPyr][(CF3SO2)2N] 0.0172 365
[BMPy][DCA] 0.0174 298
[P6,6,6,14][DCA ] 0.156 368
ILs have a broad range of conductivities from 0.1 – 740 mS/cm. Higher conductivities are associated to the cations 1-butyl-3-methylpyridinium [BMPy]+ and trihexyl (tetradecyl) phosphonium
[P6,6,6,14]+ whereas lower conductivities are associated to the ILs based on tributyl (hexyl) ammonium
[Bu3HexN]+, 1-butyl-pyridinium [BPy]+ and piperidinium [PMPip]+ cations (0.1 to 2 mS/cm).
Due to this essential property, the main application of ILs is as electrolytes [19-23]. Classical electrolytes are obtained by dissolution of salts in molecular solvents, which consist of solvated ions, their charged or neutral combinations, and solvent molecules. However, ILs, which are formed entirely by anions and cations, have a great advantage, since they are free of any solvent.
ILs are probably one of the most studied chemical compounds in the past decade. In addition to conductivity, a very useful property of ILs is the negligible vapour pressure, which is probably their “greenest” property. It should also be mentioned high thermal, chemical, and electrochemical stability [18], [24-25]. But are ILs really green? In April 2002, Albrecht Salzer asked the scientific community this question (Chemical and Engineering News, 2002, 80 [April 29], 4-6). Different opinions arose and Robin Rogers, a Chemist and distinguished scientist, gave his important contribution:
“Salzer has not fully realized the magnitude of the number of potential of ionic liquid solvents. However, by letting the principles of green chemistry drive this research field, we can ensure that the ionic liquids and ionic liquid processes developed are in fact green […] but there is a need for further work to demonstrate the credibility of ionic liquid-based processes as viable green technology. In particular, comprehensive toxicity studies, physical and chemical property collation and dissemination,
and realistic comparisons to traditional systems are needed” [26].
Table 1.3 - The twelve principles of Green Chemistry (retrieved from reference [27])
Prevention It is better to prevent waste than to treat or clean up waste after it is formed.
Atom Economy Synthetic methods should be designed to maximize the incorporation of all materials used in the process into the final product.
Less Hazardous Chemical Synthesis
Whenever practicable, synthetic methodologies should be designed to use and generate substances that pose little or no toxicity to human health and the environment.
Designing Safer Chemicals Chemical products should be designed to preserve efficacy of the function while reducing toxicity.
Safer Solvents and Auxiliaries The use of auxiliary substances (e. g. solvents, separation solvents, etc.) should be made unnecessary whenever possible and, when used, innocuous.
Design of Energy Efficiency Energy requirements of chemical processes should be recognized for their environmental and economic impacts and should be minimized. If possible, synthetic methods should be conducted at ambient temperature and pressure.
Use of Renewable Feedstock A raw material or feedstock should be renewable rather than depleting whenever technically and economically practicable.
Reduce Derivatives Unnecessary derivation (use of blocking groups, protection/deprotection, and temporary modification of physical/chemical processes) should be minimized or avoided if possible, because such steps require additional reagents and can generate waste.
Catalysis Catalytic reagents (as selective as possible) are superior to stoichiometric reagents.
Design for Degradation Chemical products should be designed so that at the end of their function they break down into innocuous degradation products and do not persist in the environment.
Real-Time Analysis for Pollution Prevention
Analytical methodologies need to be further developed to allow for real-time, in-process monitoring and control prior to the formation of hazardous substances.
Inherently Safer Chemistry for Accident Prevention
When ILs are used as electrolytes, the principle Safer Solvents and Auxiliaries strongly applies, unlike what happens with common liquid electrolytes, ILs are free from solvents, which means that it is possible to achieve a substantial reduction of both environmental and economic impact. When thinking of liquid electrolytes in a battery, a main drawback is the possible leakage of the (flammable) liquid, as mentioned earlier. Since most ILs are non-flammable, the principle of Inherently Safer Chemistry for Accident Prevention applies. For that reason, ILs are one of the main pillars of Green Chemistry. Nevertheless, Green Chemistry is favoured not only by the use of ILs, but also by solvents such as super critical fluids [28-29].
Nonetheless, it should be pointed out that some ILs have vapour pressure that allow to distil the previously believed “undistilled” [30-31]. Due to their negligible volatility, ILs were taken as non-toxic, but this common accepted notion as shown to be incorrect being proven that several ILs, commonly used to date are toxic to a wide range of organisms (Dongbin Zhao et al. Toxicity of Ionic Liquids). In fact, the tailor-made design of ILs to meet a particular application is probably the most fascinating and creative domain in IL research. The type of molecular interaction between cation and anion is determinant for physical-chemical properties such as melting temperature, glass transition temperature, Tg, or conductivity [32-33]. These are relevant parameters in applications of ILs as novel
electrolytes for electrochemical devices, such as dye synthesized solar cells, double layer capacitors, fuel cells, electrochemical windows and lithium secondary batteries[24-25].
The actual trend in electrochemical devices, point to ILs as the most promising approach to develop safe and highly conductive electrolytes. Nevertheless, the large scale production of the above electrochemical devices is following the printing trend due to large scale production impositions. To address this issue, different authors have tried to develop solid/polymeric/composite-based ILs [34-37] and some of these systems seem very competitive in terms of ionic conductivity [35-36].
One of the most simple and efficient approaches is based on gelation, which is a simple method that allows a good compromise between the retention of IL and its fluidity inside the polymeric network. This strategy is quite different from the traditional solid polymer electrolytes that results either from the doping of a given polymer matrix with an IL or from the introduction of polymerizable groups on IL structures. These so-called ion gels are in a way simpler than solid polymer electrolytes and exhibit improved conductivities. For instance, MacFarlane and co-workers [35] have shown the potential of an ion gel formed by gelation of poly(styrene-block-ethylene oxide-block-styrene) (SOS) triblock copolymer in 1-butyl-3-methylimidazolium hexafluorophosphate. This system has shown interesting conductivity values at room temperature (above 10-3 S cm-1). Such IL-based materials can work as electrolytes in different electrochemical devices and be used either as printer substrates or printable inks.
1.1.2. IJ
Nevertheless, the IL did not have a positive impact on the activity of the enzyme tested. Therefore, the mentors of the idea, P. Vidinha and N. Lourenço, started to think of different approaches. Since ILs can be used as templates for sol-gel matrices, they tried to add different materials to accomplish the immobilization of the ILs. The materials they first used were alginate and gelatine, in order to create a polymeric bead containing the IL. Of the two polymers used, gelatine was the one that allowed to produce a material with the desired conductive properties, which synthesis and applications are register in a patent [39]. The attractive values of the conductivity of IJ materials led to their use as electrolyte. The vision was to seek new applications in the area of sensors [40-41], electrospinning [42] and electrochemistry [38]. This thesis mainly results from the questions that arose from this article, namely: “Can we improve the IJ electrochemical window? Is it possible to increase IJ conductivity?”. “In what way does gelatine interact with the IL?”. The crucial question seemed to be, “Can we apply this simple combination of gelatine and IL to a battery? Can we solve the effective problems related to batteries? Can we produce an electrolyte that is conductive enough?”. These topics will be discussed along this thesis.
IJ is a light and flexible electrolyte. It is an extremely versatile conductive material that can be molded into different shapes, using several techniques, and can be adapted to multiple surfaces. Moreover, on cooling, IJ can undergo a liquid-gel transition near room temperature (near 308 K), which could make it a promising solution to develop electrolyte inks for printed electrochemical devices (PED) [38].
Going back to Table 1.3, there are some features that apply to IJ. Safer solvents and auxiliaries, for example, since in the preparation of IJ the only solvent that is used, is water, an innocuous solvent; reduce derivatives, since there is no need for blocking groups or protection/deprotection groups; design of energy efficiency, due to the fact that IJ is produced at relatively low temperature (35ºC) and ambient pressure; and inherently safer chemistry for accident prevention, since IJ is a solid polymer, which contains water and an IL, non-hazardous substances, and in its applications there is no danger of the occurrence of accidents such as leakage, explosions or fires.
The evaluation of basic thermophysical properties is vital to the design of IJs and to conceive new applications. For that purpose, it is essential to understand the physicochemical behaviour of ILs in an IJ matrix. To accomplish this goal, we have performed a dielectric relaxation spectroscopy (DRS) characterization, whose basic principles are described in the next section.
The main IJ system chosen for this study is based on 1-butyl-3-methyl imidazolium dicyanamide (BMIMDCA). The dicyanamide (DCA) compounds are liquid at room temperature and characterized by their low viscosity, water miscibility, and high thermo (over 373 K) and electrochemical stability (over 3.5 V) [46-47]. Moreover, the DCA ion is an anionic bridge ligand that has Lewis base attributes, which makes it particularly attractive to synthesize ILs with very specific properties. Compared to common anions such PF6 or BF4, DCA has a permanent dipole and thus facilitates the research on IL dynamics
through dielectric spectroscopy [47-48]. Other IJ systems were made based on different ILs. However, since dicyanamide was found to be the most suitable anion for the preparation of IJ films, the chosen ILs are composed by this anion, changing the type of cation. Three ILs were used, in addition to BMIMDCA: 1-ethyl-3-methyl imidazolium dicyanamide (EMIMDCA), 1-butyl-1-methyl pyrrolidinium dicyanamide (BMPyrDCA) and 1-butyl pyridinium dicyanamide (BPyDCA). The next figure shows the structure of each IL:
Figure 1.1 – Ionic liquid structures: 1-butyl-3-methyl imidazolium dicyanamide (BMIMDCA), 1-ethyl-3-methyl imidazolium dicyanamide (EMIMDCA), 1-butyl-1-methyl pyrrolidinium dicyanamide (BMPyrDCA) and 1-butyl pyridinium dicyanamide (BPyDCA).
physicochemical properties, which are ultimately implicated on IJ conductivity and consequently on its application to PEDs.
1.2. Polarization and Dielectric Relaxation Spectroscopy (DRS)
DRS was used to gain a better insight into the mechanism of charge transport that determines conductivity in the IJ and it precursors, and also to better understand the polarization effects that manifest in these materials. Basically dielectric relaxation occurs when a material, which is the dielectric, is submitted to a periodically alternating electrical field between two electrodes. This is the main phenomenon of DRS, which is a very well established experimental method and highly used in order to study the structure and the molecular dynamics in manifold systems, providing a powerful tool for the molecular dynamical study in confined spaces at both mesoscopic and molecular level.
The application of an oscillating electric field induces a polarization in the sample whose mechanisms will be next described.
1.2.1. Polarization Mechanisms
A pre-requisite for DRS is the presence of molecular dipoles in the material structure.
Fundamentally, matter is composed by a distribution of electrical charges, positive (protons) and negative (electrons). Accordingly, when an electric field is applied to a certain material, the atomic and molecular charges present within the material will respond to the presence of this field through a modification or distortion of these charges, i.e., a displacement from their equilibrium positions. This phenomenon is called polarization and describes the dielectric displacement which originates from the response of a material to an external field only. There are two main polarization mechanisms in the different materials [49]:
1) Induced Polarization that results from induced dipoles comprehending three different types of polarization: electronic polarization, which arises from the displacement of the electric cloud distribution with respect to the atomic nucleus, corresponding to electronic spectroscopy in ultra-violet and visible region of the spectrum of electromagnetic waves (figure 1.2); atomic polarization, which is observed when the atomic nucleus is reoriented in response to the electric field, which is intrinsic to the nature of the atom in a polar covalent bond, corresponding to vibrational spectroscopy in the infra-red domain; and ionic polarization, which is due to relative displacements between cations and anions in ionic crystals, for example, sodium chloride.
Figure 1.2– (a) - Electro Magnetic Spectrum; (b) – Time domain dielectric spectroscopy (adapted from:
http://www.colourtherapyhealing.com/colour/electromagnetic_spectrum.php; Y. Feldman, “The Physics of
dielectrics”, lecture 1, in http://aph.huji.ac.il/courses/2008_9/83887/index.html, accessed in March 2013).
2) Orientational or Dipolar Polarization, due to alignment of permanent dipoles. This type of polarization is originated from permanent ionic or molecular dipoles only, resulting in the alignment of dipoles with the applied electric field giving rise to orientational polarization. The orientation of permanent dipoles is driven by molecular motions that can be very local in nature or by cooperative motions of molecular segments in a viscous medium with times scales measurable by dielectric spectroscopy. However, there is a difference between ionic and molecular dipoles: in the later, the charge density is unequally shared by the covalently bounded nuclei of a molecule and therefore no significant differences on the dipolar moment are observed upon temperature changes, while the temperature increase highly shortens the lifetime of ionic dipoles which are maintained by electrostatic interactions.
The orientational polarization occurs only at low frequencies, and therefore it is the slowest mechanism.
It is important to note that both induced and orientational polarizations have very different times response: around 10-17 and 10-14 s for electronic polarization, 10-13 and 10-12 s for atomic polarization
and between 10-12 and 10-6 s for orientational polarization (see Figure 1.2).
Figure 1.3 shows the frequency dependent dielectric permittivity upon application of a time varying electric field. Here we can see different processes involved in the polarization and the respective differences in the intensity of each mechanism. While the atomic and electronic polarization may follow
a)
the changes in the electric field instantaneously, as already mentioned, orientational polarization response it is not immediate due to the resistance imposed to the dipole’s motion. The opposite is also true, whereas atomic and electronic polarizations disappear immediately upon removal the electric field, orientational polarization decreases slowly owing to the internal friction of the material which depends on viscosity [50]. The relaxation phenomenon is the delayed response to a variant stimulus; therefore, the time-dependent loss of orientation of dipoles upon removal the oscillating electric field is called dipolar relaxation.
The parameter that describes the polarization loss upon electric field removal is designated by relaxation time, i. e., it describes the time required for the dipolar polarization to decay 1/e of its initial
value, where eis the Neper number (see equation 1.8 later on text). At low frequencies the dipoles can
follow the changes in the electric field and the permittivity value has its highest value. With the frequency increase the dipoles do not have enough time to follow the changes in the field direction losing the ability to align with the applied electric field, resulting in a decrease in the dielectric permittivity, ɛ’ (see figure 1.3). It should be noted that the figure illustrates the behaviour of a molten liquid, highly mobile, which is not the case of the materials studied in this thesis, in which the dipolar response is shifted to lower frequencies. Relaxation processes are characterized by a peak in the imaginary part of permittivity and a marked decrease of the real part of the complex dielectric function with increasing frequency. Above this range of frequencies, the dipolar polarization does not contribute to the total polarization, and only induced polarization remains.
Figure 1.3 - A dielectric permittivity spectrum over a wide range of frequencies. ε′ and ε″ denote the real and the
imaginary part of the permittivity, respectively. Various processes are labelled on the image: ionic and dipolar
relaxation, and atomic and electronic resonances at higher energies (Redrawn from reference[51])
The permittivity due to these induced dipoles is known as the unrelaxed or permittivity at infinite frequency,
ɛ
. The difference between the permittivity at low frequencies, , and at highfrequencies is the dielectric strength, and establishes the relation between the applied electrical field, E, and the resulting orientational polarization, P, according to the following equation:
where
0
is the vacuum permittivity. For the low frequencies, equation 1.1 reduces to 1.1 – a), while for high frequencies the equation reduces to 1.1 – b).Additionally to the two polarization mechanisms described above, conductivity can also contribute to the dielectric response of the material due to propagation of mobile charge carriers that is due to translational diffusion of the electrons, holes and ions.
Migration of charges gives rise to conductivity that comes from this continuous movement of charges. Conductivity comprehends both types of intrinsic (e.g., proton transfer along hydrogen bonds) and extrinsic (e.g., ionic impurities) migrating charges. The last one describes conductivity as inversely proportional to viscosity, according to the viscous model of charge transfer (Stokes law). This means that a material with zero conductivity is obtained, if the viscosity is infinitely high. Nevertheless, this is only a theoretical situation meaning that the conductivity exhibited by a cross-linked-polymer network could be partially explained in association with intrinsic migrating charge [52].
The separation of charges at interfaces originates an additional polarization. This process arises from the build-up of charges at the inner dielectric boundary layers, or in the interphases between components in heterogeneous systems, known as interfacial, space charge, or Maxwell-Wagner-Sillars polarization. The accumulation of ions at the material-electrode-interface gives rise to electrode polarization. The latter mechanism is observed in the systems tested in this thesis (see chapters 3, 4 and 5).
1.2.2. Dielectric Spectroscopy
Since Debye, in 1927, established the relationship between dielectric relaxation and the molecular motions of molecular dipoles, the technique of dielectric spectroscopy has been gaining the attention of many research groups with around forty thousand articles published (according to search on IsiWeb visualized in March 2013).
Current methods were used for very low frequencies (f < 1Hz), and alternating current (a. c) for higher frequencies (1 a 107 Hz) in applications such as power, audio, ultra high frequency (UHF) and very high frequency (VHF). Methods for microwaves frequency (108 to 1011 Hz) were developed in the decade of 1940s, and in the decade of 1970s new advances were made in order to improve the spectroscopic methods for infrared frequencies (3x10¹¹ to 3x10¹² Hz) [53].
Nowadays, dielectric measurement techniques were developed in many different materials such as molecular liquids, solids and semi-conductors [54-59] giving very useful information about electrical conductivity and, hence, giving rise to knowledge about the effective mobility of charge carriers.
![Table 1.2 - A selection of Electrical Conductivities of Ionic Liquids[18].](https://thumb-eu.123doks.com/thumbv2/123dok_br/16484792.732683/37.892.95.798.659.1090/table-a-selection-of-electrical-conductivities-ionic-liquids.webp)

![Figure 2.3 – Temperature control device and its connection to the sample cell (reproduced from reference [5]).](https://thumb-eu.123doks.com/thumbv2/123dok_br/16484792.732683/73.892.160.743.685.1107/figure-temperature-control-device-connection-sample-reproduced-reference.webp)