and glucose in
Trichoderma reesei
using
high-throughput genomic and proteomic analyses
dos Santos Castro
et al.
R E S E A R C H
Open Access
Comparative metabolism of cellulose, sophorose
and glucose in
Trichoderma reesei
using
high-throughput genomic and proteomic analyses
Lilian dos Santos Castro
1†, Wellington Ramos Pedersoli
1†, Amanda Cristina Campos Antoniêto
1,
Andrei Stecca Steindorff
2, Rafael Silva-Rocha
1, Nilce M Martinez-Rossi
3, Antonio Rossi
1, Neil Andrew Brown
4,
Gustavo H Goldman
4, Vitor M Faça
1, Gabriela F Persinoti
3and Roberto Nascimento Silva
1*Abstract
Background:The filamentous fungusTrichoderma reeseiis a major producer of lignocellulolytic enzymes utilized by bioethanol industries. However, to achieve low cost second generation bioethanol production on an industrial scale an efficient mix of hydrolytic enzymes is required for the deconstruction of plant biomass. In this study, we investigated the molecular basis for lignocellulose-degrading enzyme productionT. reeseiduring growth in cellulose, sophorose, and glucose.
Results:We examined and compared the transcriptome and differential secretome (2D-DIGE) ofT. reeseigrown in cellulose, sophorose, or glucose as the sole carbon sources. By applying a stringent cut-off threshold 2,060 genes were identified as being differentially expressed in at least one of the respective carbon source comparisons. Hierarchical clustering of the differentially expressed genes identified three possible regulons, representing 123 genes controlled by cellulose, 154 genes controlled by sophorose and 402 genes controlled by glucose. Gene regulatory network analyses of the 692 genes differentially expressed between cellulose and sophorose, identified only 75 and 107 genes as being specific to growth in sophorose and cellulose, respectively. 2D-DIGE analyses identified 30 proteins exclusive to sophorose and 37 exclusive to cellulose. A correlation of 70.17% was obtained between transcription and secreted protein profiles.
Conclusions:Our data revealed new players in cellulose degradation such as accessory proteins with non-catalytic functions secreted in different carbon sources, transporters, transcription factors, and CAZymes, that specifically respond in response to either cellulose or sophorose.
Keywords:Trichoderma reesei, RNA-seq, DIGE, Cellulases, Bioethanol
Background
The growing worldwide demand for energy and the desire to reduce dependency on finite fossil fuels has increased interest in alternative energy sources, espe-cially liquid biofuels such as bioethanol and biodiesel. Ethanol obtained from lignocellulosic, non-food, feed-stocks (for example, sugarcane bagasse or wheat straw) represents an attractive alternative due to its applicability in existing motor vehicles. In addition, the combustion of
lignocellulosic-derived ethanol is considered cleaner than oil-based fuels [1]. Lignocellulosic biomass locks away approximately half of the energy produced by plants during photosynthesis and is the most abundant renewable organic carbon resource on Earth. Lignocellu-lose predominately consists of three polymers that are tightly interlinked, cellulose, hemicellulose and lignin, which correspond to approximately 98% of lignocellu-lose dry weight [2].
The production of fuel ethanol from lignocellulose re-quires biomass pretreatment, cellulose hydrolysis, hexose fermentation, separation, effluent treatment, and depend-ing on the raw material, additional costs may occur [3].
* Correspondence:[email protected] †
Equal contributors
1Department of Biochemistry and Immunology, Ribeirão Preto Medical
School, University of São Paulo, 14049-900 Ribeirão Preto, SP, Brazil Full list of author information is available at the end of the article
In recent years, new technologies have been developed for the pretreatment of sugarcane bagasse such as the application of novel enzymes to increase the sacchari-fication of cellulose/hemicellulose and specialized fer-mentation technologies, aiding in the development of second-generation (2G) bioethanol [4].
The filamentous fungus Trichoderma reesei is one of
the main producers of cellulases and hemicellulases used in industrial scale [5] and is especially important for the production of 2G biofuels from lignocellulose [6]. Des-pite T. reesei being the most prominent lignocellulosic
degrader among the genusTrichoderma, this species has
a reduced number of cellulolytic enzymes compared to other lignocellulosic fungi [7]. This ability is attributed toT. reeseipossessing efficient systems for the transport
of nutrients and the induction/secretion of cellulases. Subsequently, the study of the cellulolytic system in T. reeseiis of substantial interest to industrial biotechnology.
The T. reesei cellulolytic system consists of at least
three different types of enzymes: exoglucanases (cello-biohydrolases EC 3.2.1.91), endoglucanases (EC 3.2.1.4) and β-glucosidases (EC 3.2.1.21), which occur in various isoforms [8]. T. reesei produces at least two exo-acting
cellobiohydrolases (CEL7A and CEL6A), five endo-acting cellulases (CEL7B, CEL5A, CEL5B, CEL12A, CEL45A), two characterized β-glucosidases (CEL3A and CEL1A), and an additional five predicted β-glucosidases (CEL3B, CEL3D, CEL1B, CEL3C, CEL3E) [9]. Besides the classic cellulases, new players involved in cellulose degrad-ation were recently described in T. reesei, such as the
expansin-like proteins swollenin (SWOI) and expansin/ family 45 endoglucanase-like (EEL1, EEL2, and EEL3) [7,10]. In addition, GH61 polysaccharide monooxygenases (PMOs), which were recently re-annotated as AA9 (Auxiliary family activity 9, www.cazy.org), have been shown to enhance lignocellulose degradation by an oxi-dative mechanism [9].
The production of the main cellulases by T. reesei is
controlled by a sophisticated regulation system that avoids energy expenditure on unrequired processes when readily metabolisable carbon sources are present [6]. Since the 1960s when Mary Mandels and Elwyn T. Reese [11], raised the question ‘Cellulases are adaptive enzymes, but the natural substrate – cellulose – is insoluble. So how does induction occur?’ many studies have been con-ducted in an attempt to discover the natural inducer of cellulase formation [12-14]. It is now known that expres-sion of cellulolytic genes in T. reesei are induced in the
presence of cellulose and several disaccharides such as cel-lobiose (β-D-glucopyranosyl-(1→4)-β-D-glucopyranose), δ-cellobiono-1,5-lactone (β-D-glucopyranosyl-(1→
4)-D-glucono-1,5-lactone), lactose (β-D-galactopyranosyl-(1→
4)-D-glucose) and sophorose (2-O-β -D-glucopyranosyl-α-D-glucose)[15]. Sophorose is the strongest cellulase
inducer and is considered to be a possible natural inducer. It is assumed that sophorose is formed byT. reeseiduring
cellulose hydrolysis by a transglycosylation reaction [16]. However, additional low-molecular weight compounds have been reported to promote cellulase gene expres-sion, such as l-arabitol and l-sorbose [17]. In contrast, the presence of easily metabolisable carbon sources such as glucose and fructose, represses the expression of cellulolytic genes [18].
The regulation of cellulase gene expression occurs at the transcriptional level in a coordinated manner and is dependent on the presence of the inducer [19]. This regulation is driven by specific transcriptional factors (TFs) that bind to cellulase gene promoters acting either in a positive or a negative way. So far, at least three tran-scriptional activators XYR1, ACE2, the HAP2/3/5 com-plex, as well as the two repressors CRE1 and ACE1 are involved in the regulation of cellulase gene expression in
T. reesei[20].
Despite extensive studies attempting to answer the question raised by Mandels and Reese, neither the na-ture of the inducer nor howT. reesei senses the inducer
and relays the cellulase induction signal, have been eluci-dated. In this study we report a comparison of the tran-scriptome (RNAseq) and secretome (two-dimensional Fluorescence Difference Gel Electrophoresis (2-D DIGE)) ofT. reeseigrown on cellulose, sophorose and glucose,
in attempt to understand the molecular basis of lignocellulose-degrading enzyme induction. Our results provide new insights and revealed new players in cellulose degradation such as proteins with non-catalytic functions secreted in different carbon sources, transporters, tran-scription factors, carbohydrate active enzyme (CAZymes), and the regulatory network of T. reesei in response to
cellulose and sophorose. These data will contribute to the development of industrialT. reeseistrains by
engin-eering its metabolism to produce high levels of cellu-lases for plant cell-wall degradation.
Results
Global gene expression profiles ofTrichoderma reesei
grown in three different carbon sources
T. reesei QM9414 was grown directly in three different
carbon sources; glucose, sophorose, and cellulose as de-scribed (see Methods). We previously demonstrated the growth profiles and glucose consumption of T. reesei
from JGI (Trichoderma reesei v2.0) using the Bowtie
aligner. Overall, 68% of reads mapped to the reference genome (Additional file 1: Table S2). There was a high correlation (Pearson correlation, r2≥0.71) between the
three biological replicates of each condition used in the transcriptional analysis (Additional file 2: Figure S1A-B). After sample normalization, boxplots were constructed in order to determine if the conditions are comparable and the results are shown (see Additional file 2, Figure S1 C-D). The boxplots showed that both normalized samples and raw data displayed the same plot profile and no significant statistical difference (P <0.05), demonstrating that the
samples are comparable.
The T. reesei gene expression profiles obtained from
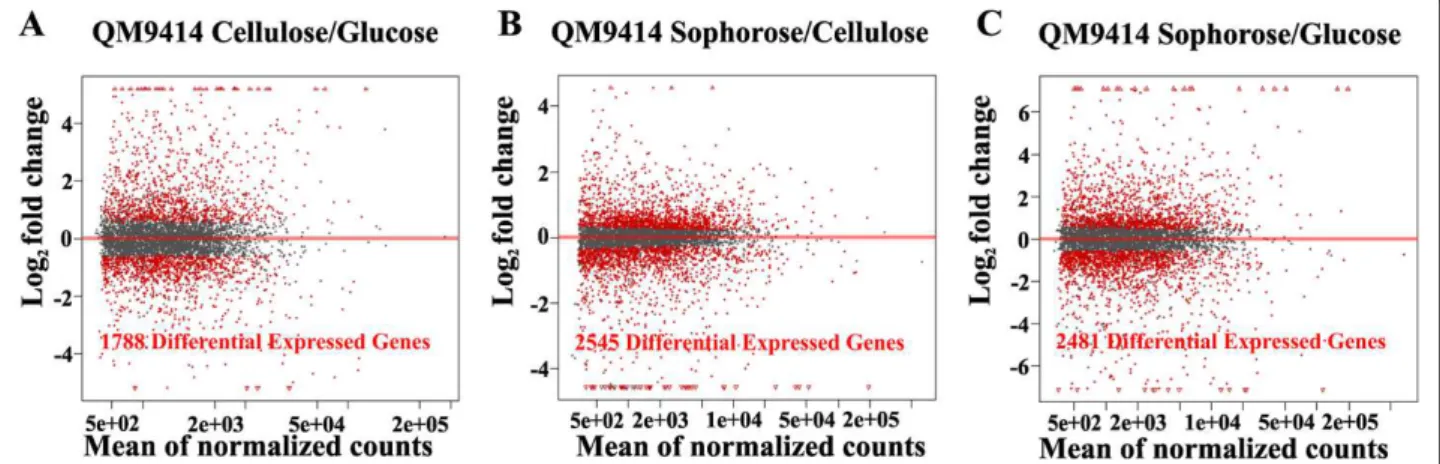
the different carbon sources were analyzed using R Bioconductor DESeq. Of the 9,129 genes encoded by the
T. reesei genome, 1,788 genes were identified as being
differentially expressed (P <0.05) on glucose/cellulose,
2,545 genes on sophorose/cellulose and 2,481 genes on sophorose/glucose (Figure 1A-C).
Appling a two-fold change (that is, log2fold change≥1
or≤ −1) and an adjusted P-value ≤0.05 as a threshold,
2,060 genes were identified as differentially expressed in at least one of the respective carbon source comparisons. Figure 2A shows that 1,886 genes were differentially expressed in glucose and in cellulose, as represented by 703 and 491 genes being up- and downregulated exclu-sively in glucose, and 254 and 102 genes being up- and downregulated exclusively in cellulose, respectively. On the other hand, 1,889 genes were differentially expressed in sophorose and in cellulose, with 321 and 405 being up- or downregulated in sophorose, and 262 and 97 being up- or downregulated in cellulose, respectively (Figure 2B). Yet, in glucose and sophorose 1,670 genes were modulated, with 262 and 245 being up- or down-regulated in sophorose, and 505 and 473 up- or
downregulated genes in glucose, respectively (Figure 2C). Interestingly, the number of transcriptionally modulated genes in sophorose (726) was greater than that in cellulose (359), when both were compared to glucose.
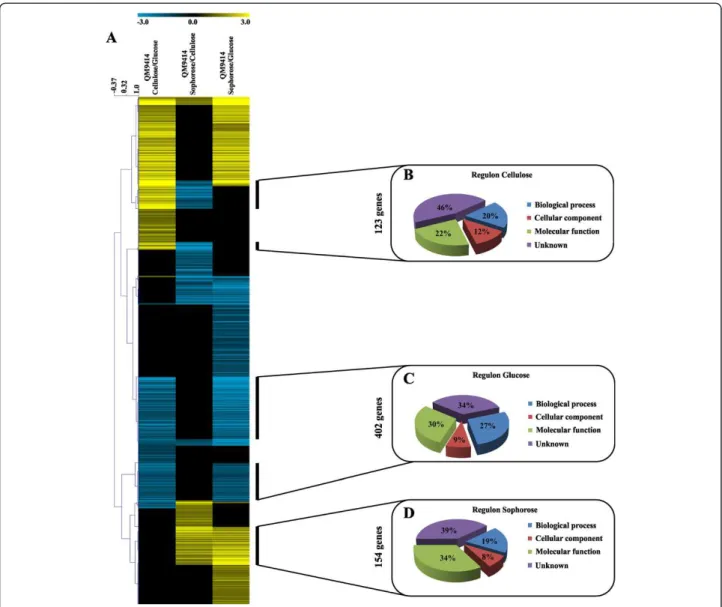
Hierarchical clustering of the 2,060 differentially expressed genes identified in the comparisons cellulose versus glucose (cel/glu), sophorose versus cellulose (soph/ cel) and sophorose versus glucose (soph/glu), allowed the identification of three possible regulons, representing 123 genes modulated by cellulose, 154 genes modulated by sophorose and 402 genes modulated by glucose, totaling 679 genes (Figure 3A; Additional file 3: Table S3). Gene Ontology (GO) annotation of the 679 carbon source-specific genes revealed that 46%, 34% and 39% of the genes from the cellulose, glucose and sophorose regulons respectively were genes of unknown function. These re-sults emphasize the potential for the discovery of genes involved in the cellulase production in T. reesei during
growth under inducing or repressing conditions.
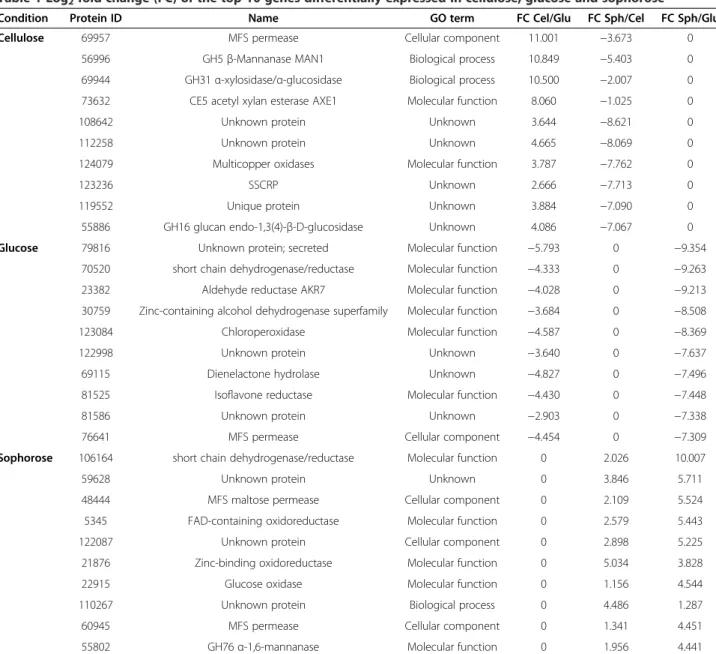
In order to further evaluate the carbon source-specific regulons shown in Figure 3, the top 10 genes differen-tially expressed on cellulose, glucose, and sophorose were identified (Table 1). The top 10 upregulated genes in cellulose included the glycoside hydrolases (GH) GH5, GH31 and GH16, the carbohydrate esterase CE5, an oxidase, a specific Major facilitator superfamily (MFS) permease and five proteins of unknown function (Table 1). The top 10 upregulated genes in sophorose included a GH76 hydrolase, four oxidoreductases, two MFS perme-ases and three proteins of unknown function (Table 1). It is interesting to note that there are more GHs in the top 10 upregulated genes of cellulose than in sophorose. As expected, the top 10 differentially expressed genes in glu-cose did not show any genes encoding hydrolytic enzymes (Table 1). These results indicate a specific gene expression in response to the available carbon source inT. reesei.
CAZYome
The mean FPKM (fragments per kilobase of exon per million fragments mapped) for all the genes within a sin-gle GH family were calculated. The total of all the FPKM means for each GH family when cultured in glucose, cel-lulose and sophorose were utilized to demonstrate the overall enzymatic potential and global transcriptional re-sponse (Figure 4). During growth in glucose the overall transcription of GH encoding genes was low, whereas growth in the presence of cellulose or sophorose re-sulted in a dramatic induction of a wide array of GH families, reflecting the transcriptional induction of the CAZYome. Similarly, cellulose and sophorose resulted in a greater transcriptional induction of cellobiohydro-lase members from the GH6 and GH7 families.
Looking in more detail, Table S4 (Additional file 4) shows the enzymes that are differentially upregulated in sophorose and cellulose. Twenty GHs and one CE were upregulated in response to the presence of sophorose whereas 23 GHs and two CEs were induced in the pres-ence of cellulose (Additional file 4: Table S4A and B). Interestingly, genes of enzymes involved in xylan deg-radation, such as xylanases (xyn2, xyn3, xyn4), acetyl
xylan esterase (axe1), xyloglucanase (cel74a),α-xylosidase (GH31) and arabinoxylans degradation, such as arabi-nofuranosidase (ABF1 and ABF2) were preferentially expressed in the presence of cellulose but not in sophor-ose (Additional file 4: Table S4B). Furthermore, a polysac-charide monooxygenase (cel61A) was upregulated only
in cellulose, in accordance with a role in the cellulose oxidation process. These results were also observed by
Bischofet al. [22] when transcriptional data from wheat
straw was compared to lactose. On the other hand, eight genes encoding α - andβ-glucosidases (including
cel3c, cel3b and cel1b), and a candidate for α-amylase and α-1,6-mannanase (while on cellulose aβ-mannanase was expressed), were upregulated in sophorose (Additional file 4: Table S4A). Interestingly, in both sophorose and cellulose, enzymes that degrade trehalose were induced indicating that the fungus may catabolize stored trehal-ose, producing gluctrehal-ose, during cellulase production.
When comparing the fold change in gene expression among the three conditions we observed that even in the presence of glucose, 17 GHs were upregulated (Additional file 4: Table S4C). These genes encoded for enzymes such as endoglucanase (cel5b), β-1,4-glucanase (GH5), β-1,3-glucanosyltransferase (GH72), and an uncharac-terized GH (Trire2_121136) appeared not to be subject to carbon catabolite repression.
Transcription factors
subgroup known as C2H2 (one of the most common type of transcription factors found in eukaryotes) were only induced in the presence of cellulose and sophorose, but not in glucose-grown cells (Additional file 5: Table S5), suggesting a specific response of C2H2 to the presence of cellulase inducer molecules. TF encoding genes from the bZIP family, on the other hand, showed higher expres-sion in cellulose (Trire2_110152), but were also present in sophorose (Trire2_73654) and glucose (Trire2_119759) (Additional file 5: Table S5).
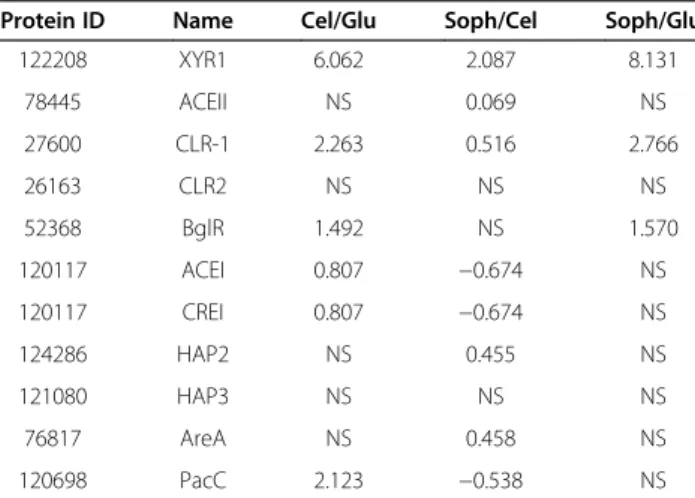
The expression of TF encoding genes already charac-terized as being involved in the regulation of the expres-sion of cellulases and hemicellulases is shown in Table 2.
Among the positively acting TFs (XYR1, ACE2, CLR-1, CLR-2, and BglR), the gene for XYR1 showed the highest expression level, followed by CLR-1 and BglR (Table 2). The TF genes ACE2 and CLR-2 showed no significant modulation in expression (P<0.05) between the various
carbon sources. These results reinforce the hypothesis that XYR1 is the major positive regulator of cellulases and hemicellulase gene expression. On the other hand, the TFs that negatively regulate hydrolytic enzyme gene transcription, such as ACE1 and CREI, showed a lower level of expression, compared to the positive-acting TFs, or were not transcriptionally modulated depending upon the carbon source, suggesting that these TFs may act in Figure 3Gene expression profile ofT. reesei, QM9414 strain, during grown in the presence of cellulose, sophorose and glucose as the carbon source.Expression scale is represented as Log2Fold Change.(A)Hierarchical clustering analysis was performed using Mev v.4.6.1, with
a cooperative manner or have a more effective mode of action. In addition, the gene for PacC (pH-responsive transcription factor) was regulated in a carbon source manner, showing a higher expression level in the pres-ence of cellulose (Table 2). Other TFs that have been shown to have a regulatory role, such as HAP2/3 and AreA, showed no significant modulation in gene expres-sion in any condition (log2> 1 and P <0.05). Taken
to-gether, our results depict a complex system of TFs that regulate the expression of hydrolytic enzymes, while also revealing additional, uncharacterized, TFs that appear to play a role.
Transporters
Genes that encode proteins involved in transport com-prise about 5% (459 genes) of theT. reeseigenome. Our
results show that among these genes, 14 were regulated exclusively by cellulose, 14 by sophorose, and 30 by glu-cose, applying an adjusted P-value <0.05 as thresholds
(Additional file 6: Table S6).
The MFS (Major facilitator superfamily) permeases are the most abundant proteins in the three analyzed condi-tions. These proteins enable the transport of essential nutrients and ions, plus the excretion of end products of metabolism and cell-environment communication [23]. Table 1 Log2fold change (FC) of the top 10 genes differentially expressed in cellulose, glucose and sophorose
Condition Protein ID Name GO term FC Cel/Glu FC Sph/Cel FC Sph/Glu
Cellulose 69957 MFS permease Cellular component 11.001 −3.673 0
56996 GH5β-Mannanase MAN1 Biological process 10.849 −5.403 0 69944 GH31α-xylosidase/α-glucosidase Biological process 10.500 −2.007 0 73632 CE5 acetyl xylan esterase AXE1 Molecular function 8.060 −1.025 0 108642 Unknown protein Unknown 3.644 −8.621 0 112258 Unknown protein Unknown 4.665 −8.069 0 124079 Multicopper oxidases Molecular function 3.787 −7.762 0 123236 SSCRP Unknown 2.666 −7.713 0 119552 Unique protein Unknown 3.884 −7.090 0 55886 GH16 glucan endo-1,3(4)-β-D-glucosidase Unknown 4.086 −7.067 0
Glucose 79816 Unknown protein; secreted Molecular function −5.793 0 −9.354
70520 short chain dehydrogenase/reductase Molecular function −4.333 0 −9.263 23382 Aldehyde reductase AKR7 Molecular function −4.028 0 −9.213 30759 Zinc-containing alcohol dehydrogenase superfamily Molecular function −3.684 0 −8.508 123084 Chloroperoxidase Molecular function −4.587 0 −8.369 122998 Unknown protein Unknown −3.640 0 −7.637 69115 Dienelactone hydrolase Unknown −4.827 0 −7.496 81525 Isoflavone reductase Molecular function −4.430 0 −7.448 81586 Unknown protein Unknown −2.903 0 −7.338 76641 MFS permease Cellular component −4.454 0 −7.309
Sophorose 106164 short chain dehydrogenase/reductase Molecular function 0 2.026 10.007 59628 Unknown protein Unknown 0 3.846 5.711 48444 MFS maltose permease Cellular component 0 2.109 5.524 5345 FAD-containing oxidoreductase Molecular function 0 2.579 5.443 122087 Unknown protein Cellular component 0 2.898 5.225 21876 Zinc-binding oxidoreductase Molecular function 0 5.034 3.828 22915 Glucose oxidase Molecular function 0 1.156 4.544 110267 Unknown protein Biological process 0 4.486 1.287 60945 MFS permease Cellular component 0 1.341 4.451 55802 GH76α-1,6-mannanase Molecular function 0 1.956 4.441
The gene encoding for the MFS permease (Trire2_69957) that was specifically highly upregulated in cellulose may be involved in the transport of disaccharides, due to a high similarity with a putative maltose permease of the human pathogenic fungus Talaromyces marneffei [24]. Another
maltose permease encoding gene (Trire2_48444) was also highly induced by sophorose. Conversely, the MFS
permease gene Trire2_76641 was expressed at a higher level in glucose than on sophorose or cellulose (Table S6). A BlastP analysis of this MFS permease showed 85% sequence identity to a synaptic vesicle transporter SVOP and also shared structural similarity to the human glucose transporter 1 (Glut1) [25]. Interestingly, a gene encoding a potential galactose permease (Trire2_62380) that was specifically expressed in glucose and a MFS permease encoding gene (Trire2_76800) that was induced by cel-lulose, both resembled the 19Saccharomyces cerevisiae
transporters that when deleted, contribute to the total loss of hexose uptake [26].
In order to identify the MFS permeases shared by cel-lulose and sophorose, the expression results were nor-malized with the glucose condition (Table 3). From 85 MFS permeases annotated in theT. reeseigenome, 22 of
them seem to be shared by cellulose and sophorose (Table 3). Among them, the most expressed were: crt1,
which has been shown to be required by T. reesei for
growth in cellulose and lactose, but not in xylan [27];
hxt1, a glucose permease; the MFS gene Trire2_50894, a
high affinity glucose transporter [28]; and an MFS gene related to cellulose signaling (Trire2_79202) [29]. Inter-estingly, the recently describedstp1, which is involved in
cellobiose and glucose transport [27], showed a higher level of expression in sophorose than in cellulose (Table 3), Figure 4Carbohydrate active enZymes (CAZy) genes and expression data from RNA-seq analysis.Fragments per kilobase of exon per million fragments mapped(FPKM) means for each glycolic hydrase (GH) family when cultured in glucose, cellulose and sophorose. CAZy classification was performed based on re-annotation of CAZy genes ofT. reeseiaccording to Hakkinenet al. [9].
Table 2 Log2fold change of characterized transcriptional factor genes involved in the regulation of cellulase and hemicellulase genes
Protein ID Name Cel/Glu Soph/Cel Soph/Glu
122208 XYR1 6.062 2.087 8.131 78445 ACEII NS 0.069 NS 27600 CLR-1 2.263 0.516 2.766 26163 CLR2 NS NS NS 52368 BglR 1.492 NS 1.570 120117 ACEI 0.807 −0.674 NS 120117 CREI 0.807 −0.674 NS 124286 HAP2 NS 0.455 NS 121080 HAP3 NS NS NS 76817 AreA NS 0.458 NS 120698 PacC 2.123 −0.538 NS
indicating a complex regulation on cellobiose/sophorose uptake byT. reesei.
Another family of proteins that showed carbon source-dependent transcriptional regulation were the ABC (ATP binding cassette) transporters, which were highly up-regulated in cellulose and sophorose. The AAA family (ATPases associated with a variety of cellular activities) and aquaglyceroporin genes were highly expressed in sophorose, whereas the ADP/ATP carrier genes were highly expressed in glucose (Additional file 6: Table S6). In addition, amino acids, oligopeptide, and ion trans-porter genes were identified as being regulated by the three carbon sources, with a larger number of genes expressed in cellulose.
Deciphering the regulatory network ofT. reeseiin
response to cellulose/sophorose
Using the experimental setup described above, we were able to identify a specific set of genes differentially regu-lated by the analyzed carbon sources. Using these data, the regulatory network of the genes identified as being modulated in a carbon source-dependent manner was
reconstructed (Figure 5). Extensive overlapping between the differentially expressed genes in cellulose and sophor-ose (710 genes) was observed. Additionally, genes specific-ally associated with each condition were identified, as exemplified by the large number of genes (441) whose expression was specifically modulated during growth in sophorose compared to glucose. These genes represent either genes silenced in glucose but induced by sophorose (upregulated: 154 genes), or genes that are necessary for growth in glucose but dispensable for growth in sophorose (downregulated, 287 genes). Accordingly the analysis of genes specific to cellulose showed an over-representation of upregulated genes (132 genes) that are related to the expression of cellulase genes as compared to glucose (201 in total) (Figure 5).
The comparison between the two inducing conditions provided additional information by revealing new differ-entially expressed genes that were not identified via the comparison with glucose. From the 692 genes differen-tially expressed between cellulose and sophorose, only 75 and 107 genes were assigned specifically to sophorose or cellulose respectively (Figure 5).
The majority of the genes identified from this network analysis were of unknown function. Importantly, a cellulose- or sophorose-specific enrichment of different gene classes was observed (Figure 6). During growth in cellulose, there was an enrichment of CAZy encoding genes (that is, GH64, GH 62, GH81, GH76, GH54), accessory proteins (Small secreted cysteine-rich protein (SSCRP), OOC1, and Epl1), transporters (most of them related to iron and metal transporters), TFs (lae1, C2H2
and Zn2Cys6 TFs) and a variety of proteins related to electron transport (Table S7). In contrast, there were only three CAZy encoding genes specific to growth in sophorose. However, four genes encoding Trichoderma
species-specific proteins were only induced on sophor-ose, suggesting that Trichodermapossesses a specialized
sophorose metabolism system (the complete list of dif-ferentially expressed genes is shown in Additional file 7: Table S7). The substantial overlap between the cellulose and sophorose transcriptomes supports the hypothesis that sophorose is a natural inducer of cellulase transcrip-tion, while the cellulose-specific enrichment for additional CAZymes and accessory proteins reflects the difficulty in the deconstruction of this insoluble substrate.
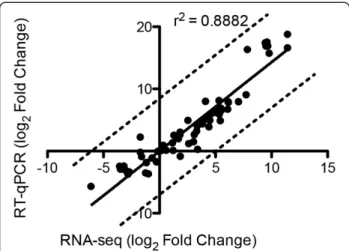
Quantitative real-time PCR (RT-qPCR) analysis
The RNA-seq data were validated using 20 genes with mRNA accumulation that was modulated when the following comparisons were performed: cellulose versus glucose; sophorose versus cellulose; and sophorose ver-sus glucose. The 10 upregulated genes were predomin-antly glycoside hydrolases and 10 downregulated genes were randomly chosen (see Additional file 8: Table S8). Table 3 The log2fold change of sharing MFS permeases
genes in cellulose and sophorose conditions
Protein ID Description Cellulose Sophorose
3405 MFS permease (Crt1) 7.802 9.893 22912 MFS permease
(glucose permease HXT1)
7.142 6.368 50894 MFS permease 6.683 7.069 79202 MFS permease, associated
with cellulose signalling
The log2fold change in gene expression between the three
comparisons obtained by RNA-seq and RT-qPCR demon-strated significant Pearson correlation (r2= 0.8882),
indi-cating the reliability of the RNA-seq analysis (Figure 7).
Secretome analysis by two-dimensional DIGE
TheT. reeseisecretome when grown in glucose, sophorose
and cellulose were analyzed by quantitative proteomics (two-dimensional DIGE), followed by liquid chromatog-raphy tandem mass spectrometry (LC-MS/MS) analysis.
The gels shown in Figure 8 are representative of all three independent gels and three biological replicates. The dis-tribution of the spots indicates that most of the secreted proteins have isoelectric points <6.0 and a molecular weight >30 kDa. In some cases, the molecular weights and isoelectric points observed in the two-dimensional gels were higher than expected, probably due to post-translational changes. Another observation was that various different spots were assigned to the same pro-tein, suggesting the presence of a number of isoforms Figure 5Gene regulatory network (GRN) of 2,060 differentially expressed genes inT. reeseiQM9414 in each tested condition.Cellulose versus glucose (CelGlu), sophorose versus cellulose (SphCel) and sophorose versus glucose (SphGlu). Genes are represented as nodes (shown as squares), and interactions are represented as edges (shown as lines, that is, red indicates upregulated interactions and green indicates downregulated interactions), that connect the nodes: 3,385 interactions.
Figure 6Gene Ontology(GO) enrichment analysis of different classes of genes upregulated in cellulose and sophorose inT. reseei.
or possibly degraded forms of the protein (Table S9.1 and S9.2, see Additional file 9 and Additional file 10, respectively).
The comparative analysis between the cellulose and glucose secretomes showed a total of 170 spots auto-matically detected by the software PDQuest (BioRad). Among these, 130 spots were statistically validated using a differential abundance ratio≥2.0-fold (P≤0.05). In total 89
spots were exclusively expressed in cellulose (Figure 8C)
however, only 36 spots could be identified by mass spectrometry (MS) (Table S9.1). The identified proteins included classical cellulases (CEL7A and CEL6A), such as β-1-3-glucanosyltransferase, α-L-arabinofuranosidase, β -1,3-glucanase,α-1,2-mannosidase, Xylanase 4,β-xylosidase and isoforms, as well as a non-hydrolytic CIPI (Cellulose-induced protein). Furthermore, some proteases were also identified as being expressed during growth in cellulose, as well as an protein of unknown function (Trire2_55887) and a novel protein isoamyl alcohol oxidase (Trire2_73631), (see Additional file 9: Table S9.1). On the other hand, 41 spots were exclusively expressed during growth in glucose (Figure 8C). Among them, 28 spots were identified by MS (Additional file 9: Table S9.1): an acid phosphatase-like protein, various isoforms of isoamyl alcohol oxidase, subtilisin-like protease PPRC1, cell-wall glucanosyltrans-ferase, amidase, a cerato-platanin, Epl1/Sm1 as well an SSCRP, and a unique protein (Trire2_121136).
When the sophorose secretome was compared to cellulose, the software PDQuest detected 183 spots, with 30 spots being exclusive to sophorose (≥2.0-fold;P≤0.05),
37 exclusive to cellulose (≥2.0-fold; andP≤0.05), and 116
spots common between the two conditions (Figure 8D). After MS analysis 20 spots from sophorose and 31 spots from cellulose were identified (see Additional file 10: Table S9.2). Among the enzymes classified as glycoside hydrolases, families GH3 (BXL1β-xylosidase,β-glucosidase BGL1/CEL3a), GH64 (endo-β-1,3-glucanase), GH7 (Cello-biohydrolase CBH1/CEL7a, Endo-β-1,4-glucanase EGL1/ CEL7b), GH72 (β-1-3-glucanosyltransferase), GH17 (glucan Figure 7Correlation between RNAseq and quantitative real-time
PCR (RT-qPCR).Comparison of log2fold change of 20 genes obtained
by RNA-seq and RT-qPCR. Real-time PCR was performed using the amplified cDNA from each RNA-seq sample. Strong, statistically significant Pearson correlation is shown between the expression levels measured using real-time PCR and RNA-seq.
endo-1,3-β-glucosidase), GH28 (exo-rhamnogalacturonase RGX1), GH61 (polysaccharide monooxygenase CEL61a), GH74 (Xyloglucanase CEL74a), and GH30 (endo-β -1,4-xylanase XYN4) were found to be exclusive in cellulose cultures, whereas only the GH13 (α-amylase) was de-tected in sophorose. Furthermore, a larger number of proteins not related to glycoside hydrolase functions were detected in sophorose than in cellulose, such as SSCRP, lipoate-binding, ribonuclease T2, ubiquinol cytochrome reductase, DNAse, cell wall glucanosyltransferase, CIP1, ceramidase family protein, amidase, isoamyl alcohol oxi-dase, and ubiquitin fusion protein. Another interesting feature of the secretome was that both unknown proteins and Trichodermaspecies-specific proteins with described
functions were found in both cellulose and sophorose, demonstrating the complexity and uniqueness of the
Trichodermasecretome during cellulose degradation.
In order to correlate the gene expression data with the secretome, the fold change from cellulose versus glucose in both datasets was compared. There was 70.17% cor-relation between gene expression and secreted protein profiles (see Additional file 9: Table S9.1). When cellulose and sophorose cultures were compared, lower correlation was observed (47%), possibly due to many non-significant differences in expression (P <0.05) in RNAseq analysis
(see Additional file 10: Table S9.2).
Discussion
In natural environments, free-living organisms are con-tinuously challenged with rapidly changing conditions that have a considerable impact on their lifestyle. Gen-omic and post-genGen-omic techniques have revealed that free-living organisms dedicate a large percentage of their genes to sensing environmental signals and the subse-quent coordination of gene expression in response to such cues. How the fungusT. reesei recognizes its
sub-strate and activates the transcription of genes encoding transporters and TFs that culminate in the production of hydrolytic enzymes has been a subject of speculation since the 1960s. By using high-throughput genomic and proteomic approaches we describe both repressing (glu-cose) and de-repressing (cellulose or sophorose) conditions, identifying new players in cellulose degradation inT. reesei.
In addition, the comparison between cellulose and sophor-ose, the hypothesized natural inducers of cellulase produc-tion, revealed a striking similarity in the global profiles.
The transcriptome study of T. reesei identified 123
genes that were specifically induced by cellulose, 154 by sophorose and 402 by glucose (Figure 3). Within these gene sets, 8 permease/transporter genes were induced in cellulose, 6 in sophorose and 11 in glucose (see Additional file 3: Table S3 and Additional file 8: Table S8 respect-ively). Of these 25 transporters, 10 showed possible hom-ology to N. crassa homologues and one of them, MFS
permease (Trire2_76800) (highly induced in the presence of cellulose), allowed S. cerevisiae to transport xylose
[30,31]. Furthermore, a gene encoding a putative galactose permease (Trire2_62380) found in glucose and another MFS permease (Trire2_76800) regulated by cellulose, showed similarity to S. cerevisiae transporters involved
in hexose uptake [26]. Additional transporters were in-duced by both cellulose and sophorose, suggesting that sophorose could be the natural inducer of cellulase gene transcription in T. reesei. Despite that, the functions of
these transporters in T. reesei remain obscure. For
in-stance, the transporter Trire2_3405 was recently identified to be specifically involved in cellulase induction by lactose [29], but has also been described as being involved in cel-lobiose transport [27]. Furthermore, the same transporter was upregulated during growth on wheat straw [22,28], cellulose or sophorose (Table 3). This lack of specificity by transporters could be explained by the close struc-ture of cellobiose/lactose/sophorose or by the fact that some transporters can act as transporters and nutrient sensors. However, more detailed studies will be needed to characterize these transporters and generate a better understanding of the inducer/repressor transport sys-tem inT. reesei.
Global gene expression analysis by RNA-seq enabled the construction of gene regulatory networks (GRN) that enhanced the understanding of the interaction between different genes during the degradation and metabolism of cellulose. Studies on the control of catabolic genes related to the metabolism of simple substrates (such as glucose) performed in model organisms have revealed very complex GRN, thus, an even more sophisticated network controlling catabolic functions related to the metabolism of complex substrates, such as cellulose, could have been anticipated [32]. In theT. reesei model
for cellulose degradation, the deep knowledge of the catabolic activities related to cellulose metabolism is accompanied by a very limited understanding of the regulatory pathways responsible for controlling gene ex-pression [22,32,33]. In fact, despite the TFs, XYR1 and CRE1 [34,35], which regulate the induction or repression of the cellulolytic enzymes respectively, and a few more specific regulators (ACE1, ACE2, BGLR) [36,37] that have been experimentally characterized, there remains a lack of information on how, and to what extent, the expression of these enzymes are connected to the core GRN ofT. reesei[32]. This is important as GRN in
free-living organisms are usually densely connected and the final decision on the expression of a particular gene set is generally controlled by many different external/internal signals [38]. The collection of omics data provided here
tries to fill this gap by providing a global analysis of T. reesei grown in three different substrates (cellulose,
started building a bona fide regulatory network for this organism through the identification of 43 TF genes spe-cifically induced in some particular growth conditions (see Additional file 5: Table S5). The GRN revealed that some of factors are exclusively induced in response to cellulose or sophorose (see Additional file 7: Table S7). For instance, the methyltransferase LAE1 has already been described as controlling the expression of cellulases, auxiliary factors for cellulose degradation, β-glucosidases and xylanases [39], proteins commonly found in response to inducers, cellulose, lactose and wheat straw [22,28]. However, our results showed that LAE1 is preferentially expressed in response to cellulose, indicating that the fun-gus has specific signaling for the metabolism of cellulose. This hypothesis is supported by the fact that recent study showed that LAE1 affects other components of cellulose degradation, such as non-ribosomal peptide synthases, ankyrin-repeat proteins, iron uptake, PTH11-receptors, and oxidases/monoxygenases [40], genes that were also upregulated in the presence of cellulose in our data and in the presence of wheat straw [22]. Another TF gene upreg-ulated in response to cellulose (Trire2_120698) showed homology to theAspergillus nidulanspH-responsive
tran-scription factorpacC.It is known that this TF controls a
range of functions in filamentous fungi [41]. Although studies have shown that pH is involved in cellulase pro-duction inT. reesei[42], the regulation of cellulase genes
by any pH-responsive TF is still unknown.
The expression level of thecre1 gene was low even in
the presence of glucose. One explanation for this result is the fact that some TFs can act either directly on CAZyme encoding genes or indirectly by regulating other TFs that in turn regulate the expression of CAZyme genes. Here we identified some TF genes that are candi-dates for the indirectly transcriptional regulation, in a carbon source-dependent manner (see Additional file 5: Table S5). Some of these TFs could play an important role in the coordination of gene expression downstream in the network, either in association with the previously identi-fied general factors at the target promoters or in isolation, in a sort of cascade signaling pathway. Additionally, the identified TFs could work as check points for the integra-tion of different physiological/environmental signals, such as metabolic status of the cell, levels of light, presence of stresses, et cetera. [43,44]. The TFs identified here are candidates for further investigation into the mecha-nisms of signal integration in this biotechnologically relevant fungus. Understanding these missing regulatory interactions is pivotal for future attempts to synthetically engineerT. reeseifor enhanced cellulolytic functions.
Analyses of the T. reesei secretome has commonly
focused on growth in cellulose or lactose [45-47]. Be-sides the classical cellulases already described, our differ-ential secretome showed the presence of polysaccharide
monooxygenase, xyloglucanase CEL74a, and xylanases, induced by cellulose, whereas in sophorose, amidase, amylase and isoamyl alcohol oxidase they were described for the first time. The strong correlation between tran-scriptome and secretome data in the presented study is consistent with other comparable studies [29,48,49]. Fur-thermore, a comparison of the cellulose and sophorose transcriptome and differential secretome data did not detect a massive difference in any analyzed category of proteins. This observation suggest that the signaling for cellulose and sophorose to induce cellulase formation is very conserved and thus sophorose still remains a strong candidate as natural inducer.
Despite extensive work related to the regulation of cellulases inT. reesei, the real identity of the natural
in-ducer is not yet established. New evidence has recog-nized cellobiose and cellodextrins as strong candidates for natural inducers [50]. Indeed, studies with N. crassa
[51] and A. niger[52] have discredited sophorose as the
natural inducer. It is known that T. reesei possesses a
different mechanism for the regulation of cellulase pro-duction in response to sophorose when compared to other lignocellulose-degrading fungi [5]. Our GRN data showed little differences in the regulation of gene expres-sion by the inducers cellulose and sophorose, suggesting that sophorose could be a natural cellulase inducer. But how did this divergence betweenT. reeseiand other fungi
occur? Comparative genomics between T. atroviride, T. virens and T. reesei suggest that the ancestral state of Hypocrea/Trichoderma was indeed a mycoparasitic,
pos-sibly of wood-degrading basidiomycetes [5].T. reesei
sub-sequently may have kept the mycoparasitic characteristic for substrate competition, converting cellobiose to sophor-ose by a transglycosylation reaction and then metabolizing sophorose. This hypothesis can be supported by the fact that new species-specific proteins were upregulated only in sophorose and by the fact that cellobiose and sophorose are transported and metabolized at different rates [50]. For this reason, we propose that both cellobiose and sophorose act as co-inducers of cellulase formation in T. reesei. These facts could explain why among
lignocellulose-degrading fungi, T. reesei is the more efficient degrader,
despite its smaller enzymatic arsenal.
Conclusions
Our study shows little difference between gene expres-sion and the secretome during the growth ofT. reeseiin
cellulose and sophorose. The difference in gene expres-sion is associated with CAZymes, accessory proteins, transporters, TFs, and electron transport. Together with recent literature, the results shown here suggest that both cellobiose and sophorose act as co-inducers of cellulase production in T. reesei. Further functional
involved in growth in cellulose will open up new lines of research into clarifying cellulase and hemicellulase regu-lation in T. reesei. In addition, the data shown in this
study will contribute to the construction of industrial strains of T. reesei that produce high levels of cellulase
for plant cell-wall degradation thus facilitating its appli-cation in 2G-bioethanol production.
Methods
Strain and growth conditions
T. reesei strain QM9414 (ATCC 26921) was obtained
from the Molecular Biotechnology Laboratory, Institute, TU Vienna, Austria. The strain was maintained on MEX medium (malt extract 3% (w/v) and agar-agar 2% (w/v)) at 4°C. QM9414 was grown on MEX medium at 28°C for 7 to 10 days to complete sporulation. For gene ex-pression assays, a spore suspension containing approxi-mately 107 cells mL−1 was inoculated into 200 mL of
Mandels-Andreotti medium [53] containing 1% (w/v) of cellulose (Avicel), or 2% (w/v) of glucose, or 1 mM of sophorose, as the sole carbon source. The cultures were incubated on an orbital shaker (200 rpm) at 28°C for 24, 48 and 72 hours using cellulose; for 24 and 48 hours with glucose; and 2, 4 and 6 hours with sophorose, as the carbon source. In the latter, the mycelium was previ-ously grown on glycerol 1% (w/v) for 24 hours. After this time, the mycelium was washed with Mandels-Andreotti medium without peptone and then transferred to 20 mL of Mandels-Andreotti medium without peptone contain-ing sophorose 1 mM. All experiments were performed in three biological replicates. The resulting mycelia were collected by filtration, frozen and stored at −80°C until
RNA extraction and the supernatants were used for secretome analysis.
RNA extraction
Total RNA was extracted from mycelia of each sample using TRIzol® RNA kit (Invitrogen Life Technologies, Carlsbad, CA, USA), according to the manufacturer’s instructions. RNAs concentrations were determined by spectrophotometric OD 260/280 and RNA integrity was verified by both the Agilent 2100 Bioanalyzer (Agilent Technologies, Waldbroon, Germany) and gel electro-phoresis in 1% agarose.
High-throughput sequencing (RNA-seq)
Total RNA of three biological replicates, cellulose (24, 48 and 72 hours), sophorose (2, 4 and 6 hours) and glu-cose (24 and 48 hours) were time points that were pooled, resulting in nine samples for the preparation of next-generation sequencing libraries using the TruSeq RNA Sample Prep kit (Illumina, San Diego, CA, USA). The total RNA samples obtained from T. reesei were
lyophilized and stored using the RNAstable tube kit
(Biomatrica, San Diego, CA, USA) in order to maintain the RNAs integrity for sequencing. Nine barcoded librar-ies (cel1-3, gluc 1–3 and soph 1–3) were prepared and sequenced by LGC Genomics GmbH (Berlin/Germany) using the Illumina Hiseq 2000 platform.
Data analysis
The Illumina Hiseq 2000 system was used to sequence approximately 117 million 100 bp paired-end reads. These sequences were quality-filtered and mapped to the Trichoderma reesei 2.0 reference genome, available
from the JGI Genome Portal (http://genome.jgi-psf.org/ Trire2/Trire2.home.html), using the Bowtie aligner ver-sion 0.12.8 [54], allowing for two mismatches and only unique alignments. After alignment, Samtools version 0.1.18 [55] was used to process the alignments files, which were visualized using the Integrative Genomics Viewer [56]. The genes were annotated using Trichoderma reesei
2.0 reference genome and a local database provided by Professor CP Kubicek (TU, Vienna). Unknown proteins were defined as proteins that have yet to be assigned a function in any ascomycete and T. reesei species-specific
proteins were defined to be proteins that did not occur in any other Pezizomycotina [57]. Bioconductor DESeq pack-age version 1.10.1 [58] was utilized for the differential expression analysis, using two-fold change cutoff, that is, log2fold change≥1 or≤ −1 and an adjustedP-value≤0.05
as thresholds. Samples were normalized using median log deviation DESeq, available in the Bioconductor package. Cluster analysis was carried out using the software Mev v.4.6.1 to identify cellulose, sophorose and glucose regu-lons. The average linkage method was used for cluster generation, with uncentered correlation as the similarity metric. Functional enrichment analysis of differentially expressed genes was performed using GO terms was performed using the BayGO algorithm [59]. GO terms sig-nificantly enriched, (that is, withP-values≤0.05) were
ana-lyzed further. Raw sequence data and count data for all samples are available at [GEO: GSE53629]. CAZy classifi-cation was performed based upon the re-annotation of CAZy genes ofT. reeseiaccording to Hakkinenet al. [9].
Regulation network ofT. reesei
In order to reconstruct the regulatory network of T. reeseiunder the experimental condition analyzed, a table
using the following information was generated: inducing condition (QMCelGlu, QMSphCel and QMSphGlu, select-ing differentially expressed genes, up- and downregulated in each condition, P ≤0.05), the interaction type (up- or
Quantitative qRT-PCR analysis
Differentially expressed genes identified by the RNA-seq analysis were further analyzed by qRT-PCR in order to validate their expression. In this analysis, the same RNA samples, utilized for the RNA sequencing experiments were re-used. Approximately, 1 μg of RNA was treated with DNAseI (Thermo scientific) and reverse-transcribed to cDNA using the First Strand cDNA kit Maxima™ Synthesis according to manufacturer’s instructions. The cDNA was diluted to 1/50 fold and used for real-time PCR analysis in the Bio-Rad CFX96™ System, using SsoFast™EvaGreen®Supermix (Bio-Rad, San Francisco, CA, USA) for signal detection in accordance with the man-ufacturer’s instructions. Genes encoding actin (act)
and a small GTPase SAR/ARF-type (sar1) were used as
endogenous controls according to [61]. Twenty genes, including up- and downregulated genes in cellulose compared to glucose samples (see Additional file 11: Table S1), were used for qRT-PCR analysis. The following amplification reaction was used: 95°C for 10 minutes followed by 39 cycles of 95°C for 10 seconds, 60°C for 30 seconds followed by a dissociation curve of 60°C to 95°C with an increment of 0.5°C for 10 seconds. Gene expression values were calculated according to the 2-ΔΔCT
method [62] using the QM9414 strain growth on glucose as the reference sample. Data analysis was performed using GraphPad Prism v 5.1 software.
Sample preparation for proteomic analysis
The protein concentration was determined using the kit Bio-Rad Protein Assay, based on the Bradford method. Protein concentration was adjusted to 1 μg /μl, and 150μg used for in two-dimensional DIGE and 300μg in two-dimensional SDS-PAGE. Samples were precipitated using 10% tricarboxylic acid (TCA) in acetone and incu-bated at −20°C overnight. Samples were centrifuged at
10,000 g for 10 minutes at 4°C and the supernatant re-moved.β-mercaptanol was added (0.07%) in acetone and centrifuged at 10,000 g for 10 minutes at 4°C. This was repeated three times, discarding each supernatant after centrifugation. After precipitation, the pellet was purified using Ettan2D Clean-Up Kit (GE Healthcare, Waukesha, WI, USA).
Two-dimensional differential gel electrophoresis
The proteins (150μg) secreted by T. reeseiunder
differ-ent conditions were labeled with 400 pmol CyDyes (Cy3 or Cy5) according to the manufacturer’s instructions (GE Healthcare, Waukesha, WI, USA). An internal pool generated by equal amounts of all samples was labeled with Cy2. The isoelectric focusing was carried out on 18-cm linear IPG strips, pH 4–7, with the addition of 1.2% DeStreak and 1% IPG buffer 4–7 (GE Healthcare). Isoelectric focusing was performed on IPGphor III in
four steps: 500 V for 60 minutes, 1000 V for 60 minutes, 8000 V for four hours and 8000 V for six hours. The strips were reduced (1.5% w/v dithioerythritol) and alky-lated (2.5% w/v iodocetamide) in equilibration buffer (6 M urea, 50 mM Tris–HCl, pH 6.8, 30% glycerol, 2% SDS). Equilibrated strips were run on homogeneous 12.5% polyacrylamide gels using an Ettan DALTsix elec-trophoresis (GE Healthcare). All the experiments resulted in three independent replicates for each experimental con-dition. The preparative gels were stained using colloidal Coomassie and destained with Milli-Q water to remove excess Coomassie particles. Gels were scanned using the laser scanner Pharos FX Plus (Bio-Rad) and Quantite One software (Bio-Rad) using a resolution of 100 μm and the appropriate wavelength. The images were ana-lyzed with the software PDQuest Advanced 2-D Analysis Software (Bio-Rad). Differential expression was deter-mined by statistical analyses using the t-test, as the
parameter of significance (P≤0.05).
Protein identification by mass spectrometry
Spots which increased or decreased in volume (protein content) by two-fold or more were manually excised from the gels and washed four times with 50 mM NH4HCO3containing 50% v/v acetonitrile (ACN) to
re-move SDS and dye. They were then washed with ACN and completely dried in a SpeedVac (Savant Instrument, Farmingdale, NY, USA). Each spot was rehydrated with 20μl 50 mM NH4HCO3containing 0.3μg of sequencing
grade modified trypsin (Promega, Madison, WI, USA). After 30 minutes of rehydration with the trypsin solu-tion, spots were covered with 50 mM NH4HCO3. The
peptide matching was performed using a Peptide Prophet [64] score greater than 0.8. Peptides that met these criteria were further grouped to protein sequences using the Protein Prophet [65] algorithm and only proteins with an error rate of 5% or less and two peptides sequences identified were considered as valid identifications.
Additional files
Additional file 1: Table S2.Summary RNA-seq reads obtained (Illumina Hiseq 2000) in this study.
Additional file 2: Figure S1.Biological replicates used for the RNA-seq analysis.(A)Graphs representing the Pearson correlation between biological replicates of each sample.(B)Principal component analysis (PCA) of the samples analyzed.(C)boxplot of all normalized samples and
(D)boxplots of raw data.
Additional file 3: Table S3.1.Genes from cellulose regulon.Table S3.2.
Genes from glucose regulon.Table S3.3.Genes from sophorose regulon protein.
Additional file 4: Table S4A.Carbohydrate active enzyme (CAZy) genes that are upregulated in sophorose.Table S4B.CAZy enzymes that are upregulated in celulose.Table S4C.CAZy enzymes that are upregulated in glucose.
Additional file 5: Table S5.The main transcription factors genes induced in presence of cellulose, sophorose and glucose. Additional file 6: Table S6.Upregulated transporters genes in presence of cellulose, sophorose and glucose. Values are expressed in log2 fold change.
Additional file 7: Table S7.Differentially expressed genes in cellulose and sophorose. Numbers are expressed as log2fold change.
Additional file 8: Table S8.Comparison of the gene expression levels assayed by RNA-seq and RT-qPCR. The numbers highlighted in red did not correlate.
Additional file 9: Table S9.Identified proteins from differential gel electrophoresis (DIGE) analysis between cellulose and glucose. Additional file 10: Table S10.Identified proteins from differential gel electrophoresis (DIGE) analysis between cellulose and sophorose. Additional file 11: Table S1.Primers used in the validation of differentially expressed genes.
Abbreviations
2G:second-generation; AA9: Auxiliary family activity 9; ABC: ATP binding cassette; ABF: arabinofuranosidase; ACN: acetonitrile; AXE: acetyl xylan esterase; bp: base pairs; CAZy: carbohydrate active enzyme; CE: carbohydrate esterase; CIP: Cellulose-induced protein; DIGE: differential gel electrophoresis; FC: fold-change; FPKM: fragments per kilobase of exon per million fragments mapped; GH: glycoside hydrolase; GH31:α-xylosidase; GRN: gene regulatory network; LC/MS/MS: liquid chromatography tandem mass spectrometry; MEX: malt extract medium; MFS: Major facilitator superfamily; MS: mass spectrometry; PMO: polysaccharide monooxygenase; RT-qPCR: quantitative real-time PCR; SSCRP: Small secreted cysteine-rich protein; SWOI: swollenin; TF: transcriptional factor; xylanase: xyn.
Competing interests
The authors declare that there are no competing interests.
Authors’contributions
LSC performed the experimental design, laboratory experiments, performed the bioinformatics analysis, and drafted the manuscript. WRP performed the experimental design, DIGE experiments, and drafted the manuscript. ACCA performed the bioinformatics analysis, and drafted the manuscript. ASS performed the bioinformatics analysis, drafted the manuscript, and interpreted the data for the work. RS-R, NMM-R, AR performed the bioinformatics analysis, and drafted the manuscript. NB and GHG drafted and revised the manuscript
and discussion, and interpreted the data for the work. VMF performed the secretome analysis and drafted the manuscript. GFP supervised the bioinformatics analysis and drafted the manuscript. RNS designed the project, supervised the research study, prepared/drafted the manuscript, and final approved of the version to be published. All the authors have read and approved the final manuscript.
Acknowledgments
This work was supported by The State of São Paulo Research Foundation (FAPESP) (proc. 2010/15683-8). We are grateful to Professor Christian Kubicek (TU-Wien) for helping in the experimental design of this study.
Author details
1Department of Biochemistry and Immunology, Ribeirão Preto Medical
School, University of São Paulo, 14049-900 Ribeirão Preto, SP, Brazil.
2Departamento de Biologia Celular, Universidade de Brasília, Asa Norte,
70910-900 Brasília, DF, Brazil.3Department of Genetics, Ribeirão Preto Medical School, University of São Paulo, 14049-900 Ribeirão Preto, SP, Brazil.
4
Faculdade de Ciências Farmacêuticas de Ribeirão Preto, Universidade de São Paulo, São Paulo, and Laboratório Nacional de Ciência e Tecnologia do Bioetanol, Campinas, Brazil.
Received: 14 January 2014 Accepted: 26 February 2014 Published: 21 March 2014
References
1. Pessoa-Jr A, Roberto IC, Menossi M, dos Santos RR, Filho SO, Penna TC:
Perspectives on bioenergy and biotechnology in Brazil.Appl Biochem Biotechnol2005,121–124:59–70.
2. Mosier N, Wyman C, Dale B, Elander R, Lee YY, Holtzapple M, Ladisch M:
Features of promising technologies for pretreatment of lignocellulosic biomass.Bioresour Technol2005,96:673–686.
3. Ojeda K, Kafarov V:Exergy analysis of enzymatic hydrolysis reactors for transformation of lignocellulosic biomass to bioethanol.Chem Eng J 2009,154:390–395.
4. Soccol CR, Vandenberghe LPD, Medeiros ABP, Karp SG, Buckeridge M, Ramos LP, Pitarelo AP, Ferreira-Leitao V, Gottschalk LMF, Ferrara MA, Bon EPD, de Moraes LMP, Araujo JD, Torres FAG:Bioethanol from lignocelluloses: Status and perspectives in Brazil.Bioresource Technology2010,101:4820–4825. 5. Kubicek CP, Herrera-Estrella A, Seidl-Seiboth V, Martinez DA, Druzhinina IS,
Thon M, Zeilinger S, Casas-Flores S, Horwitz BA, Mukherjee PK, Mukherjee M, Kredics L, Alcaraz LD, Aerts A, Antal Z, Atanasova L, Cervantes-Badillo MG, Challacombe J, Chertkov O, McCluskey K, Coulpier F, Deshpande N, von Dohren H, Ebbole DJ, Esquivel-Naranjo EU, Fekete E, Flipphi M, Glaser F, Gomez-Rodriguez EY, Gruber S,et al:Comparative genome sequence analysis underscores mycoparasitism as the ancestral life style of Trichoderma.Genome biology2011,12:R40.
6. Schuster A, Schmoll M:Biology and biotechnology of Trichoderma.Appl Microbiol Biotechnol2010,87:787–799.
7. Martinez D, Berka RM, Henrissat B, Saloheimo M, Arvas M, Baker SE, Chapman J, Chertkov O, Coutinho PM, Cullen D, Danchin EG, Grigoriev IV, Harris P, Jackson M, Kubicek CP, Han CS, Ho I, Larrondo LF, de Leon AL, Magnuson JK, Merino S, Misra M, Nelson B, Putnam N, Robbertse B, Salamov AA, Schmoll M, Terry A, Thayer N, Westerholm-Parvinen A,et al:Genome sequencing and analysis of the biomass-degrading fungus Trichoderma reesei (syn. Hypocrea jecorina).Nat Biotechnol2008,
26:553–560.
8. Saloheimo M, Nakari-Setala T, Tenkanen M, Penttila M:cDNA cloning of a Trichoderma reesei cellulase and demonstration of endoglucanase activity by expression in yeast.Eur J Biochem1997,249:584–591.
9. Hakkinen M, Arvas M, Oja M, Aro N, Penttila M, Saloheimo M, Pakula TM:
Re-annotation of the CAZy genes of Trichoderma reesei and
transcription in the presence of lignocellulosic substrates.Microb Cell Fact 2012,11:134.
10. Verbeke J, Coutinho P, Mathis H, Quenot A, Record E, Asther M, Heiss-Blanquet S:
Transcriptional profiling of cellulase and expansin-related genes in a hypercellulolytic Trichoderma reesei.Biotechnol Lett2009,31:1399–1405.
12. Kubicek CP, Messner R, Gruber F, Mach RL, Kubicek-Pranz EM:The Trichoderma cellulase regulatory puzzle: from the interior life of a secretory fungus.Enzyme Microb Technol1993,15:90–99.
13. Seiboth B, Hakola S, Mach RL, Suominen PL, Kubicek CP:Role of four major cellulases in triggering of cellulase gene expression by cellulose in Trichoderma reesei.J Bacteriol1997,179:5318–5320.
14. Foreman PK, Brown D, Dankmeyer L, Dean R, Diener S, Dunn-Coleman NS, Goedegebuur F, Houfek TD, England GJ, Kelley AS, Meerman HJ, Mitchell T, Mitchinson C, Olivares HA, Teunissen PJ, Yao J, Ward M:Transcriptional regulation of biomass-degrading enzymes in the filamentous fungus Trichoderma reesei.The Journal of biological chemistry2003,
278:31988–31997.
15. Schmoll M, Kubicek CP:Regulation of trichoderma cellulase formation: lessons in molecular biology from an industrial fungus.A review.
Acta Microbiol Immunol Hung2003,50:125–145.
16. El-Gogary S, Leite A, Crivellaro O, Eveleigh DE, El-Dorry H:Mechanism by which cellulose triggers cellobiohydrolase I gene expression in Trichoderma reesei.Proc Natl Acad Sci USA1989,86:6138–6141. 17. Nogawa M, Goto M, Okada H, Morikawa Y:L-Sorbose induces cellulase
gene transcription in the cellulolytic fungus Trichoderma reesei.
Curr Genet2001,38:329–334.
18. Chambergo FS, Bonaccorsi ED, Ferreira AJ, Ramos AS, Ferreira Junior JR, Abrahao-Neto J, Farah JP, Farah JP, El-Dorry H:Elucidation of the metabolic fate of glucose in the filamentous fungus Trichoderma reesei using expressed sequence tag (EST) analysis and cDNA microarrays.J Biol Chem 2002,277:13983–13988.
19. Kubicek CP:Systems biological approaches towards understanding cellulase production by Trichoderma reesei.J Biotechnol2013,163:133–142.
20. Kubicek CP, Mikus M, Schuster A, Schmoll M, Seiboth B:Metabolic engineering strategies for the improvement of cellulase production by Hypocrea jecorina.Biotechnol Biofuels2009,2:19.
21. Castro LD, Antonieto AC, Pedersoli WR, Silva-Rocha R, Persinoti GF, Silva RN:
Expression pattern of cellulolytic and xylanolytic genes regulated by transcriptional factors XYR1 and CRE1 are affected by carbon source in Trichoderma reesei.Gene Expr Patterns2014,14:88–95.
22. Bischof R, Fourtis L, Limbeck A, Gamauf C, Seiboth B, Kubicek CP:
Comparative analysis of the Trichoderma reesei transcriptome during growth on the cellulase inducing substrates wheat straw and lactose.
Biotechnol Biofuels2013,6:127.
23. Pao SS, Paulsen IT, Saier MH:Major facilitator superfamily.Microbiol Mol Biol R1998,62:1–34.
24. Boyce KJ, Andrianopoulos A:Morphogenetic circuitry regulating growth and development in the dimorphic pathogen Penicillium marneffei.
Eukaryot Cell2013,12:154–160.
25. Yao J, Bajjalieh SM:SVOP is a nucleotide binding protein.PLoS One2009,
4:e5315.
26. Wieczorke R, Krampe S, Weierstall T, Freidel K, Hollenberg CP, Boles E:
Concurrent knock-out of at least 20 transporter genes is required to block uptake of hexoses in Saccharomyces cerevisiae.FEBS Lett1999,
464:123–128.
27. Zhang W, Kou Y, Xu J, Cao Y, Zhao G, Shao J, Wang H, Wang Z, Bao X, Chen G, Liu W:Two major facilitator superfamily sugar transporters from trichoderma reesei and their roles in induction of cellulase biosynthesis.
J Biol Chem2013,288:32861–32872.
28. Ries L, Pullan ST, Delmas S, Malla S, Blythe MJ, Archer DB:Genome-wide transcriptional response of Trichoderma reesei to lignocellulose using RNA sequencing and comparison with Aspergillus niger.BMC Genomics 2013,14:541.
29. Ivanova C, Baath JA, Seiboth B, Kubicek CP:Systems analysis of lactose metabolism in Trichoderma reesei identifies a lactose permease that is essential for cellulase induction.PLoS One2013,8:e62631.
30. Du J, Li S, Zhao H:Discovery and characterization of novel d-xylose-specific transporters from Neurospora crassa and Pichia stipitis.Mol Biosyst2010,
6:2150–2156.
31. Sun J, Tian C, Diamond S, Glass NL:Deciphering transcriptional regulatory mechanisms associated with hemicellulose degradation in Neurospora crassa.Eukaryot Cell2012,11:482–493.
32. Glass NL, Palma-Guerrero J, Jonkers W, Leeder A, Hall C, Kowbel D, Taylor JW, Brem R:Revealing fungal communication modules by genomics, population genomics, and genome wide association studies in Neurospora crassa.
Phytopathology2013,103:186–187.
33. Mukherjee PK, Horwitz BA, Herrera-Estrella A, Schmoll M, Kenerley CM:
Trichoderma research in the genome era.Annu Rev Phytopathol2013,
51:105–129.
34. Furukawa T, Shida Y, Kitagami N, Mori K, Kato M, Kobayashi T, Okada H, Ogasawara W, Morikawa Y:Identification of specific binding sites for XYR1, a transcriptional activator of cellulolytic and xylanolytic genes in Trichoderma reesei.Fungal Genet Biol2009,46:564–574.
35. Strauss J, Mach RL, Zeilinger S, Hartler G, Stoffler G, Wolschek M, Kubicek CP:
Cre1, the carbon catabolite repressor protein from Trichoderma reesei.
FEBS Lett1995,376:103–107.
36. Portnoy T, Margeot A, Seidl-Seiboth V, Le Crom S, Ben Chaabane F, Linke R, Seiboth B, Kubicek CP:Differential regulation of the cellulase transcription factors XYR1, ACE2, and ACE1 in Trichoderma reesei strains producing high and low levels of cellulase.Eukaryot Cell2011,10:262–271.
37. Nitta M, Furukawa T, Shida Y, Mori K, Kuhara S, Morikawa Y, Ogasawara W:
A new Zn(II)(2)Cys(6)-type transcription factor BglR regulates beta-glucosidase expression in Trichoderma reesei.Fungal Genet Biol 2012,49:388–397.
38. Martinez-Antonio A, Collado-Vides J:Identifying global regulators in transcriptional regulatory networks in bacteria.Curr Opin Microbiol2003,
6:482–489.
39. Seiboth B, Karimi RA, Phatale PA, Linke R, Hartl L, Sauer DG, Smith KM, Baker SE, Freitag M, Kubicek CP:The putative protein methyltransferase LAE1 controls cellulase gene expression in Trichoderma reesei.Mol Microbiol2012,
84:1150–1164.
40. Karimi-Aghcheh R, Bok JW, Phatale PA, Smith KM, Baker SE, Lichius A, Omann M, Zeilinger S, Seiboth B, Rhee C, Keller NP, Freitag M, Kubicek CP:
Functional analyses of Trichoderma reesei LAE1 reveal conserved and contrasting roles of this regulator.G3 (Bethesda)2013,3:369–378. 41. Rossi A, Cruz AH, Santos RS, Silva PM, Silva EM, Mendes NS, Martinez-Rossi
NM:Ambient pH sensing in filamentous fungi: pitfalls in elucidating regulatory hierarchical signaling networks.IUBMB Life2013,65:930–935. 42. Li C, Yang Z, He Can Zhang R, Zhang D, Chen S, MA L:Effect of pH on
cellulase production and morphology of Trichoderma reesei and the application in cellulosic material hydrolysis.J Biotechnol2013,168:470–477. 43. Mach RL, Zeilinger S:Regulation of gene expression in industrial fungi:
Trichoderma.Appl Microbiol Biotechnol2003,60:515–522.
44. Gasch AP, Spellman PT, Kao CM, Carmel-Harel O, Eisen MB, Storz G, Botstein D, Brown PO:Genomic expression programs in the response of yeast cells to environmental changes.Mol Biol Cell2000,11:4241–4257. 45. Herpoel-Gimbert I, Margeot A, Dolla A, Jan G, Molle D, Lignon S, Mathis H,
Sigoillot JC, Monot F, Asther M:Comparative secretome analyses of two Trichoderma reesei RUT-C30 and CL847 hypersecretory strains.
Biotechnol Biofuels2008,1:18.
46. Jun H, Kieselbach T, Jonsson LJ:Enzyme production by filamentous fungi: analysis of the secretome of Trichoderma reesei grown on
unconventional carbon source.Microb Cell Fact2011,10:68.
47. Adav SS, Chao LT, Sze SK:Quantitative secretomic analysis of Trichoderma reesei strains reveals enzymatic composition for lignocellulosic biomass degradation.Mol Cell Proteomics2012,11:M111 012419.
48. Tisch D, Kubicek CP, Schmoll M:New insights into the mechanism of light modulated signaling by heterotrimeric G-proteins: ENVOY acts on gna1 and gna3 and adjusts cAMP levels in Trichoderma reesei (Hypocrea jecorina).Fungal Genet Biol2011,48:631–640.
49. Druzhinina IS, Shelest E, Kubicek CP:Novel traits of Trichoderma predicted through the analysis of its secretome.FEMS Microbiol Lett2012,337:1–9.
50. Zhou QX, Xu JT, Kou YB, Lv XX, Zhang X, Zhao GL, Zhang WX, Chen GJ, Liu WF:Differential involvement of beta-glucosidases from hypocrea jecorina in rapid induction of cellulase genes by cellulose and cellobiose.
Eukaryot Cell2012,11:1371–1381.
51. Znameroski EA, Coradetti ST, Roche CM, Tsai JC, Iavarone AT, Cate JHD, Glass NL:Induction of lignocellulose-degrading enzymes in Neurospora crassa by cellodextrins.Proc Natl Acad Sci USA2012,109:6012–6017. 52. Gielkens MM, Dekkers E, Visser J, de Graaff LH:Two cellobiohydrolase-encoding
genes from Aspergillus niger require D-xylose and the xylanolytic transcriptional activator XlnR for their expression.Appl Environ Microbiol 1999,65:4340–4345.
53. Schmoll M, Schuster A, Silva Rdo N, Kubicek CP:The G-alpha protein GNA3 of Hypocrea jecorina (Anamorph Trichoderma reesei) regulates cellulase gene expression in the presence of light.Eukaryot Cell2009,
54. Li H, Durbin R:Fast and accurate short read alignment with Burrows-Wheeler transform.Bioinformatics2009,25:1754–1760.
55. Li H, Handsaker B, Wysoker A, Fennell T, Ruan J, Homer N, Marth G, Abecasis G, Durbin R, Proc GPD:The sequence alignment/Map format and SAMtools.
Bioinformatics2009,25:2078–2079.
56. Thorvaldsdottir H, Robinson JT, Mesirov JP:Integrative genomics viewer (IGV): high-performance genomics data visualization and exploration.
Brief Bioinform2013,14:178–192.
57. Atanasova L, Jaklitsch WM, Komon-Zelazowska M, Kubicek CP, Druzhinina IS:
Clonal species Trichoderma parareesei sp. nov. likely resembles the ancestor of the cellulase producer Hypocrea jecorina/T. reesei.
Appl Environ Microbiol2010,76:7259–7267.
58. Anders S, Huber W:Differential expression analysis for sequence count data.Genome Biol2010,11:R106.
59. Vencio RZ, Koide T, Gomes SL, Pereira CA:BayGO: bayesian analysis of ontology term enrichment in microarray data.BMC Bioinformatics2006,7:86. 60. Shannon P, Markiel A, Ozier O, Baliga NS, Wang JT, Ramage D, Amin N,
Schwikowski B, Ideker T:Cytoscape: a software environment for integrated models of biomolecular interaction networks.Genome Res 2003,13:2498–2504.
61. Steiger MG, Mach RL, Mach-Aigner AR:An accurate normalization strategy for RT-qPCR in Hypocrea jecorina (Trichoderma reesei).J Biotechnol2010,
145:30–37.
62. Livak KJ, Schmittgen TD:Analysis of relative gene expression data using real-time quantitative PCR and the 2(T)(−Delta Delta C) method. Methods2001,25:402–408.
63. MacLean B, Eng JK, Beavis RC, McIntosh M:General framework for developing and evaluating database scoring algorithms using the TANDEM search engine.Bioinformatics2006,22:2830–2832.
64. Keller A, Nesvizhskii AI, Kolker E, Aebersold R:Empirical statistical model to estimate the accuracy of peptide identifications made by MS/MS and database search.Anal Chem2002,74:5383–5392.
65. Nesvizhskii AI, Keller A, Kolker E, Aebersold R:A statistical model for identifying proteins by tandem mass spectrometry.Anal Chem2003,
75:4646–4658.
doi:10.1186/1754-6834-7-41
Cite this article as:dos Santos Castroet al.:Comparative metabolism of cellulose, sophorose and glucose inTrichoderma reeseiusing high-throughput genomic and proteomic analyses.Biotechnology for Biofuels20147:41.
Submit your next manuscript to BioMed Central and take full advantage of:
• Convenient online submission
• Thorough peer review
• No space constraints or color figure charges
• Immediate publication on acceptance
• Inclusion in PubMed, CAS, Scopus and Google Scholar
• Research which is freely available for redistribution