Article
J. Braz. Chem. Soc., Vol. 26, No. 9, 1861-1870, 2015. Printed in Brazil - ©2015 Sociedade Brasileira de Química 0103 - 5053 $6.00+0.00
A
*e-mail: [email protected]
Synthesis and Characterization of Methylcellulose Produced from Bacterial
Cellulose under Heterogeneous Condition
Rafael L. Oliveira,*,a Júlia G. Vieira,b Hernane S. Barud,a Rosana M. N. Assunção,c
Guimes R. Filho,b Sidney J. L. Ribeiroa and Younes Messadeqqa
aInstituto de Química, Universidade Estadual Paulista “Júlio de Mesquita Filho” (UNESP),
14801-970 Araraquara-SP, Brazil
bInstituto de Química, Universidade Federal de Uberlândia, 38400-902 Uberlândia-MG, Brazil
cFaculdade de Ciências Integradas, Universidade Federal de Uberlândia,
38400-902 Ituiutaba-MG, Brazil
In this work, methylcellulose (MC) was produced from bacterial cellulose (BC), using dimethyl sulfate in a 3 h (MC3h) or 5 h (MC5h) reaction under heterogeneous conditions, with reagent substitution at each hour. MC3h showed a degree of substitution (DS) of 2.26 ± 0.13 and MC5h showed a DS of 2.33 ± 0.05. The two samples were characterized by Fourier transform infrared spectroscopy (FTIR), X-ray powder diffraction (XRD), differential thermal analysis (DTA), thermal gravimetric analysis (TGA), 13C nuclear magnetic ressonance (NMR) and 1H NMR
techniques. The FTIR spectra of the BC and MC samples present significant differences in the regions from 3750 to 2750 cm−1 and from 1500 to 750 cm−1, which evidence the methylation of
the samples. Solid state NMR spectroscopy of the MC samples was used to identify the 13C NMR
signals of substitution at sites C-2, C-3 or C-6 in the glucopyranose units. The modification of bacterial cellulose produced a material with a high DS, determined by three different techniques (chemically and using the liquid 1H and solid 13C NMR spectra). These samples also demonstrate
high crystallinity and thermal stability. With the MC samples synthesized in this work, transparent and resistant films were prepared and also a highly porous sponge like material.
Keywords: bacterial cellulose, cellulose derivatives, methylcellulose, FTIR, TGA/DTA, NMR spectroscopy
Introduction
Bacterial cellulose (BC) is a natural polymer obtained from the bacterium Gluconacetobacter xylinus. It possesses high crystallinity, purity (free from lignin and hemicelluloses), a large capacity for water absorption and excellent mechanical properties. Due to these properties and the fact that cellulose can be produced in commercial quantities, many researchers have investigated production, applications and the preparation of cellulose derivatives.
For the production of cellulose derivatives, few studies have been performed considering the reactivity and accessibility of the hydroxyl groups on the glucose units, since the high crystallinity (69-85%) and high degree of polymerization (1500-3000) of BC are two factors that could reduce accessibility. Recent studies have focused on
As far as the authors know, studies involving the preparation and characterization of methylcellulose using BC as a raw material have not been reported before. Methylcellulose (MC) is produced by etherification of cellulose obtained from lignocellulosic materials. This cellulose derivative shows commercial importance due to the application in the pharmaceutical, food, cosmetics, construction industries.7-9
During the synthesis of MC, cellulose and an etherificant agent, such as as methyl chloride, methyl iodine or dimethyl sulfate, are reacted in an alkali medium. In the industry, methylcellulose is produced in a heterogeneous media with methyl chloride.10 The Polymer Recycling Group produced methylcellulose in heterogeneous phase, alkaline medium, using dimethyl sulfate as the methylating agent. Cellulose from sugar cane bagasse, tegument mango core and newspaper was used as the starting material.11-13 Methylated derivatives showed high crystallinity, good thermal stability and degrees of substitution between 1.0 and 1.9. However, even in this degree of substitution (DS) range, derivatives showed low solubility in water.
Considering these aspects, in this work methylcellulose was produced from BC by a heterogeneous process and characterized by degree of substitution (DS), crystallinity and thermal analysis. Synthesis reactions for MC were performed for 3 and 5 h, with removal of excess reactants and the subsequent addition of fresh reagents every 1 h for the duration of the reaction.11,14
Experimental
Materials
BC membranes (4 mm thick, 99% water and 1% cellulose) were obtained from cultures of wild strain of
Gluconacetobacter xylinus isolated in our laboratory. Cultivation was conducted for 96 h at 28 °C in trays 30 × 50 cm, containing sterile medium composed of glucose 50 g L−1, yeast extracts 4 g L−1, anhydrous disodium phosphate 2 g L−1, heptahydrated magnesium, sulphate 0.8 g L−1 and ethanol 20 g L−1. BC membranes were washed with 1 wt.% aqueous NaOH at 70 °C in order to remove bacteria and washed in water until neutral pH. BC membranes were dried in order to obtain a paper-like material. Dried BC membranes were crushed and hydrolyzed using a 2.5 mol L−1 sulfuric acid solution for 2 h at room temperature. The hydrolyzed pulp was thoroughly washed with distilled water until it reached a pH of 7.0. It was then wetted with ethanol and dried in an oven at 37 °C until a constant weight was obtained.
Methylation of the bacterial cellulose
Bacterial cellulose (3.0 g) was mercerized using 60 mL NaOH solution (50% m/v) for 1 h at room temperature. The excess NaOH was removed by filtration and acetone (27.0 mL) was added as a solvent. Dimethyl sulfide (DMS) (9.0 mL) was added drop-wise and the reaction was carried out at 50 °C. After 1 h of reaction, the system was filtered and fresh reagents were added (acetone and DMS), maintaining the same previous proportions. The same procedure was repeated for 3 h (MC3h sample) and 5 h (MC5h sample) of total reaction time. At the end, the sample was neutralized using acetic acid (10% v/v), filtered, and washed with acetone (three times with 90 mL) and finally dried in an oven at 50 °C for 6 h. The synthesis process was adapted from Vieira et al.15 for MC 3h, and Vieira et al.14 for MC 5h, respectively.
Microscopic analysis
The morphology of the sponge obtained from de methylcellulose sample prepared in this work was investigated by scanning electron microscopy (SEM) using a JEOL JSM-7000F microscope.
Fourier transform infrared spectrophotometry (FTIR) analysis
A Shimadzu IRPrestige-21 Fourier transform infrared spectrophotometer (FTIR) was used to record the IR spectra of the dried powered samples (BC and MC). The samples were prepared using a mixture of the material with KBr at a proportion of 1:100 (m/m). For all spectra, twenty-eight scans were accumulated with a 4 cm−1 resolution. This technique was used to keep track of the modifications in the intensity of the characteristic bands of functional groups present before and after the methylation reaction of the BC.
X-ray diffraction (XDR)
XDR patterns were obtained with a Shimadzu Diffractometer XDR 6000 using Kα Cu radiation of 4° to 70° and a Ni filter. These diffraction patterns are intended to identify structural changes in the crystalline and amorphous phases after processing the cellulose in the derivative studied (MC). The separation of crystalline peaks from the amorphous halo was performed by deconvolution using the Pseudo-Voigt 2 function, described in equation 1:
(
)
(
)
( )2 2 4ln2
0 2 2
2 4 ln 2
1 4
c G
X X w L
u u
G c L
w
y y A m m e
w
x x w
π π
− −
= + + −
− − +
where WL and WG are the widths at half height for the components of the Gaussian and Lorentz equation, A is the area and mu is the form factor. The crystallinity index can be evaluated from equation 2:
( )
% C 100C
C A
A X
A A
= ×
+
(2)
with AC and AA being the areas of crystalline peaks and amorphous halo respectively.
Thermogravimetric analysis (TGA/DTA)
TGA curves were obtained in a Shimadzu DTG-60 using aluminum and alumina pans as reference. The experiments were carried out under continuous nitrogen flow of 70 mL min−1, and the temperature ramp was set at 10 °C min−1. A 10 mg sample was used and the weight loss was recorded from room temperature to 600 °C.
Differential scanning calorimetry (DSC) analyses
DSC analyses were carried out in TA Q-20 DSC instrument. Five milligrams of each sample in powered form were sealed in aluminum pans and heated at a ramp of 25 °C to 300 °C, under a nitrogen flow of 70 mL min−1, with a heating rate of 10 °C min−1.
Cross-polarization magic angle spinning carbon-13 nuclear
magnetic resonance (CP/MAS-13C NMR) measurements
CP/MAS 13C NMR measurements were conducted at room temperature on a VARIAN INOVA 300 spectrometer operating at 300 MHz under a static magnetic field of 7.4 T. Each sample, which was dried at 50 °C in vacuum before the NMR measurement, was packed into a 7 mm diameter zirconia rotor.
1H NMR spectroscopy
Methylcellulose samples were dissolved in D2O using the heating/cooling method for the 1H NMR measurements. These were performed on a Fourier 300 NMR spectrometer (B0 7.05T) equipped with a 5 mm dual probe (13C and 1H).
Determination of the degree of substitution (DS)
The determination of the DS oh the BC and MC samples were determined by three different methods (chemical reaction, CP/MAS 13C NMR and 1H NMR spectroscopy measurements).
The DS determined by a chemical reaction was described by Vieira et al.15 This method is based on the reaction between the sample and the iodidric acid to form methyl iodide. The DS determined by CP/MAS 13C NMR and 1H NMR spectroscopy was as describe by
Karrasch et al.16 and Sekiguchi et al.,17 respectively.
Preparation of methylcellulose aqueous solutions
MC solutions were prepared by a dispersion technique.18 Usually, aqueous solutions of MC samples are prepared in a concentration of 1-10% by weight.19 In this work, solutions at 2 wt.% were prepared by weight using the MC3h and MC5h samples. Initially, approximately half of the required volume of distilled water was heated to ca. 90 °C and the MC powder was added under stirring and thoroughly wetted. The remaining solvent (at room temperature) was added to the heated MC mixture and gently stirred. As the temperature was lowered, the polymer became water-soluble, forming a clear solution. Once the entire polymer solution was brought to room temperature, the solution was lightly stirred/agitated for a further 30 min and the solutions were allowed to equilibrate overnight at 4 °C in a refrigerator.
Results and Discussion
Methylation of bacterial cellulose
We performed in our laboratory preliminary studies of the MC synthesis using a BC with a high degree of polymerization (DP) [DP greater than 2900 anhydrous glucose units (AGU)], as a source of cellulose. Using the method described in this study samples were obtained with a very low DS, between 0.1 and 0.3. According to this preliminary result, we have chosen to reduce the DP of this CB sample. A methodology described by de Oliveira et al.,6 which the authors prepared microcrystalline cellulose (cellulose with lower DP) using sulfuric acid was adapted. Sulfuric acid 2.5 mol L−1 was used at room temperature for 120 min under constant stirring. Following acid hydrolysis, a cellulose sample with DP around 800 AGU was obtained, and with this sample another synthesis of MC was performed.
area, increasing the reaction efficiency.20 The results are described below.
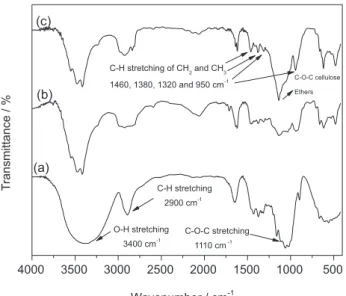
The MC produced from BC is a white purified fine uniform powder. The chemical modification and DS of MC were followed by FTIR, CP/MAS 13C NMR spectroscopy measurements, 1H NMR spectroscopy measurements and DS chemical determination. Figure 1 shows the infrared spectra for MC samples (MC3h e MC5h) and BC. The spectra were normalized by the 1110 cm−1 band, assigned to C−O−C stretching within an anhydroglucose ring.21
The main difference between MC and BC samples is the decrease in the intensity and change in the profile observed for the 3400 cm−1 band attributed to stretching of the O−H bond (hydroxyl groups) of cellulose, due to partial substitution of hydrogen groups during the methylation reaction.
Furthermore, an increase is observed for the bands around 2900 cm−1 assigned to the C−H stretching,14 due to the presence of the CH and CH2 groups of the cellulose and CH3 of theMC.
MC spectra usually present bands at 1460, 1380, 1320 and 950 cm−1 attributed to C−H stretching of CH
2 and CH3 groups, more easily identified in the spectrum of MC5h (Figure 1). The presence of an intense band around 1100 cm−1 (MC3h and MC5h) indicates the presence of C−O−C bonds, characteristic of cellulose ethers.4
The change in the profile of the band assigned to the stretching of the bond O−H and the region assigned to stretch C−H confirms the efficiency of the methylation process. The same profile was observed for MC produced from cellulose extracted from sugar cane bagasse, mango seed and newspaper.11-13
The techniques of CP/MAS 13C NMR, 1H NMR spectroscopy and chemical determination of DS were employed to confirm the changes observed and quantitatively assess the DS of cellulose derivatives produced.
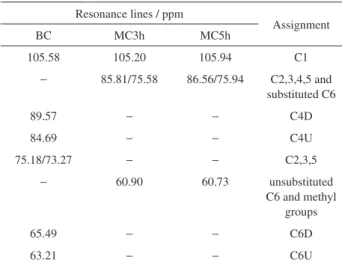
Figure 2 shows 300 MHz CP/MAS 13C NMR spectra for BC and methylcellulose samples. Resonance lines for bacterial cellulose are assigned to the C1, C4 and C6 carbons from the downfield side except for a cluster of resonances at 70-80 ppm which belong to the C2, C3 and C5 carbons.22 Furthermore, the downfield and upfield contributions of the C4 and C6 lines are referred to as C4D/C4U for carbon 4 and C6D/C6U for carbon 6, respectively. In contrast, the methylated samples have four resonance lines divided into three different spectral ranges (105, 85/75 and 60 ppm) which can be distinguished in the 13C NMR spectrum.16 The C1 carbon signals for MC samples appear in the same resonance line of cellulose at 105 ppm. Carbons C2, C3, C4 and C5 signals appears in the double peak region at 85 and 75 ppm. However, if C6 is substituted, these C6 resonances also fall into this spectral range. Finally, the signals of all unsubstituted C6 carbons and of all methyl groups, replaced in the methylation, compose the resonance line around 60 ppm. The resonance lines for hydrolyzed and methylcellulose samples are summarized in Table 1.
These resonance lines to methylcellulose samples are assigned according Karrasch et al.,16 and are another important confirmation of methylation of bacterial cellulose.
Figure 3 shows the one-dimensional 1H spectra of methylcellulose samples. From the 1H spectrum we can see
4000 3500 3000 2500 2000 1500 1000 500
C-O-C cellulose Ethers C-H stretching of CH2and CH3
1460, 1380, 1320 and 950 cm-1
C-O-C stretching 1110 cm-1
C-H stretching 2900 cm-1
(a) (b)
Wavenumber / cm-1
(c)
T
ransmittance / %
O-H stretching 3400 cm-1
Figure 1. FTIR spectra of bacterial cellulose (a) and methylcellulose samples MC3h (b) and MC5h (c).
120 110 100 90 80 70 60 50 40
BC MC3h
C4U C6D C6U C2,3,5
C4D
δ 13
C / ppm C1
MC5h
C1
C2,3,4,5 and
substituted C6
Unsubstituted C6 and
methyl groups
the presence of the two methyl resonances at approximately 3.30 and 3.48 ppm. We can also see the presence of the carbohydrate 1H resonances (other than the anomeric proton) between 2.9 and 3.8 ppm and we can also see the anomeric proton resonance at 4.35 ppm.
The signal number indicates the number of the proton position on the anhydroglucose unit in the figure (Figure 2); for example, if the proton is located at carbon 1 it will be named H1. The proton signals of methyl groups at 2, 3 and 6 position are labeled as 2, 3 and 6Me. The signals due to 2 and 3Me were not distinguishable from each other in the spectra. The proton signals of the unsubstituted hydroxyl
groups at 2, 3 and 6 position do not appear when D2O is used as solvent. This is due to deuteration of three hydroxyl groups (2, 3 and 6OH) into OD. In D2O, the proton signal directly attached to carbon 2 (Figure 2) to which methoxyl groups were labeled H2(2OMe) appeared as a doublet.
The modification of bacterial cellulose was evidenced by all the techniques employed and the results indicate the production of a cellulose derivative with a high degree of substitution, according to the spectra profile, and almost the same value DS in the methylated sample after 3 and 5 h reaction time.
This was confirmed by determining the value of DS by spectroscopy techniques (CP/MAS 13C NMR and 1H NMR) and through chemical reactions
The value of chemical DS of the samples MC3h and MC5h were 2.26 ± 0.13 and 2.33 ± 0.05 respectively.
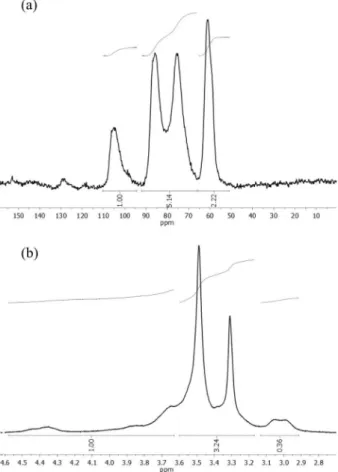
For the calculation of DS by 13C NMR CP/MAS, the procedure described by Karrasch et al.16 was used. Three spectral ranges were identified in the solid NMR 13C spectra presented in Figure 4a, named A1, A2 and A3. All C1 carbon signals appear exclusively in the spectral range A1, emphasizing that the area of the signal must be considered and not just the intensity (peak height). Contrarily, C2, C3, C4 and C5 signals contribute to A2. However, if C6 is substituted, these C6 resonances also fall into the A2 spectral range. Finally, the signals of all unsubstituted C6 carbons and of all methyl groups (substituents) compose the line shape of A3. After these considerations, and bearing in mind that the value of A1 must be normalized to the unity value (A1 = 1.0), Karrasch et al.16 has shown that DS = A3 + A2 − 5. Using this method, the sample prepared using the 3 h reaction, MC3h, showed a DS of 2.36, and the sample prepared using 5 h reaction, MC5h, showed a DS of 2.60. Figure 4a displays the 13C NMR spectrum of the methylated cellulose sample MC3h with the values of the A1, A2 and A3 areas.
In accordance with these values, GS (MC3h) = 2.22 + 5.14 − 5.00 = 2.36, as mentioned above. Remember, that A1 must be normalized to unity prior to the determination of A2 and A3.
Another method used in this work do determinate the DS values for the methylcellulose samples was 1H NMR. This method was described by Sekiguchi et al.,17 which presents a detailed description. Therefore, the DS of the MC samples can be calculated by the following equations 3 and 4:
[ ]
(
1 6)
3
H H
H = + (3)
(
)
(
[ ]
)
[ ]
(
)
4 2 3 6 5 3 2 4
3
H Me Me Me H H H x H DS
x H
+ + + + + + −
= (4)
Table 1. CP/MAS 13C NMR resonance lines and respective assignments of the HBC and MC samples
Resonance lines / ppm
Assignment
BC MC3h MC5h
105.58 105.20 105.94 C1
− 85.81/75.58 86.56/75.94 C2,3,4,5 and
substituted C6
89.57 − − C4D
84.69 − − C4U
75.18/73.27 − − C2,3,5
− 60.90 60.73 unsubstituted
C6 and methyl groups
65.49 − − C6D
63.21 − − C6U
BC: bacterial cellulose; methylcellulose (MC) was produced from BC, using dimethyl sulfate in a 3 h (MC3h) or 5 h (MC5h) reaction under heterogeneous conditions.
4.4 4.2 4.0 3.8 3.6 3.4 3.2 3.0 2.8
H4 H6
MC5h
δ/ ppm
MC3h
H1
2Me 3Me
6Me
H3 H5
H2 (2OMe)
Figure 3.1H NMR (300 MHz, D
where [H] stands for the intensity of a single proton of each anhydroglucose unit. Using this method, the sample prepared using 3 h reaction, MC3h, showed a DS of 2.28, and the sample prepared using 5 h reaction, MC5h, showed a DS of 2.32. Figure 4b displays the 1H NMR spectrum of the methylated cellulose sample MC3h with the values of the normalized areas used in the calculations. In accordance with these values, GS (MC3h) = [(3.24 + 0.36) − (4 × 1.00/3.00)]/ (3.00 × 1.00/3.00) = 2.28, as mentioned above.
The results of all data obtained during the calculation of the DS are summarized in Table 2.
According to these results, we can observe that the degree of substitution obtained by chemical reactions, as well as by 1H NMR spectra are very similar. This demonstrates the convenience of this method for the calculation of DS. The DS obtained by 13C NMR technique proved to be an accurate technique for obtaining a quick estimate of the DS.
DS values obtained for all the investigated techniques are almost the same for both MC3h and MC5h samples. This
result is different from that found by Rodrigues Filho et al.,11 and Vieira et al.,14 for methylation of cellulose from sugar cane bagasse, in which, MC produced for three (3 h),11 and five (5 h) hours of reaction,14 with the same conditions used in this work, presented a DS of 1.40 ± 0.07 and 1.89 ± 0.04 respectively. The methylation of bacterial cellulose under the same conditions led to an increase in the degree of substitution of 66 and 33%, respectively, compared methylcellulose produced from sugar cane bagasse cellulose. These results also show that there is no need for a reaction time of 5 h of to achieve a high DS, since the difference in the DS between the 3 h and 5 h reaction time is approximately 3%.
The increase in the value of DS for the methylation reaction occurring for 3 h is due to the high degree of purity of the bacterial cellulose, as well as the absence of hemicellulose and lignin, compared to sugar cane bagasse cellulose used in previous works.11
Characterization of methylcellulose from BC
XDR patterns for BC and MC samples (MC3h and MC5h) are shown in Figure 5. The observed diffraction peaks for both materials can be attributed to crystalline
Table 2. DS of methylcellulose samples calculated from three different methods
Sample Total DS
Chemical DS 13C NMR 1H NMR
MC3h 2.26 ± 0.13 2.36 2.28
MC5h 2.33 ± 0.05 2.49 2.31
DS: degree of substitution.
Figure 4. (a) 13C NMR (300 MHz, D
2O) spectrum of methylated cellulose sample MC3h showing the three signal ranges (A1 to A3). A1: C1signals only, A2: C2, C3, C4, C5 and C6 (if substituted at this site) signals, A3: non-substituted C6 and methyl carbon resonances; (b) 1H NMR (300 MHz, D2O) spectrum of methylated cellulose sample MC3h.
10 20 30 40
16.9
20.5 8.2
8.5
20.6
MC5h BC
Intensity / cps
2θ/ degree
MC3h
22.8
14.7
scattering and the diffuse background to disordered regions. The methylcellulose samples are semicrystalline as bacterial cellulose.
BC showed main diffraction peaks at the 14.7°, 16.9° and 22.8° 2θ angles, which are attributed to the interplanar distance characteristic of the phases Iα and Iβ of the elementary cellulose crystalline structure (100Iα, 110Iβ and 010Iβ refer to the angle 15° and 110Iα and 200Iβ to 22.5°).23 The spectrum corresponding to methylcellulose samples showed maximum diffraction peaks at the 8.5° and 20.6° 2θ angles for MC3h sample and 8.2° and 20.5° 2θ angles for MC5h sample. Comparing the XRD patterns of MC and BC one observes that the peak around 8° is not present in the diffractograms of cellulose, which according Rodrigues Filho et al.,11 is an evidence of cellulose modification. The position of this peak (8°) indicates an increase in the inter-planar distance compared to the original cellulose diffractograms, due to generation of disorder when cellulose is modified. The projection of the substituting groups along the axis (methyl groups) is associated with an increase in the interfibrillar distance. The maximum, around 20°, presents in the all MC samples is known as van der Waals halo, which appears for all polymers and corresponds to the polymeric chain packing due to the van der Walls forces.24 Whereas the maximum around 10°, which is known as halo of low van der Walls, which occurs for some amorphous polymers due to the existence of regions with aggregates of segments of parallel chains.24
The patterns for both materials (MC3h and MC5h) are very similar. Both the MC3h and MC5h present approximately the same value of crystallinity index. Through XRD diffraction, the crystalline index can be quantified by deconvolution using the Pseudo-Voigt 2 function, as mentioned earlier. Considering this method, MC3h and MC5h presented 71 and 68% of crystallinity, respectively, whereas the bacterial cellulose had a value of 85%. These small decreases in the crystallinity of methylcellulose samples, compared with BC, is due to mercerization performed in the methylation process. Mercerization promotes an expansion of the cellulosic fibers, increasing the portion of less ordered material and reducing the crystalline portion.
These crystallinity index were the highest found in the literature for MC samples synthesized from alternative sources of cellulose. For the MC prepared from sugar cane bagasse and mango seed, crystallinities were between 61 and 52%, respectively.11,12 These results showed that were obtained MC samples with higher DS, crystallinity, and better dispersion in water when compared to the cited papers.
The mercerization steps as methylation can lead to hydrolysis of cellulose and reduce its thermal stability.
Furthermore, the chemical modification of cellulose leads to significant structural changes which impact on the thermal properties of the produced cellulose derivative. DSC and TGA tests were performed to evaluate the thermal properties and thermal stability of the methylcellulose.
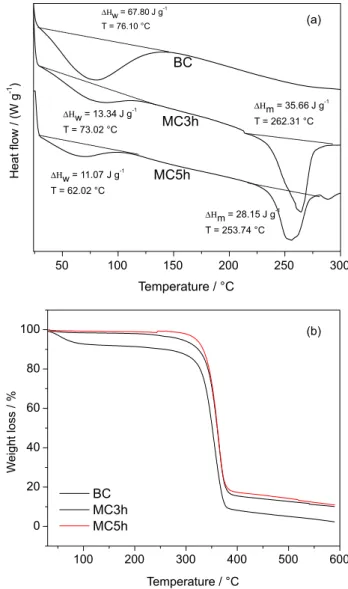
Figure 6a presents DSC thermograms. These thermograms show an endothermic event ranging from 30.00 to 135.00 °C for all samples, attributed to dehydration of surface water. This occurrence is typical for cellulosic materials, due to interaction between water and nonsubstituted hydroxyl groups. For BC sample, the water loss temperature is 76.10 °C and the enthalpy is 67.80 J g−1, indicating that interaction is more intense compared to MC samples, where the water loss temperature observed for MC3h and MC5h are 73.02 and 62.02 °C, and the enthalpy are 13.34 and 11.07 J g−1 respectively. These results confirm the higher DS obtained for MC samples, since the higher DS, will lower the amount of hydroxyl groups interacting with water.
An endothermic event is observed at around 250 °C for the MC samples that can be attributed to melting of the crystalline regions of methylcellulose,11,13 since that methylcellulose decomposition occurs in a single step from 220.0 to 410.0 °C, as discussed below in TG curves.25 When compared with the MC samples, the nonmodified cellulose degrades before melting; it is another confirmation of the chemical modification of cellulose. It is noteworthy that the values of the enthalpy of fusion (35.66 for MC3h and 28.15 J g−1 for MC5h) are the highest ever registered when produced from alternatives sources.11,13-15 This difference between enthalpy and water loss temperature for MC samples (3 h and 5 h) corroborates the DS values presented previously.
Figure 6b shows the weight loss curves (TG) of the BC, MC3h and MC5h samples. The stages shown in the TG curves generally involve dehydration (25-100 °C), depolymerisation and pyrolytic decomposition (220-415 °C) and at high temperatures, this decomposition results in the formation of H2O, CO and CH4.
The first minor weight loss observed for all samples is attributed to desorption of water from the polysaccharide structure. MC samples showed a smaller weight loss than hydrolyzed cellulose sample in this stage. The loss of mass was 8% for BC, 2% for MC3h and 1% for MC5h, indicating that a smaller amount of water is absorbed to the MC samples compared to the unmodified cellulose. Once again, this difference can be explained as a function of the substitution of hydroxyl groups by methoxyl groups, during the synthesis of MC samples, reducing the number of hydroxyls available to interact with water molecules.
The comparison of thermogravimetric curves for samples of methylcellulose and BC shows a small displacement of the curves to higher temperatures compared to the TG curve of BC. This aspect shows that the thermal stability of methylcellulose is equal to or higher than that observed for BC. This demonstrates that the process employed leads to a production of methylcellulose with a high DS and without significantly altering the thermal stability of the resulting derivative. All samples showed degradation temperatures around 350 °C. The presence of the endothermic event around 250 °C in the DSC thermograms of MC samples in addition to a weight loss at the same temperature region in the TGA curve, lead to the conclusion that melting followed by degradation must occur. The main weight loss is observed above 300 °C.
Solubility test
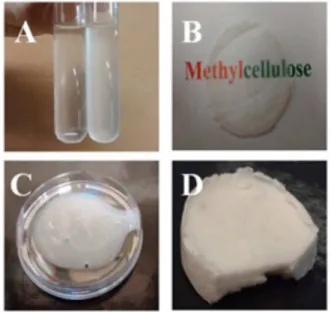
Figure 7A shows the MC solutions following the procedure described in Preparation of methylcellulose
aqueous solutions (left tube) and a solubilized sample at room temperature (right tube). At this stage the sample had not yet been placed at 4 °C overnight. As might be expected, the sample which was heated to 90 °C and then cooled to room temperature showed a higher solubility, as may be observed by the clear solution when compared to the left test tube. After the MC samples were placed overnight at 4 °C both (MC3h and MC5h) showed two phases: a clear solution of low viscosity and an off white solution with a high viscosity (hydrogel), which is shown in Figure 7C. The formation of this MC hydrogel in water is caused by hydrophobic interactions between molecules containing methoxyl groups. At low temperatures, the cellulose molecules are hydrated and there is little polymer-polymer interaction apart from entanglement.26 As the temperature is increased, molecules absorb translational energy and gradually lose their water of hydration, resulting in lowering of viscosity.19,27 Eventually, a polymer-polymer association takes place, due to hydrophobic interactions, causing cloudiness in solution and an infinite network structure which results in a sharp rise in viscosity and turbidity as long as the concentration is relatively high.27 These cellulose derivatives hydrogels have many applications due to their biodegradability, low cost and the large availability and biocompatibility. Some of the possible applications are superabsorbents for personal hygiene products, water reservoirs in agriculture, body water retainers, stomach bulking agents, devices for controlled drug delivery, scaffolds for regenerative medicine and others.28
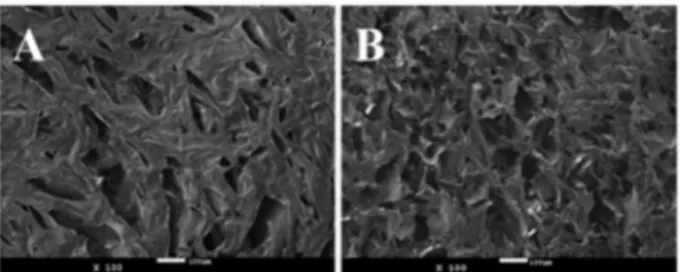
In order to examine the processability of this hydrogel for the preparation of a highly porous 3D matrix material,
the highly viscous liquid was frozen using liquid nitrogen and subsequently dried using a lyophilizer (Liotop L101) for 24 h. Figure 7D shows the highly porous material obtained and Figure 8 shows the SEM images from the surface (A) and cross-section (B) of the 3D highly porous material. The size of these pores varies from 20 to 140 microns.
Figure 7B showed a transparent and resistant film formed when the clear solution (mentioned earlier) is dried in an oven at 37 °C for 24 h. The MC film prepared with is optically transparent for the UV-Vis range greater than 65% (UV-visible not shown here).
The solubilization (clear solution + hydrogel) allow us to infer that the MC obtained in these conditions presented different molecular weights (MW) and DS, being the hydrogel sample with larger values of MW and DS. The solutions were prepared at a concentration of 2% (m/m), with 30% of this mass was present in the low viscosity solution (film) and 70% in the high viscosity solution (porous material).
As the aim of this study concerned the preparation of the cellulose derivative methylcellulose, a thorough study of potential applications will be discussed in a future that is already underway.
Conclusions
In this study, we reported the viability of producing methylcellulose from the bacterial cellulose using DMS as an alkylating agent in heterogeneous conditions. The results show that the methylcellulose produced in this work presented with a higher degree of substitution, higher crystallinity and improved thermal stability in relation to unmodified bacterial cellulose.
The preparation of aqueous solutions of methylcellulose at low temperatures generates a two phase system: a low viscosity solution and a gel (hydrogel). The observed phase separation is related to two aspects: a fractionation of the MC with respect to the size of the chains and the heterogeneous distribution of methoxyl groups in the chains, which leads
to differences in the hydrophobicity and solubility. From the solution phase is possible to form transparent films and from the gel phase is possible to prepare 3D highly porous material with many potential applications.
Acknowledgements
The financial support of the Brazilian agencies CAPES, CNPq, FAPESP and FAPEMIG are gratefully acknowledged. FEG-SEM facilities were provided by LMA-IQ. English proofreading was performed by Michael Floros from Trent University, Ontario, Canada.
References
1. Kim, D. Y.; Nishiyama, Y.; Kuga, S.; Cellulose2002, 9, 361. 2. Keshk, S. M.; J. Bioprocess. Biotech.2014, 4, 10.
3. Barud, H. S.; de Araujo Junior, A. M.; Santos, D. B.; de Assuncao, R. M. N.; Meireles, C. S.; Cerqueira, D. A.; Rodrigues Filho, G.; Ribeiro, C. A.; Messaddeq, Y.; Ribeiro, S. J. L.; Thermochim. Acta2008, 471, 61.
4. Schlufter, K.; Heinze, T.; Macromol. Symp.2010, 294-II, 117. 5. Chen, P.; Cho, S. Y.; Jin, H.-J.; Macromol. Res.2010, 18, 309. 6. de Oliveira, R. L.; Barud, H. S.; de Assuncao, R. M. N.;
Meireles, C. S.; Carvalho, G. O.; Rodrigues Filho, G.; Messaddeq, Y.; Lima Ribeiro, S. J.; J. Therm. Anal. Calorim.
2011, 106, 703.
7. Jonas, R.; Farah, L. F.; Polym. Degrad. Stab.1998, 59, 101. 8. Costa, S. M.; Mazzola, P. G.; Silva, J. C. A. R.; Pahl, R.;
Pessoa Jr., A.; Costa, S. A.; Ind. Crops Prod.2013, 42, 189. 9. Abeer, M. M.; Amin, M. C. I. M.; Martin, C.; J. Pharm.
Pharmacol.2014, 66, 1047.
10. Brandt, L.; Cellulose Ethers, Wiley: New York, 2001. 11. Rodrigues Filho, G.; de Assuncao, R. M. N.; Vieira, J. G.;
Meireles, C. S.; Cerqueira, D. A.; da Silva Barud, H.; Ribeiro, S. J. L.; Messaddeq, Y.; Polym. Degrad. Stab.2007, 92, 205. 12. Cruz, S. F.; Vieira, J. G.; Filho, G. R.; Meireles, C. S.; Faria, F.
A. C.; Gomide, D. D.; Pasquini, D.; Assunção, R. M. N.; Motta, L. A. C.; Polim.: Cienc. Tecnol.2007, 22, 01.
13. Oliveira, G. C.; Rodrigues Filho, G.; Vieira, J. G.; Nascimento de Assuncao, R. M.; Meireles, C. S.; Cerqueira, D. A.; de Oliveira, R. J.; Silva, W. G.; de Castro Motta, L. A.; J. Appl. Polym. Sci.
2010, 118, 1380.
14. Vieira, J. G.; Oliveira, G. D.; Rodrigues, G.; de Assuncao, R. M. N.; Meireles, C. D.; Cerqueira, D. A.; Silva, W. G.; Motta, L. A. D.; Carbohydr. Polym.2009, 78, 779.
15. Viera, R. G. P.; Rodrigues Filho, G.; de Assuncao, R. M. N.; Meireles, C. S.; Vieira, J. G.; de Oliveira, G. S.; Carbohydr. Polym.2007, 67, 182.
16. Karrasch, A.; Jaeger, C.; Saake, B.; Potthast, A.; Rosenau, T.;
Cellulose2009, 16, 1159.
17. Sekiguchi, Y.; Sawatari, C.; Kondo, J.; Polym. Bull.2002, 47, 547.
18. Thirumala, S.; Gimble, M. J.; Devireddy, V. R.; Cells2013, 3, 16.
19. Sarkar, N.; J. Appl. Polym. Sci.1979, 24, 1073.
20. Zugenmaier, P.; Crystalline Cellulose and Derivatives: Characterization and Structures; Springer: Heidelberg, 2008. 21. Sekiguchi, Y.; Sawatari, C.; Kondo, T.; Carbohydr. Polym.2003,
53, 145.
22. Nunes, T.; Burrows, H. D.; Bastos, M.; Feio, G.; Gil, M. H.;
Polymer1995, 36, 479.
23. Gralén, N.; Journal of Polymer Science1955, 18, 443.
24. Rodrigues, G.; da Cruz, S. F.; Pasquini, D.; Cerqueira, D. A.; Prado, V. D.; de Assuncao, R. M. N.; J. Membr. Sci.2000, 177, 225.
25. Zohuriaan, M. J.; Shokrolahi, F.; Polym. Test.2004, 23, 575. 26. Ford, J. L.; Int. J. Pharm.1999, 179, 209.
27. Sarkar, N.; Walker, L. C.; Carbohydr. Polym.1995, 27, 177. 28. Sannino, A.; Demitri, C.; Madaghiele, M.; Materials2009, 2,
353.
Submitted: November 25, 2014 Published online: July 3, 2015