i
GFS – Official Statistics in the European Union
Maria Raquel de Almeida Dias
Exploring deficit and debt figures among the EU MS to
identify events likely to foster deviant behaviour
Dissertation presented as partial requirement for obtaining
the Master’s degree in Statistics and Information
i
NOVA Information Management School
Instituto Superior de Estatística e Gestão de Informação
Universidade Nova de Lisboa
GFS – OFFICIAL STATISTICS IN THE EUROPEAN UNION
Exploring deficit and debt figure among the EU MS to identify
events likely to foster deviant behaviour
by
Maria Raquel de Almeida Dias
Dissertation presented as partial requirement for obtaining the Master’s degree in Information Management, with a specialization in Information Analysis and Management
Advisor: Jorge M. Mendes, PhD
ii
DEDICATION
Dedico esta dissertação, em primeiro lugar à minha família: aos meus pais e à minha irmã um muito obrigado, por, como sempre, me apoiarem e acreditarem nas minhas capacidades.
iii
AKNOWLEDGMENTS
Firstly, I would like to express my sincere gratitude to my advisor Professor Jorge Morais Mendes, for his support and help in overtaking the obstacles and difficulties I faced.
This master thesis together with my interest in Government Finance Statistics started while working for the European Commission. I would like to thank all my colleagues in Eurostat working on GFS matters with who I had several fruitful discussions along the years, in particular:
• To Mrs. Laura Wahrig: for all the unconditional support over the years, for sharing your expertise and motivating me to discover more and more about GFS.
• To Mr. Philippe de Rougemont: for all your dedication and inexhaustible knowledge on GFS matters, and for your capacity and generosity in share it with me.
• To all my colleagues and friends on the Eurostat´s GFS Team: your support and motivation were essential on this journey.
iv
ABSTRACT
Article 104 of the Treaty on the European Community establishes that Member States shall avoid excessive government deficits and that the European Commission should monitor the development of the budgetary situation and of the stock of government debt in the MS.
For this effect, the 28 MS of the European Union are obliged to report biannually (in March and September) the detailed deficit and debt for the four reporting years.
The deficit and the debt figures are of utmost importance for the correct functioning and control of the economy and therefore essential for the international organizations to monitor the economic developments in the different countries around the world: In the European Union, to avoid an excessive deficit, the EU Member-States should keep their deficit below 3 per cent of its Gross Domestic Product (GDP). Considering the following, data harmonization is crucial to ensure comparability of these figures among different countries and to guarantee it´s reliability.
As the EC (through Eurostat) does not compile the deficit and debt figures but relies on data compiled and reported by the statistical authorities in the MS, this work aims to provide a qualitative and quantitative analysis of the quality of the data disseminated by Eurostat. As most of the macroeconomic aggregates, also the deficit and the debt are subject to revisions. These will be analysed to assess whether the governments of the different European MS attempt to manipulate these figures, for example, using residual amounts like the Stock-Flow-Adjustment.
Data published in the Eurostat website through the Excessive Deficit Procedure Tables was evaluated from 2002 together with the Excessive Deficit Procedure inventories.
KEYWORDS
Debt; Deficit; Excessive Deficit Procedure; Government Finance Statistics; Stock Flow Adjustment; Data harmonization;
v
INDEX
1.
Introduction ... 1
1.1
Study relevance ... 2
1.2
Problem Identification and study objectives... 3
1.3
Methodology ... 4
2.
Theoretical framework ... 6
2.1
Methodological guidance impacting the EDP statistics ... 14
2.2
EDP data transmission and validation process... 15
2.2.1
EDP tables and data quality checks ... 16
2.2.2
EDP and GFS – data comparability ... 19
2.2.3
Data publication ... 21
3.
Data analysis ... 23
3.1
Data Description ... 23
3.1.1
Government Deficit to GDP Ratio ... 24
3.1.2
Maastricht debt ... 36
3.1.3
The relation between the net lending/net borrowing and the change in
Maastricht debt: The Stock Flow Adjustment ... 42
3.2
Partial Least Squares Regression ... 55
3.2.1
Variables ... 55
3.2.2
Results ... 59
4.
Conclusions and limitations ... 64
5.
Bibliography ... 69
6.
Annexes ... 72
vi
LIST OF TABLES
Table 2.1 - comparison between GFS and EDP datasets ... 20
Table 3.1 - B.9/GDP, all MS, all transmissions ... 24
Table 3.2 - B.9/GDP, statistical description, all transmissions, per MS ... 26
Table 3.3 - B.9/GDP revisions, statistical description, aggregated revisions' lags ... 30
Table 3.4 - B.9/GDP revisions, statistical description, per MS, all revisions’ lags ... 32
Table 3.5 - Clustering B.9/GDP revisions, statistical description ... 33
Table 3.6 - B.9/GDP revisions, number of outliers, transmission of October 2014, per MS ... 36
Table 3.7 - Debt/GDP distribution, all transmissions, all MS ... 36
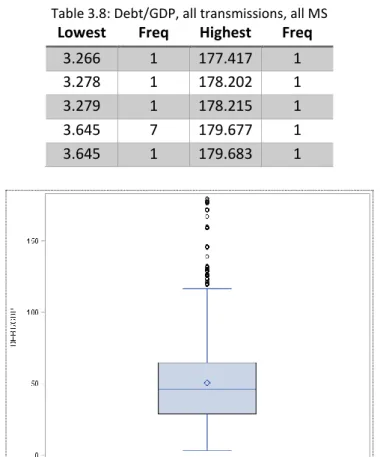
Table 3.8 - Debt/GDP, all transmissions, all MS ... 37
Table 3.9 - Debt/GDP revisions, difference between metholodogies, all transmissions, per MS
... 42
Table 3.10 - SFA, statistical description, all transmissions, per MS ... 43
Table 3.11 - SFA components, statistical description, all transmissions, all MS ... 46
Table 3.12 - SFA revisions, all transmissions, all MS, per revision’s lag ... 54
Table 3.13 - Dependent variables ... 55
Table 3.14 - Independent variables ... 57
Table 3.15 - Significance of events ... 59
Table 3.16 - PLSR, events represented in the latent variables ... 60
Table 3.17 - PLSR, events represented in the latent variables ... 62
Table 4.1 - Revisions on deficit and debt, minimum and maximum... 64
vii
LIST OF FIGURES
Figure 1.1: Statistical cooperation in the EU ... 1
Figure 2.1: From deficit to debt ... 8
Figure 2.2:GFS presentation ... 20
Figure 2.3: Decomposition of Total revenue ... 20
Figure 2.4: Decomposition of Total expenditure ... 20
Figure 3.1: B.9/GDP, all transmissions, all MS ... 25
Figure 3.2: B.9/GDP, Inter-quartiles distribution, all transmissions, all MS ... 25
Figure 3.3: B.9/GDP, all transmissions, per MS – comparison with EU-28 ... 27
Figure 3.4: B.9/GDP revisions, distributions, all transmissions, all MS, all revisions’ lags
(excluding the absence of revisions: rev=0) ... 28
Figure 3.5: B.9/GDP revisions, description, all transmissions, all MS, per revision´s lag ... 29
Figure 3.6: B.9/GDP revisions, per revision’s lag,1
st-7
threvision’s lag, non-cumulative bar
chart ... 30
Figure 3.7: B.9/GDP revisions, per revision’s lag (1
st,2
nd,3
rdand 8
th), non-cumulative bar chart
... 30
Figure 3.8: B.9/GDP revisions, all transmissions, all MS, per revision’s lag, 1
st- 7
threvision´s
(excluding the absence of revisions: rev=0), absolute frequency ... 31
Figure 3.9: B.9/GDP revisions, all transmissions, all MS, per revision’s lag, 1
st- 7
threvision´s
lag (excluding the absence of revisions: rev=0), percentage of total ... 31
Figure 3.10: B.9/GDP revisions, all transmissions, per MS, minimum and maximum ... 32
Figure 3.11: B.9/GDP revisions, nº of outlier, all transmissions, all MS, 1
st-7
threvision’s lag . 34
Figure 3.12: B.9/GDP revisions, mean (of the mean), different methodologies 1st, 3rd, 5th
and 7th revisions ... 35
Figure 3.13: Debt/GDP, Inter-quartiles distribution, all transmissions, all MS ... 37
Figure 3.14: Debt/GDP, all transmissions, all MS ... 37
Figure 3.15: Debt/GDP, all transmissions, vis-à-vis EU-28, per MS ... 38
Figure 3.16: Debt/GDP revisions, all transmissions (excluding the absence of revisions:
rev=0), all MS, 1
stto 21
strevision’s lag ... 39
Figure 3.17: Debt/GDP revisions, description, all transmissions, all MS, per revision´s lag .... 39
Figure 3.18: Debt/GDP revisions distribution, per MS, all transmissions ... 40
Figure 3.19: Debt/GDP revisions distribution, per revisions’ lag, all transmissions ... 40
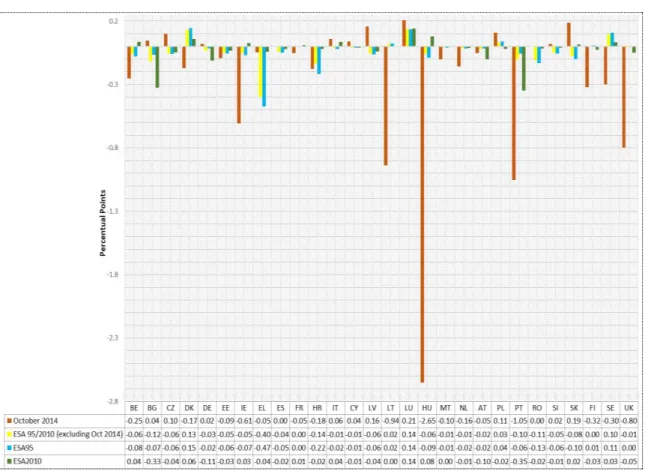
Figure 3.20: Debt/GDP revisions, different methodologies, all transmissions, all MS ... 41
Figure 3.21: SFA, all transmissions, all MS (excluding the absence of revisions: rev=0) ... 43
Figure 3.22: Government deficit (reversed sign), change in Maastricht debt, and stock-flow
adjustment, % of GDP: 2002-2015 mean, all transmissions ... 44
viii
Figure 3.23: SFA components, all transmissions, all MS, non-cumulative bars chart ... 45
Figure 3.24: Mean of SFA components, all transmissions, per MS ... 47
Figure 3.25: Median of the SFA composition over the 2003-2005, EU-28 ... 48
Figure 3.26: FA components, inter-quartiles distribution, all transmissions, all MS ... 48
Figure 3.27: Mean FA components, all transmission, all MS ... 51
Figure 3.28: ADJ components, inter-quartiles distribution, all transmissions, all MS ... 52
Figure 3.29: Mean ADJ components, all transmission, all MS ... 53
Figure 3.30: SFA revisions, all transmissions, all MS (excluding the absence of revisions:
rev=0) ... 53
Figure 3.31: SFA components’ revisions, inter-quartiles distribution, all transmissions, all MS
... 54
Figure 3.32: SFA components’ revisions, mean, all MS, all transmissions, per SFA component
... 55
ix
LIST OF ABBREVIATIONS AND ACRONYMS
ADJ Debt-adjustment effects
AT Austria
BE Belgium
BG Bulgaria
BoP Balance of Payments
B.9 Net lending/net borrowing as defined in ESA 2010
CMFB Committee on Monetary, Financial and Balance of Payments Statistics
CY Cyprus
CZ Czech-Republic
D.41_A Difference between interest accrued (-) and interest paid (+) DDA Deficit-Debt Adjustment
DE Germany
DG Directorate General
DK Denmark
EA Euro Area
EC European Commission ECB European Central Bank
ECFIN Directorate General for Economic and Financial Affairs ECOFIN Economic and Financial Affairs Council
EDP Excessive Deficit Procedure
EDPS WG Excessive Deficit Procedure Working Group
EE Estonia
EFTA European Free Trade Association
EL Greece
EMU Economic and Monetary Union
x ESA European System of National and Regional Accounts
ESCB European System of Central Banks ESCP European Statistics Code of Practice ESS European Statistical System
ESSC European Statistical System Committee
ESM European Stability Mechanism EU European Union
F.1 Monetary gold and special drawing rights F.11 Monetary gold
F.12 Special drawing rights F.2 Currency and Deposits F.3 Debt Securities
F.4 Loans
F.5 Equity and investment fund shares/units
F.6 Insurance, pension and standardised guarantee schemes F.71 Financial Derivatives
F.8 Other accounts receivable FA Net acquisition of financial assets
FI Finland
FR France
FRA Forward Rate Agreement
FREV Appreciation (+)/Depreciation (-) of foreign currency debt GDP Gross Domestic Product
GFS Government Finance Statistics
HR Croatia
IDEA Institute for Democracy and Electoral Assistance
xi IMF International Monetary Fund
IQR Inter Quartile Range
ISS_A Issuance above (-)/below (+) nominal value
IT Italy
K.61 Changes in sector classification
LIA Liabilities in Financial Derivatives (F.71)
LT Lithuania
LU Luxembourg
LV Latvia
Max Maximum
MGDD Manual on Government Deficit and Debt
Min Minimum
MIP Macroeconomic Imbalance Procedure MNAC Millions of National Currency
MS Member States NCB National Central Bank NL The Netherlands
NSA National Statistical Authorities NSD Norwegian Centre for Research Data NSI National Statistical Institute
OAP Other Accounts Payable
OCVO Other volume changes in financial liabilities
OECD Organisation for Economic Co-operation and Development OLIA Other Liabilities
Pctl Percentile
PL Poland
xii
PT Portugal
RED_A Redemptions/repurchase of debt above (+)/below (-) nominal value
RO Romania
SD Statistical Discrepancies SDRs Special drawing rights
SE Sweden
SFA Stock-Flow Adjustment SGP Stability Growth Pact
SI Slovenia
SK Slovakia
SNA System of National Accounts SSF Social Security Funds
Std Dev Standard Deviation TFA Total Financial Assets TFL Total Financial Liabilities
UK United Kingdom
UN United Nations
1
1. INTRODUCTION
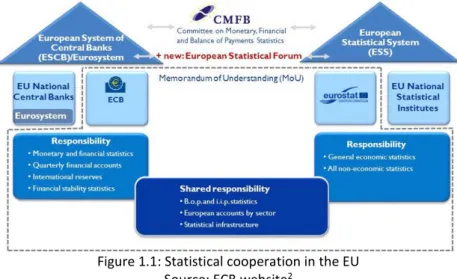
1The European Union (EU) official statistics are produced under two pillars: the European System of Central Banks (ESCB) and the ESS. The ESCB comprises the National Central Banks (NCBs) of all EU MS and the European Central Bank (ECB) and the ESS, aggregating Eurostat and the EU National Statistical Institutes. The Government Finance Statistics (GFS) are a domain of entire responsibility of the Eurostat.
Figure 1.1: Statistical cooperation in the EU Source: ECB website2
The EU law requires Member States (MS) to use European System of National and Regional Accounts 2010 (ESA 2010) to prepare the macroeconomic statistics send to the European Commission (EC). ESA 2010 is an integrated system of economic accounts from which many macroeconomic aggregates are derived (Government Finance Statistics Guide, 2014) that aims to provide methodological guidance to ensure data comparability in the EU.
The EDP statistics is a specific presentation of EU MS’ government accounts and collected by the EC, Eurostat. The data collected is used for fiscal analysis of compliance with obligations under the Treaty on the Functioning of the EU and the Stability and Growth Pact (adopted in 1997). The Stability Growth Pact (SGP) clarified and strengthened the Maastricht Treaty provisions on fiscal discipline, however the full provisions only took effect when the euro currency was launched (1 January 1999). Since then, the SGP has been amended to set the rules to ensure that countries in the EU pursue sound public finances and coordinate their fiscal policies.
The EDP tables cover the general government sector and its subsectors (based on the framework of national accounts – ESA 2010). These tables are designed specifically to provide a consistent
1 The views expressed in this dissertation are those of the author’s and do not necessarily express
the views of the European Commission nor the Central Bank of Ireland.
2 framework that allows international comparability, related to national budgetary aggregates and between the government deficit and changes in government debt, as "government deficit and debt are the primary focus of fiscal surveillance in the Euro Area (EA), and reliable data for these key indicators are essential for the credibility of the surveillance process” (ECB, 2007).
Consequently, various monitoring mechanisms are currently in place to ensure that the data published is in fact harmonised3. As ”accounting conventions usually leave some room for
judgment, which governments may be tempted to take advantage of, especially when fiscal rules bite or threaten to do so” Koen, V. and P. van den Noord ,2005) and as the governments have incentives to report improvements in its fiscal performance, and new governments have reasons to verify the accounts advertised by their predecessors., the attempts to data manipulations will be analysed considering the changes in the data among the different years and data transmissions (revisions study).
In this sense, this study has the purpose to detail the role of Eurostat in the European data production that together with the National Statistical Institutes (NSIs) of the 28 MS represent the European Statistical System (ESS).
In addition, precise information related to the relevance of the GFS data to the EC activities and its MS will be assessed.
1.1
S
TUDY RELEVANCE“The budget deficit and the public debt feature prominently in political debate and economic research” (Irwin, 2015). The dissemination of correct deficit and debt figures is essential for a correct “picture” of the economic reality. It is even more relevant that the figures are disseminated according to the same standards when comparability is needed and when the same rules apply to different countries, as it´s the case in the EU with the Maastricht criteria and the SGP.
“The effectiveness of any fiscal rule crucially depends on the indicators to which it is geared. The indicators should be resilient to manipulation and opportunistic exploitation. (..) Continued compliance with these targets is expected to ensure long-term fiscal sustainability” (ECFIN, 2007). Consequently, “attention to the quality of statistics has increased in recent years, also in the context of the reform of the Stability and Growth Pact (SGP)”(ECFIN,2007). To analyse the quality
3 Harmonised data defined as the use of similar methodological standards correctly implemented
3 of the two crucial indicators, the Directorate General for Economic and Financial Affairs (ECFIN) considers that “Simply comparing deficits with changes in debt can help the early detection of inconsistencies in fiscal data.” and that “Detailed analysis of Stock-Flow-Adjustment (SFA) components is crucial to the full exploitation of the monitoring synergies arising from the presence of two fiscal indicators”.
It is evident that harmonised, comparable and correct data on the deficit and debt figures is of utmost importance for the good functioning of the economy and its monitoring. Updated studies on this field are necessary, using detailed information country by country (EU MS by EU MS) as well as on an aggregated basis. Special relevance will be given to the SFA as well as to its components. The reality among the EU MS will be analysed as comparability should be ensured and data at the same level of detail must be available
Analysing the deficit and debt figures in detail and promoting the discussion about the subject will extend the existent knowledge in the field, facilitating the detection of attempts to data manipulation considering that the most frequent periods for its occurrence will be detected.
1.2
P
ROBLEMI
DENTIFICATION AND STUDY OBJECTIVES“In the implementation of the Excessive deficit procedure relatively little effort was put in the analysis of consistency between deficit and debt data, thus failing to exploit synergies arising in the joint monitoring of the Economic and Monetary Union (EMU) fiscal rules. The problem is witnessed by the tolerance exerted by European institutions towards Member States submitting incomplete reconciliation accounts. It is probably a consequence of the failure to give operational content to the debt rule, and the subsequent focus on the deficit rule” (ECFIN, 2007).
As mentioned by Francisco de Castro, Javier J. Pérez and Marta Rodríguez-Vives, the national statistical authorities have up to four years to provide final data on government deficit and debt figures. This results in uncertainty in relation to first figures released. Even if these changes may lead to an improvement in the reliability of the fiscal data, they may also complicate the EDP process, if the values of the EDP government deficit (or surplus) for a given year changes systematically. In addition, revisions to the government deficit and debt-to-Gross Domestic Product (GDP) ratios could stem from revisions in nominal GDP (denominator effect). Additionally, as limits to the figures are set (for example as according to the Maastricht criteria and the SGP) it becomes tempting to manipulate the data to comply with the rules.
4 This work seeks to study the quality of the GFS data in the EU: to verify whether data comparability in GFS in the EU is ensured and more specifically how does Eurostat verify and guarantees that the methodological common standards in the GFS domain are correctly applied by the different MS.
To answer to this general question more specific issues will be analysed: the role of Eurostat in the GFS data production in the EU; the existent mechanisms used by the MS to manipulate the deficit and the debt figures (if any); the frequency and time when the attempts to manipulate the figures happen more often; how Eurostat prevents data manipulations.
In this context, the revisions policy currently applied in Europe will be assessed and well as the current practices in this regard. When analysing the revisions in both deficit and debt the following information should be obtained:
• How deficit and debt are defined according to the EU standards;
• The magnitude of the revisions in deficit and debt (equivalent or not). If the magnitude is different and is not equivalent, the different possible reasons should be considered;
• The impact of methodological changes from ESA95 to ESA2010 on the deficit and debt figures4;
• When are governments more tempted to manipulate the data.
1.3
M
ETHODOLOGYTo answer the general questions presented in the previous section, it will be verified in first place whether MS attempt to manipulate the deficit and debt figures, not correctly implementing the methodological decisions defined under the Manual on Government Deficit and Debt (MGDD). The revisions in the deficit and debt data, general government expenditure and revenue, documentation from similar studies including Eurostat press releases together with econometric techniques will be used. If large revisions are observed, an explanation should have been provided to Eurostat by the MS.
Residuals like the SFA can be used to manipulate data. As such, through the analysis of EDP table 35 will be possible to verify the different nature of the SFA among the EU MS, to see whether
these residuals acquire a strategic role in manipulating them.
4 Significant will be defined considering the increase or decrease observed as % of GDP. 5 In Annex I
5 In addition, also the revisions between the different components of the SFA will be measured, considering the following categories:
• Transactions in main financial assets
• Time recording differences: Cash and Accrual (EDP Table 2A6)
• Valuation effects and other changes in the volume of debt: o Market-to-face value adjustment
o Foreign Exchange holding gains and losses o Other changes in the volume of debt
After detailed analysis of each component and its revisions, we should have the necessary conditions to assess the SFA relevance in the overall data provided.
Additionally, the statistical discrepancies (SD)7 will be considered. In this case thresholds are
applied and should be respected by the MS.
On a second analysis, the Partial Least Squares Regression will be used to understand whether some events might have impact on the revisions activity of each Member-state. The PLSR allows to project the features into a new set in a lower‐dimensional space. Each such “latent feature” is a linear combination of the original features. Then, regressions are performed using the latent variables. This analysis will be essential to understand which events are relevant to explain the revisions observed on the deficit.
6 In Annex I
7 Statistical discrepancies are defined as differences between deficit and debt figures that
statisticians are unable to attribute to any specific SFA component including the differences between net lending/net borrowing.
6
2. THEORETICAL FRAMEWORK
The Council Regulation 479/2009 requires that EU MS report their actual and planned government deficits together with their levels of government debt to the EC with specific deadlines twice a year (31 March and 30 September). The Excessive Deficit Procedure (EDP) tables are complemented by the Questionnaires related to the EDP notification tables and the EDP inventories8.
The budgetary autonomy of the EU Member-States is constrained to the Maastricht Treaty. As stated under article 126, to avoid an Excessive Deficit, this should not exceed 3 per cent of GDP. Simultaneously, public debt should not exceed 60 per cent of GDP without diminishing at an adequate rate (defined as a decrease of the excess debt by 5 per cent per year on average over three years). The consequences behind the implementation of such thresholds in the quality of the data provided have been analysed by different researchers: Koen, V. and P. van den Noord (2005) concluded through a logit regression analysis over the period 1993-2003 that “when deficit rules tend to become more binding, recourse to gimmicks is more likely, and suggests that their incidence is less where budget systems are more centralised”. Buti, Nogueira Martins and Turrini (2007) have previously stated that, when first implemented, the SGP and the Maastricht criteria triggered a strong fiscal adjustment: the average budget deficit of the EA was reduced from a peak of 6 per cent of GDP in 1993 to less than 1 per cent at the turn of the century. Public debt, which registered a quasi-continuous increase from about 30 per cent of GDP in the mid-1970s, reached about 70 per cent of GDP in mid-1990s and started to decrease, albeit very slowly, thereafter. On the other hand, Easterly (1999) specified that “a simple model shows that when an outside agent forces a reduction in a government´s conventional deficit (debt accumulation), the government will respond by lowering its asset accumulation or by increasing hidden liabilities. That leaves net worth unchanged, so fiscal adjustment is an illusion”.
However, as limits are set, Eurostat should ensure that no data manipulation is in place to respect the defined thresholds. The Protocol on EDP defines "government", "deficit" and "debt" according to the ESA definition. The general government sector is, then, composed by central government, state government (only applicable to 4 of the 28 EU MS), local government and social security funds. "The principal functions of the general government sector are: (1) provide goods and services to the community or households at non-economically significant prices and (2)
8Available in
7 redistribute national income and wealth by means of transfer payments, financing both of these activities primarily from taxation" (European Central Bank, 2007).
In the considered literature, the "deficit" is defined as a balancing item defined in the national accounts as the net borrowing of the general government sector, as measured from the non-financial account (net lending (+)/net borrowing (-), coded B.9). Methodologically measuring the surplus/deficit from the financial account should result in an identical figure, although in practice differences will exist due to various reasons (for example, due to the use of different data sources, as in most of the MS the non-financial accounts are compiled by the National Statistical Institutes (NSIs) while the financial accounts are under the responsibility of the NCBs.
If the deficit is positive, it is referred to as a ‘surplus’ or ‘net lending’ which differs from the similar term used in public accounting and budgetary presentations for the national government balance. According to the Protocol on EDP, the "debt" is a measure of the stock of the Member State’s borrowing at the end of the year. It is defined as the total consolidated gross debt of the general government sector, at nominal value, in the following ESA 2010 categories of government liabilities: currency and deposits (F.2), debt securities (F.3) and loans (F.4). Consequently, the debt measure differs from the financial balance sheet as presented in ESA 2010 in two important aspects:
• it is recorded at nominal value (approximated by face value) and not at market value; • it excludes some categories of financial liabilities.
The government debt should be referred to as general government total consolidated gross debt9as:
• It is consolidated: the government debt held as asset by other government bodies is not considered;
• It is measured on a gross basis: government assets related with the debt are not subtracted. The deficits contribute to the increase of the debt while a surplus would reduce them. However, the change in government debt is affected by several other elements. It is then expected a priori that the deficit figure varies from the debt, as explained in the figure below (figure 2.1).
8
Figure 2.1: From deficit to debt Source: ECB, 2007
As represented in figure 2.1, differences between the government deficit and the change in government debt are known as Deficit-Debt Adjustment (DDA) or SFA, which can be in some cases significant10.
SFA =Net acquisition of financial assets (FA)+ Adjustments + Statistical discrepancies FA =Currency and deposits (F.2)
+ Debt securities (F.3) + Loans11 (F.4)
+ Equity and investment funds/shares (F.5)12
+ Financial derivatives (F.71) + Other accounts receivables (F.8) + other financial assets (F.1, F.6)
Adjustments = Net incurrence (-) of liabilities in financial derivatives (F.71) + Net incurrence (-) of other liabilities (F.1, F.5, F.6 and F.72) + Issuances above(-)/below(+) nominal value
+ Difference between interest (D.41) accrued(-) and paid(+) (D.41_A) + Redemptions/repurchase of debt above(+)/below(-) nominal value + Appreciation(+)/depreciation(-) of foreign-currency debt
+ Changes in sector classification (K.61)(+/-)
+ Other volume changes in financial liabilities (K.3, K.4, K.5) (-) Statistical discrepancies = B.9nf13 - B.9f14
10 A detailed description of the SFA and its components is present on chapter 3.1 11 Including both short-term loans (F.41), net and long-term loans (F.42)
12 Including Portfolio investments, net and equity and investment fund shares/units other than
portfolio investments
13 Non-financial side of the accounts 14 Financial side of the accounts
9 As summarised above and stated on the press release on the SFA biannually published by Eurostat, conceptually, the SFA can be broken down into net acquisition of financial assets (FA), debt adjustment effects (ADJ) and statistical discrepancies (SD). Usually these amounts are explained by the MS, however, special attention should be given to unusually large amounts or offsetting values. If the SFA is positive, then the government debt increases more than the annual deficit while if the SFA is negative the government debt increases less than the annual deficit. The FA are part of the SFA because the financial transactions in assets are not to be considered on the deficit, but they lead to increases or decreases in the stock of debt. Transactions in financial assets are reported on a consolidated basis (excluding transactions with other government units, given that government debt is consolidated within general government). The lending from one unit of government to another is eliminated. Similarly, the acquisition of government bonds by government units is not shown as acquisition of assets, but as reduction in consolidated debt. The amounts of transactions between sub-sectors can be observed when information at the level of each sub-sector of general government is available.
This category is broken down into Currency and deposits (F.2), Debt securities (F.3), Loans granted by government to non-governmental units (F.4), Equity and investment fund shares/units (F.5), Financial derivatives (F.71), Other accounts receivable (F.8) and Other financial assets (OFA): (Monetary gold and SDRs (F.1) and Insurance, pension and standardised guarantee schemes (F.6)).
• F.2 reflects mainly movements in government deposits with banks, notably with central banks, which can fluctuate substantially from one year to another among the MS, in particular due to Treasury operations. The level of deposits is influenced by the economic growth as well as by large operations that lead to large cash flows or inflows.
• F.3 mainly reflects net purchases by government of bills, notes, bonds or preference shares issued by financial institutions, nonfinancial corporations or non-residents (including foreign governments). However, some large investment flows of social security funds are not to be recorded as F.3 if they invest primarily or exclusively in government securities, because these transactions are consolidated. This item does not include transactions relating to derivatives, such as swaps, futures and options, which are reported under the separate item (F.71).
• F.4 comprises loans to non-government units as the data shown is consolidated. This item includes mostly lending to foreign governments, to public corporations, or to students. Loan cancellations are also reflected with a counterpart entry under capital transfers (government expenditure, with a deficit impact). The size of the item reflects the prevalence of lending as
10 part of government policy in various countries. Loans that are granted by government with little expectation of repayments at inception are to be recorded in national accounts as capital transfers (thus entering the deficit, at inception), consequently they are not reported in this item.
• In F.5 the acquisitions less disposals of equity in corporations by government units is considered, divided into portfolio investment and non-portfolio investment. This includes privatisation proceeds, superdividends, equity injections in public corporations, or portfolio investments. Privatisations conducted by special privatization agencies are also reported here, as these entities are to be classified inside general government. In addition, this item includes net investment in mutual funds, which are alternative investment vehicles. Placements in money market mutual funds are reported here (rather than under F.2), despite these being close substitutes for bank deposits. A high negative amount in this item might reflect large privatisations while F.2 (cash) would increase. Another explanation for decreases in F.5 relates to the application of the "superdividend test" to which the distributions (to their owners) by public corporations in excess of their operational profit (excluding holding gains/losses) have to be recorded as financial transactions ("withdrawal of equity") rather than government revenue. Such reclassifications are carried out by many MS, and can also concern distributions by central banks. Another component of the item shares and other equity relates to equity injections (generally in the form of cash provided by government) to specific public corporations and quasi-corporations where government is acting similarly to a private investor and expects a market return on invested funds. When these equity injections create a financing need, consequently there is an indirect increase of the government debt. The portfolio investments represent holdings of shares which do not entail influence over or control of the issuer by the investor. Following the international practices, this means that the investor holds less than 10% of the total shares of the issuer. These are in the form of purchases of quoted shares on the market or of mutual fund shares made by some government units, notably asset-rich social security funds, such as in Luxembourg (LU) and Finland (FI). Placements in money market mutual funds are also to be considered in this item. • Government entities, notably Treasuries, may carry out operations in F.71, for example swaps,
futures and options with the aim to reduce risks related to their debt instruments and for liquidity management purposes. The cash flows related to those operations are recorded in the financial accounts (except for off-market swaps, where there is an impact on the non-financial accounts as well). Financial derivative liabilities are excluded from the government debt.
11 • As the public accounts in the EU are recorded on cash basis (or partially on a cash basis) but ESA 2010 requests recording on accrual basis: government revenue can be cashed, or government expenditure can be settled, at accounting periods different than the economic transaction itself - the impact on the financing needs of government does not directly arise from the deficit. Consequently, the transition from the deficit to the change in government debt has to be completed by reporting other accounts receivable and net incurrence of other accounts payable (F.8). Other accounts receivable include mostly receivables of taxes and social contributions as well as amounts concerning EU transactions (amounts paid by government on behalf of the EU but not yet reimbursed by the EU), trade credits, advance for future acquisition of goods such as military equipment.
• The OFA include Monetary gold and SDRs (F.1) and Insurance technical reserves (F.6). F.1 comprises Monetary Gold (F.11) and Special drawing rights (F.12). As stated in ESA 2010 5.57 Monetary gold (F.11) "is gold to which monetary authorities have title and which is held in reserve assets. It includes gold bullion, and unallocated gold accounts with non-residents that give title to claim the delivery of gold." Special drawing rights (SDRs) are, as stated under ESA 2010 5.69 "international reserve assets created by the International Monetary Fund (IMF) and which are allocated to its members to supplement existing reserve assets." F.6 includes, as under ESA 2010 non-life insurance technical reserves (F.61), life insurance and annuity entitlements (F.62), pension entitlements (F.63), claims of pension funds on pension managers (F.64), entitlements to non-pension benefits (F.65) and provisions for calls under standardised guarantees (F.66).
The category of adjustments relates with the fact that government debt is valued at face value and it is broken down by net incurrence of liabilities in financial derivatives, net incurrence of other liabilities (including F.1, F.5, F.6 and F.72), issuances above/below nominal value, Difference between interest (D.41) accrued and paid , redemptions/repurchase of debt above/below nominal value, appreciation/depreciation of foreign-currency debt , changes in sector classification (K.61) and other volume changes in financial liabilities (K.3, K.4, K.5).
Net incurrence of other accounts payable includes mostly deliveries of goods and services not yet paid for, as well as sums received from the EU but not yet paid out by government to the final beneficiary.
Issuance above (-)/below (+) par should be recorded when governments issue bills, notes and bonds below or above their face value (face value = par value), when the face and issuance values differ. Since government debt must be recorded at face value but the proceeds entering F.2
12 correspond to the issue value: the difference must be recorded as issuance above (-)/below (+) par. Hence, the difference, which has the economic nature of "interest", is recorded as government expenditure not at time of issuance, but only gradually over time. In case of early redemption of the debt, when government buys back issued bonds, or when a government unit purchases bonds issued by another government unit, the difference between the repurchase value and the face value should be presented as redemptions of debt above(+)/below(-) nominal value.
D.41_A relates to the differences observed since, according to the accrual principle, interest must be spread over time; however, the cash transfer occurs only when interest is actually paid. In addition, interest accrued is excluded from the stock of government debt.
When a government issues debt denominated in a foreign currency, and not hedged by derivatives, any subsequent depreciation or appreciation of the national currency leads to changes in debt without an impact on the deficit/surplus. Negative entries (reduction in debt) reflect appreciation of the national currency and positive entries (increase in debt) reflect depreciation of the national currency. In addition, at the time of redemption of the hedged debt, the final gain or loss on the instruments is presented under this adjustment entry.
Sector reclassifications impacting general government happen when an institutional unit which was classified outside/ inside government is reclassified inside/outside government. Consequently, the debt of the reclassified unit and its claims against government units need to be considered in the compilation of the government debt data. A similar impact is observed under other volume changes in financial liabilities (OCVO), such as changes caused by catastrophic losses (K.3), uncompensated seizures (K.4) and other changes in volume not elsewhere classified (K.5).
“An econometric analysis of SFA in EU MS was firstly provided by von Hagen and Wolff (2005)” (ECFIN, 2007). Hagen and Woff discussed the incentive that governments must circumvent fiscal rules by hiding the budgetary implications of fiscal policies in residuals like the SFA is discussed. In this research the authors focus their attention in the deficits and SFA reported before and after the SGP implementation. This approach to the data seems interesting when considering that the time of the study was 2005. However, 10 years later, more detailed data and explanations are provided, longer time series exist and extensive analysis can be applicable (more detailed analysis and consistency checks related to the overall difference between the deficit and the change in debt are also currently in place).
13 In 2007, Buti, Nogueira Martins and Turrini develop a model where the total SFA is separated in two components (one that can be used to reduce the deficit amounts reported and the other to impact debt figures). Consequently, it would then be possible to verify the interaction between both figures involved in the Maastricht fiscal rules. Notably, the authors found that the introduction of the SGP had an increasing impact on the deficit-specific component, but not on the debt.
The focus of these studies was in the EU (composed by 15 MS) and on the Euro-area MS. The data was analysed from 1994 to 2004, and the data provided by the MS was less detailed than the currently transmitted data to Eurostat.
In addition, by the time of the two researches, less awareness regarding the SFA as more than a residual existed, as mentioned by Buti, Nogueira Martins and Turrini (2007) “Economic analysis has started only recently to pay attention to the behaviour of the SFA (…) the SFA is usually disregarded or treated as a mere residual. (…) Economic analysis has started only recently to pay attention to the behaviour of the SFA”. The European Statistics Code of Practice (ESCP) had just been adopted by the Statistical Programme Committee (24 February 2005 and revised by the European Statistical System Committee in 2011), the regulation concerning the statistics of EDP had just been amended: The Eurostat role had just been reinforced by introducing formal requirements relate to completeness and internal consistency of the data together with the improvement of “dialogue” and “methodological” visits. Consequently, Eurostat was just starting a process of reinforcement of validation of economic and fiscal data creating a dedicated unit (currently directorate D).
Since these researches were published significant improvements are expected, a more complete, updated analysis and research on this field considering more possibilities and variables that might influence the quality of the data seem to be necessary. In 2014, a note on the revisions in the government debt, government deficit, expenditure and revenue was published by Eurostat. In the note, the focus of the study was mostly 2013 figures. The aggregates are analysed; however, no detailed conclusions are provided in what relates to the components of the aggregates (e.g: government revenue is mostly composed by taxes, net social contributions, market output, output for own final use and payments for non-market production and property income). Nevertheless, relevant information can be retained: the most important ESA 2010-related reasons for revisions to government deficit data are the revised rules for classification of units into the general government sector and for the recording of lump sum payments for pension scheme transfers. The introduction of ESA 2010 also removed interest flows on swaps and forward rate
14 agreements (FRAs) from the calculation of the government deficit, thereby exactly aligning the deficit used for EDP purposes with the deficit in national accounts. ESA 2010 also revised the rules for the recording of payable tax credits, standardised guarantees and the recording of the sale of government licenses. The revisions to the government debt data have been largely driven by the revised rules for classification of units into the general government sector.
Such changes resulted in revisions of the government deficit and debt levels, as well as to GDP (the latter being the denominator used for the calculation of deficit and debt to GDP ratios). As in any significant methodological change, the MS also used the chance to proceed with benchmark revisions, improvements in data sources and compilation methods and this should also be taken into consideration when analysing the previous observed revisions.
Considering the data transmitted from April 2014 to October 2014 the government debt ratios were more revised than government deficit ratios15. At EU level the impacts were relatively
smaller due to offsetting effects between MS. The revisions made since April 2014 to government debt ratios exceeded 2 percentage points (pp) of GDP for nine MS for the year 2013, notably due to reclassifications of public units into the general government sector related to the introduction of ESA 2010 and due to significant increases in GDP. The removal of interest flows on swaps and forward rate agreements from the government deficit calculation also affected the deficit levels in most MS, albeit by smaller amounts.
2.1
M
ETHODOLOGICAL GUIDANCE IMPACTING THEEDP
STATISTICS"The European Statistics Code of Practice sets the standard for developing, producing and disseminating European statistics. It builds upon a common ESS definition of quality in statistics and targets all relevant areas from the institutional environment, the statistical production processes to our output: European official statistics."16, including then, the EDP and GFS data.
According to the Code, 15 key principles are settled regarding the production and dissemination of European official statistics and the institutional environment under which national and Community statistical authorities operate. The ESCP was adopted by the Statistical Programme Committee on 24 February 2005 and was revised by the European Statistical System Committee (ESSC) in September 2011.
Together with the new version of the ESCP, the ESSC adopted the Quality Assurance Framework. The Quality Assurance Framework serves as guidance regarding the implementation of the ESCP.
15 Government debt/GDP and Government deficit/GDP
15 In addition, Eurostat has adopted the Protocol on Impartial Access to Eurostat data for users to support the implementation of the Code.
The national account systems are the implementation of complete and consistent accounting techniques for measuring the economic activity of a nation. This double-accounting system is regulated by System of National Accounts 2008 (SNA 2008), a statistical framework that provides a consistent set of macroeconomic accounts for policymaking, analysis and research purposes. The SNA 2008 results from the cooperation between the United Nations (UN), the EC, the Organisation for Economic Co-operation and Development (OECD), the International Monetary Fund (IMF) and the World Bank Group. This version of the manual represents an update of the SNA 1993, both versions authorised by the United Nations Statistical Commission (UNSC). At the EU level, specific national accounts standards must be followed, as stated in ESA. ESA 2010 is the newest EU accounting framework, fully compatible with the SNA 2008 but including specific guidelines adapted to the EU. The reference values for deficit and debt are based on concepts defined in ESA2010, which was published in the Official Journal on 26 June 2013 and implemented as from September 2014. ESA is a legal act, it has more precise definitions and it is intended as reference guide, whereas the SNA includes more explanations and background information. To provide an interpretation of the ESA 2010 rules relating to the deficit and debt, Eurostat, together with experts representing EU MS and other international institutions, publishes the MGDD. The MGDD assists the compiling institutions and the users of the EDP data to compile and interpret the data in a harmonised way. The latest version of the MGDD was published in April 2016 and is available in the Eurostat Website. In addition to the MGDD, Eurostat publishes guidance notes and methodological decisions related to specific issues.
Methodological changes and questions regarding the deficit and the debt are discussed within different task forces, where experts from the different compiling institutions of the 28 EU MS, EFTA countries and candidate countries are invited as well as other international organisations (OECD, ECB…). EDP issues are debated in the Excessive Deficit Procedure Working Group (EDPS WG), however, if a methodological decision is required by Eurostat, the Committee on Monetary, Financial and Balance of Payments Statistics (CMFB) needs to be consulted.
2.2
EDP
DATA TRANSMISSION AND VALIDATION PROCESSThe MS have the responsibility to send to Eurostat (by the end of March and end of September) the EDP tables covering the four reporting years (past years) and a forecast of the coming year (year of transmission). While the actual data (for four reporting years) is under Eurostat
16 responsibility, the forecasts (planned data) sent in all EDP tables except EDP table 3, are under the responsibility of the ECFIN.
The data is analysed by Eurostat and published about three weeks after the notification deadline.
2.2.1 EDP tables and data quality checks
The EDP data are reported in a harmonised set of tables, known as the EDP notification tables or EDP tables that are presented as annual time series in millions of national currency (MNAC). There are four main data tables17::
• EDP Table 1 - Reporting of government surplus/deficit and debt levels and provision of associated data;
o Includes the essential information on government net lending/net borrowing and government debt. The B.9 is provided for each general government subsectors while the government debt is disaggregated to categories of financial instruments: it is disaggregated into the different categories of debt (F.2, F.3 and F.4). F.3 and F.4categories are split into short-term and long-term loans. Additionally, interest expenditure (D.41, uses, reported on a consolidated basis) and gross fixed capital formation (in ESA 2010 no subtraction for depreciation of fixed assets – consumption of fixed capital – is performed in this item) of general government are also reported in the table. Finally, GDP at current market prices (coded: B.1*g) is required. It is used as the denominator for the government surplus/deficit and debt ratios.
• EDP Table 2 - Provision of the data which explain the transition between the public accounts budget balance and the government surplus/deficit by subsector (2A central government, 2B state government, 2C local government and 2D social security funds);
o The working balance18 is the starting point - this might be recorded on a cash-basis19, on
accrual basis20 or on a mixed-cash-accruals basis. Considering the differences in
recording practices among the MS, different coverages of revenue and expenditure among the countries are expected. Consequently, various adjustments are needed to
17 Detailed EDP notification tables are available in Annex I
18 The working balance stands for the measure commonly used in the Member States' public accounts or budget presentation. For central government, this should correspond to the public accounts outcome usually presented to the national parliament, and independently audited.
19 Expenditure or revenue is recorded when paid or received.
17 convert the working balance to a harmonised definition of government surplus/deficit (B.9). The public accounts budget balance is a non-harmonised measure of B.9 where both financial instruments and non-financial might be included while the government surplus/deficit in EDP Table 2 should be calculated from non-financial transactions only. To change from one measure to the other the following adjustments might be necessary:
▪ including non-financial transactions that are not reported in the working balance;
▪ changes to time of recording (transition to ESA 2010 accrual recording); ▪ adjusting for sector delimitation (adding or subtracting the results of
entities to align with the ESA 2010 sector definitions); ▪ other adjustments.
• EDP Table 3 - for the general government (3A) and by subsector (3B central government, 3C state government, 3D local government and 3E social security funds)21: reconciles
government surplus/deficit with the change in government debt and shows transactions and other flows which contribute to the change in debt.
o The changes in the stock of government debt are explained as the contribution of government surplus/deficit and other factors, i.e. the Stock-Flow Adjustment (SFA): (1) Change in stock of debt at face value = (–) B.9 + SFA.
The SFA is composed by:
o FA: a positive value (+) means net acquisition, and a negative (-) a net disposal of financial assets. The following categories of financial assets are presented:
▪ currency and deposits (F.2); ▪ debt securities (F.3); ▪ loans (F.4);
▪ equity and investment fund shares or units (F.5); ▪ financial derivatives (F.71);
▪ other accounts receivable (F.8);
▪ other financial assets - monetary gold and special drawing rights (F.1) and
insurance, pension and standardised guarantees schemes (F.6).
21Each of Tables 3B-3E is consolidated within the subsector, giving detailed information on how the consolidation works, linking directly to EDP Table 1
.
18 o the series of adjustments needed to define the scope, the valuation and consistence between non-financial and financial balance. reports transactions in financial liabilities for the categories of liabilities not included in the government (EDP) debt definition:
▪ net incurrence (-) of liabilities in financial derivatives (F.71); ▪ net incurrence (-) of other accounts payable (F.8);
▪ net incurrence (-) of other liabilities (F.1, F.5, F.6 and F.72).
Transactions are recorded at market value, however the debt in the EDP tables is recorded at face value; consequently, specific adjustments are needed to arrive at the face valuation of the government debt. These adjustments include also the situation where debt is issued, or redeemed, at a value different from the face value, and the value of debt issued in foreign currency changes due to movements in exchange rates.
In addition, EDP table 3 is also designed to allow checks on the consistency of the whole sequence of government accounts. EDP Table 3 allows monitoring the consistency of the non-financial and the financial information.
(2) B.9nf22 - B.9f23 = SD24
(3) TFA-TFL = B.9f
The inconsistencies between the financial and the non-financial side of the accounts are SD. This is an essential quality assurance check for the GFS, as the financial accounts and the non-financial accounts of general government are “often compiled from a diversity of sources, which may not be fully integrated or completely homogenous, leading to differences between the revenue and expenditure data and the financing data, or between the transactions in debt and other economic flows in debt (i.e. valuation effects and other changes in volume) data, on one hand, and the change in debt data, on the other hand. Some deviations may also appear due to differences in "vintages" (data compiled at different points of time)”25. When analysed quarterly,
the differences should not exceed 2% of quarterly GDP.
22 Non-financial accounts 23 Financial accounts 24 Statistical discrepancies 25Retrieved from http://ec.europa.eu/eurostat/documents/4187653/5798029/STOCK_FLOW_2013_APR-EN.PDF/c43805e3-0d52-440e-874a-1d64b8a2369c?version=1.0 (14/08/2017)
19 • EDP Table 4 - Provision further specific data in accordance with the Statements contained in the Council Minutes of 22 November 1993. This includes four items: stocks of government liabilities from trade credits and advances26; amounts outstanding in the government debt
from the financing of public undertakings27; a description if necessary of substantial
differences between face and present values of government debt28; and gross national
income29.
Additionally, the Questionnaire related to the EDP notification tables is also sent by the MS containing detailed additional information on particular items reported in the EDP tables. However, this information is not intended for publication and is used for verification purposes. The EDP Inventory is also provided, which describe the methods, procedures and sources used to compile actual surplus/deficit and debt data and the underlying government accounts.
2.2.2 EDP and GFS – data comparability
Data on GFS (annual and quarterly expenditure and revenue of the General Government) is also being published by Eurostat in accordance with the ESA 2010 transmission programme of data. As under figure 2.2, according to the GFS presentation: Total Revenue – Total Expenditure = B.9 = B.9f. However, as data sources differ, discrepancies between B.9 and B.9f are in practice expected.
26 Trade credits and advances (liability) occur when a unit receives a good or service without having
paid for it. As the acquisition of a good/service is recorded in the non-financial account, therefore it contributes to the surplus/deficit. The part not yet paid is the trade credit and the stock of this is a government liability. It is not one of the liability categories included in the government (EDP) debt. The information is supplied so that an alternative measure of debt, including the trade credits and advances, can be compiled for analytical purposes.
27 Information on the amounts outstanding in the government debt from the financing of public
undertakings refers to the amount that government lends to its public corporations.
28 The explanation of substantial differences between face and present values of government debt is
important when the current market prices of government debt differ from the prices at which the debt will be repaid at its maturity.
29 Gross national income (GNI) = GDP - primary income payable by resident institutional units to
non-resident institutional units + primary income receivable by resident institutional units from the rest of the world.
20
Figure 2.2:GFS presentation Source: 2010 ESA, chapter 20
Figure 2.3: Decomposition of Total revenue Source: 2010 ESA, chapter 20
Figure 2.4: Decomposition of Total expenditure Source: 2010 ESA, chapter 20
Table 2.1: comparison between GFS and EDP datasets
ESA table Description Common items between GFS and EDP
Table 2 Main aggregates of general government,
annual
B.9 (for all subsectors), Interest payable (D.41 as coded in ESA 2010), as well as gross fixed capital formation (P.51G as coded in ESA 2010) at the general government level should match the amounts published as under EDP Table 1. Capital transfers, payable (D.9 as coded in ESA 2010) should match the amounts provided under EDP Questionnaire table 10.1 A (however, the EDP questionnaire tables are not published).
Table 9 Detailed tax and social contribution receipts by type of tax or social
contribution and receiving subsector
As only the revenue side is transmitted under Table 9, no comparisons with EDP are performed. Nevertheless, Table 9 is expected to be fully consistent (for the common items) with ESA Table 2.
21
including the list of taxes and social
contributions according to national
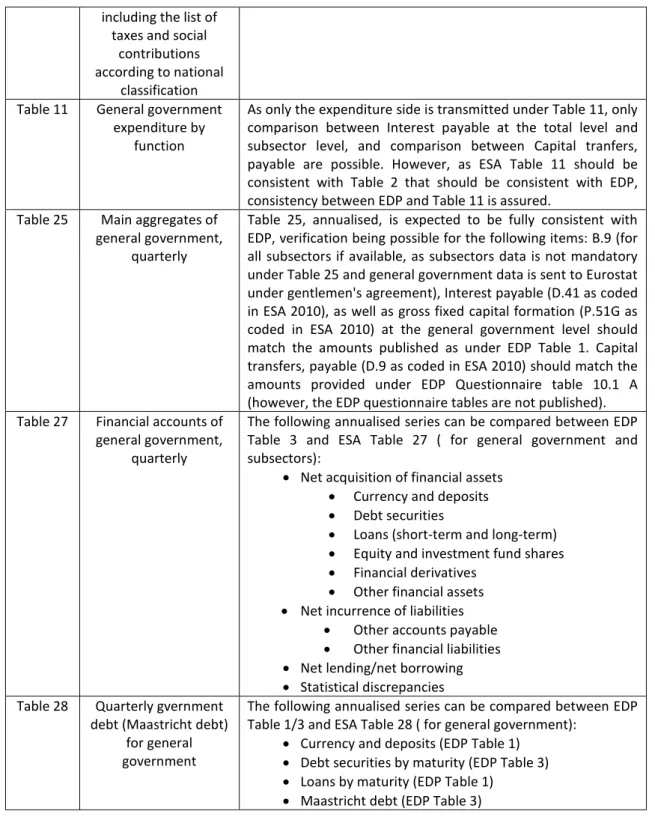
classification Table 11 General government
expenditure by function
As only the expenditure side is transmitted under Table 11, only comparison between Interest payable at the total level and subsector level, and comparison between Capital tranfers, payable are possible. However, as ESA Table 11 should be consistent with Table 2 that should be consistent with EDP, consistency between EDP and Table 11 is assured.
Table 25 Main aggregates of general government,
quarterly
Table 25, annualised, is expected to be fully consistent with EDP, verification being possible for the following items: B.9 (for all subsectors if available, as subsectors data is not mandatory under Table 25 and general government data is sent to Eurostat under gentlemen's agreement), Interest payable (D.41 as coded in ESA 2010), as well as gross fixed capital formation (P.51G as coded in ESA 2010) at the general government level should match the amounts published as under EDP Table 1. Capital transfers, payable (D.9 as coded in ESA 2010) should match the amounts provided under EDP Questionnaire table 10.1 A (however, the EDP questionnaire tables are not published). Table 27 Financial accounts of
general government, quarterly
The following annualised series can be compared between EDP Table 3 and ESA Table 27 ( for general government and subsectors):
• Net acquisition of financial assets • Currency and deposits • Debt securities
• Loans (short-term and long-term) • Equity and investment fund shares • Financial derivatives
• Other financial assets • Net incurrence of liabilities
• Other accounts payable • Other financial liabilities • Net lending/net borrowing • Statistical discrepancies Table 28 Quarterly gvernment
debt (Maastricht debt) for general government
The following annualised series can be compared between EDP Table 1/3 and ESA Table 28 ( for general government):
• Currency and deposits (EDP Table 1) • Debt securities by maturity (EDP Table 3) • Loans by maturity (EDP Table 1)
• Maastricht debt (EDP Table 3)
2.2.3 Data publication
The EDP Tables are published 3 weeks after the deadline for MS' transmission. The data is published under different formats, individually for all EU MS, for the EU aggregates and for EA aggregates. Data is available on the Eurobase (Eurostat database) together with corresponding metadata on the website30 :
22 • Government deficit and debt (code t_gov_a)
o General government deficit/surplus (tec00127) o General government gross debt (tsdde410) o General government fixed investment (teina210) In addition, the following publications are available:
• EDP Notification Tables • EDP inventories
• Press release on the SFA
• Eurostat EDP visits to Member States • Statistics explained GFS section
In what relates to methodological issues and legal requirements, all the following are available: • Manuals31
o Manual on Government Deficit and Debt – Implementation of ESA 2010 – 2016 edition
o European System of Accounts - ESA 2010 o ESA 2010 - Transmission programme of data • Decisions
• Guidance notes and clarifications • Advice to the Member States • EU legislation
23
3. DATA ANALYSIS
3.1
D
ATAD
ESCRIPTIONTo allow comparability among the different MS and to facilitate its analysis, data was standardized as follow:
a)
B.9
t/ GDP
2016t32b)
Debt
t/GDP
2016t33c)
SFA
t/GDP
2016t34c.1)
FA
t/GDP
2016tc.1.1) F.2
t/GDP
2016tc.1.2) F.3
t/GDP
2016tc.1.3) F.4
t/GDP
2016tc.1.4) F.5
t/GDP
2016tc.1.5) F.71
t/GDP
2016tc.1.6) F.8
t/GDP
2016tc.1.7) OFA
t/GDP
2016tc.2)
ADJ
t/GDP
2016tc.2.1) LIA
t/ GDP
2016tc.2.2) OAP
t/ GDP
2016tc.2.3) OLIA
t/ GDP
2016tc.2.4) ISS_A
t/GDP
2016tc.2.5) D.41_A
t/GDP
2016tc.2.6) RED
t/GDP
2016tc.2.7) FREV
t/GDP
2016tc.2.8) K.61
t/GDP
2016tc.2.9) OCVO
t/GDP
2016tc.3)
SD/GDP
2016t32Published on the Eurobase, database code gov_10dd_edpt1 in
http://epp.eurostat.ec.europa.eu/portal/page/portal/government_finance_statistics/data/database
33Published on the Eurobase, database code gov_10dd_edpt1 in
http://epp.eurostat.ec.europa.eu/portal/page/portal/government_finance_statistics/data/database
34Published on the Eurobase, database code gov_10dd_edpt3 in