Biomechanical analysis of standard and contr-standars sculling in synchronized swimming
81
0
0
Texto
(2) Diogo, Vera (2011). BIOMECHANICAL ANALYSIS OF STANDARD AND CONTRA-STANDARD SCULLING IN SYNCHRONIZED SWIMMING. Master Thesis in Sport Sciences. University of Porto, Faculty of Sport.. KEY. WORDS:. SYNCHRONIZED. SWIMMING,. KINEMATIC,. KINETIC,. TETHERED-SWIMMING, SCULLING.. PALAVRAS CHAVE: NATAÇÃO SINCRONIZADA, CINEMÁTICA, CINÉTICA, NADO-AMARRADO, REMADA.. II.
(3) Acknowledgments. At this point, I would like to take the opportunity to express my gratitude to all that have supported me on the process of elaboration of this thesis:. - Prof. Dr. Ricardo Fernandes, who gave me the honor of been my promoter and also gave me entire support. - Prof. Dr. João Paulo Vilas-Boas for his help in solving the emerging “natural” problems. - Prof. Dr. Susana Soares for their time and all of the support. - Dr. Pedro Gonçalves for his cooperation in all experimental proceedings. - Prof. Dr. Carlos Tourino for his cooperation in the experimental moments. - Dr. Pedro Figueiredo for his participation in experimental procedures and technical support. - Special thanks to the synchronized swimmers and their coaches, as also to the collaborators, who participated in these studies, for their time, commitment and enthusiasm. - My family, for all the support. - Bruno, for everything.. III.
(4) IV.
(5) This Thesis is based on the following papers and abstracts, which are referred in the text by their Arabic numerals: -----------------------------------------------Papers------------------------------------------------1. Diogo, V.; Soares, S.; Tourino, C.; Carmo, C.; Aleixo, I.; Morouço, P.; VilasBoas, J.P.; Fernandes, R.J. (2010). Quantification of maximal force produced in standard and non-standard sculling in synchronized swimming. A pilot study. Open Sports Sci. Journal, 3: 81-83.. 2. Diogo, V., Soares, S., Tourino, C., Abraldes, J.A., Ferragut, C., Morouço, P., Vilas-Boas, J.P., Fernandes, R.J. (2010). Tethered Force Production in Standard and Contra-standard Sculling in Synchronized Swimming. In: Kjendlie, P. L., Stallman, R. K., Cabri, J. (Eds), Biomechanics and Medicine in Swimming XI. Norwegian School of Sport Science, pp. 67-69.. 3. Diogo, V., Soares, S., Tourino, C., Figueiredo, P., Vilas-Boas, J.P., Fernandes, R.J. (2011). Kinematic and Kinetic Analyses of Standard and Contra-Standard Sculling in Synchronized Swimming. For submission to the Journal of Applied Biomechanics.. V.
(6) VI.
(7) Table of Contents. Chapter 1.. General Introduction. 1. Chapter 2.. Quantification of maximal force produced in standard and. 7. contra-standard sculling in synchronized swimming. A pilot study.. Chapter 3.. Tethered Force Production in Standard and Contra-. 13. standard Sculling in Synchronized Swimming.. Chapter 4.. Kinematic and Kinetic Analyses of Standard and Contra-. 23. Standard Sculling in Synchronized Swimming.. Chapter 5.. General Discussion and Suggestions for Future Research. 41. Chapter 6.. Conclusions. 49. Chapter 7.. References. 51. VII.
(8) VIII.
(9) Index of Figures. Chapter 2. Figure 1. Example of an individual F(t) curve in standard. 11. sculling of the synchronized swimmer.. Chapter 3. Figure 1. Example of an individual F(t) curve (unfiltered data). 19. in standard sculling. The cut point of the two first s of force values, correspondent to the first pull, is marked.. Chapter 4. Figure 1. Volume calibration used in the kinematic analysis.. 27. Figure 2. Example of standard (left panel) and contra-. 28. standard sculling (right panel). Figure 3. Example of an individual F(t) curve, for standard and contra-standard sculling, for 20, 40, 60 and 80% of the 30s tethered synchronized swimming test.. IX. 32.
(10) X.
(11) Index of Tables. Chapter 2. Table1. Values of maximal (absolute and relative) and. 10. minimal force (Fmax, relative FMax and Fmin, respectively), the time when these values occurred, the average of maximal force (FmaxAvg) and fatigue index (FI) in standard and contra-standard sculling in both participants.. Chapter 3. Table 1. Individual and Mean ± SD values of physical. 16. characteristics of the synchronized swimmers (n=13).. Table 2. Individual and Mean ± SD values of absolute. 17. maximal (Fmax) and relative (Relative Fmax) force, the time when the Fmax occurred (Fmax Time), mean force (Fmean), the average of maximal and minimum forces (FmaxAvg and FminAvg, respectively) and the fatigue index (FI) in standard sculling (n=13).. Table 3. Individual and Mean ± SD values of absolute. 18. maximal (Fmax) and relative (relative Fmax) force, the time when the Fmax occurred (Fmax Time), mean force (Fmean), the average of maximal and minimum forces (FmaxAvg and FminAvg, respectively) and the fatigue index (FI) in contrastandard sculling (n=13).. Chapter 4. Table 1. Mean ± SD values of frequency and duration of sculling, displacement, speed and acceleration of the hand and, angular velocity and acceleration of the elbow and wrist, both for standard and contra-standard sculling, in four moments of the 30s tethered swimming test (n=6).. XI. 30.
(12) Table 2. Table 2. Mean ± SD values of force in four moments. 31. of the 30s tethered swimming test, both for standard and contra-standard sculling (n=6).. Table 3. Individual and Mean ± SD values of absolute and. 31. relative maximal force, the time when the maximal force occurred, mean force, the average of maximal and minimum forces and, the fatigue index, both for standard and contrastandard sculling (n=6).. Table 4. Correlation values (Spearman) between kinematic parameters and tethered force parameters both for standard and contra-standard sculling.. XII. 33.
(13) Index of Equations. Chapter 2. Equation 2.1. Relative Fmax = Force / Weight. 10. Equation 2.2. FmaxAvg = average of the five highest values. 10. during the test. Chapter 3. Equation 2.3. FI (%) = ([Fmax–Fmin)/Fmax]x100. 10. Equation 3.1. RFmax = Force.body weight-1. 16. Equation 3.2. FmaxAvg = average of all force values in the. 16. first 5 s of the test. Equation 3.3. FminAvg = average of all force values in the. 16. last 5 s of the test. Chapter 4. Equation 3.4. FI (%) = ([FmaxAvg-FminAvg)/FmaxAvg]x100. 16. Equation 4.1. v = Δx/Δt. 27. Equation 4.2. a = Δv/Δt. 27. Equation 4.3. ω = Δθ/Δt. 27. Equation 4.4. α = Δω/Δt. 27. Equation 4.5. SF = total number of complete cycles in the. 28. 30s/30. XIII.
(14) Equation 4.6. SD = mean duration of twelve complete cycles. 28. Equation 4.7. RFmax = Force.body weight-1. 28. Equation 4.8. FmaxAvg = average of all force values in the. 28. first 5 s of the test. Equation 4.9. FminAvg = average of all force values in the. 28. last 5 s of the test. Equation 4.1.1. FI (%) = ([FmaxAvg-FminAvg)/FmaxAvg]x100. XIV. 28.
(15) Abstract Synchronized swimming is considered the most beautiful and expressive swimming discipline. Despite the differences with the conventional swimming techniques, there are specific movements used in swimmers displacement that are common, as sculling. Sculling is the essence of synchronized swimming, being a basic propulsive movement that consists in underwater arm stroke patterns describing a “figure 8” or an egg-shaped oval path. However, studies carried out in synchronized swimming are scarce, particularly those related to the biomechanical analysis of sculling. Our purpose was to conduct a kinematic and kinetic analysis of standard and contra-standard sculling, based on threedimensional motion analysis, and using a 30s maximal tethered synchronized swimming test. National level synchronised swimmers volunteered to participate, being studied the frequency and duration of sculling, displacement, velocity and acceleration of the hand, angular velocity and acceleration of the elbow and wrist, values of absolute and relative maximal force, the time when the maximal force occurred, mean force, the average of maximal and minimum forces and the fatigue index in both standard and contra-standard sculling. The data showed that, for almost all the subjects, the higher values of maximal force were found in the standard sculling (e.g. 40.8 and 34.6N for standard and contra-standard sculling, respectively), and significant differences were only observed in sculling frequency (2.36 and 2.00Hz for standard and contrastandard sculling, respectively) and sculling duration (0.43 and 0.51s for standard and contra-standard sculling, respectively). The fatigue index evidenced that the maximal force declined with time in both sculling conditions. The onset of fatigue reduces the capacity to scull at a high propelling efficiency, as well as the capacity to deliver a high amount of work per sculling. Synchronized swimmers tend to modify the sculling kinematic parameters as fatigue increases, and that can be due to a reduction in force production. It can be concluded that there are a connection between kinematic sculling parameters and force sculling parameters. KEY. WORDS:. SYNCHRONIZED. SWIMMING,. TETHERED-SWIMMING, SCULLING. XV. KINEMATIC,. KINETIC,.
(16) XVI.
(17) Resumo A natação sincronizada é considerada a mais bonita e expressiva das disciplinas da natação. Apesar das diferenças com as técnicas convencionais da natação, existem movimentos específicos de deslocamento que são comuns, como por exemplo, as remadas. As remadas são a essência da natação sincronizada e são um movimento propulsivo básico que consiste num padrão de braçada subaquática que descreve a forma de um 8 ou um percurso oval em forma de ovo. No entanto, os estudos desenvolvidos na natação sincronizada são escassos, particularmente os relacionados com a análise biomecânica da remada. O propósito deste estudo foi realizar uma análise cinemática e cinética da remada standard e contra-standard, baseada numa análise tridimensional e utilizando um teste máximo de 30s de nado sincronizado amarrado. Praticantes de natação sincronizada de nível nacional voluntariaram-se para participar neste estudo, tendo sido calculado: a frequência e duração da remada, o deslocamento, velocidade e aceleração da mão, velocidade e aceleração angular do punho e cotobelo, valores de força máxima absoluta e relativa, o momento temporal em que a força máxima ocorreu, força média, a força máxima média, a força mínima média e o índice de fadiga na remada standard e contra-standard. Os resultados demonstraram que, para quase todos os sujeitos, valores mais altos de força máxima foram alcançados na remada standard (p.e. 40.8N para a remada standard e 34.6N para a remada contra-standard) mas só foram observadas diferenças significativas na frequência da remada (2.36Hz para a remada standard e 2.00Hz para a remada contra-standard) e na duração da remada (0.43s para a remada standard e 0.51s para a remada contra-standard). O índice de fadiga evidenciou que a força máxima sofreu um declínio ao longo do tempo do teste em ambas as remadas. O aparecimento da fadiga reduz a capacidade de efectuar as remadas com alta eficiência de propulsão. As nadadoras tendem a modificar os parámetros cinemáticos da remada com o aumento da fadiga, o que pode ser devido ao facto de a força de propulsão diminuir. PALAVRAS CHAVE: NATAÇÃO SINCRONIZADA, CINEMÁTICA, CINÉTICA, NADO AMARRADO E REMADA. XVII.
(18) XVIII.
(19) Résumé La nage synchronisée est considérée comme étant la plus belle et la plus expressive discipline de la natation. Même s’il y a des différences, il existe des mouvements spécifiques de déplacement qui sont comuns, comme para exemple, les godilles. Les godilles sont l’essence de la nage synchronisée et sont un mouvement propulsif de base qui consiste en un modèle de brasse coulée qui représente la forme d’un 8 ou un parcours oval en forme d’oeuf. Cependant, les études développées sur la nage synchronisée sont peux, en particulier ceux qui sont mis en rapport avec l’analyse biomécanique de la godille. L’objectif de cette étude a été de réaliser une analyse cinématique et cinétique de la godille standard et contre-standard, fondée sur une analyse tridimensionnelle et en utilisant une épreuve maximum de 30s de nage synchronisée amarrée. Des pratiquantes de nage synchronisée de niveau national ont participé volontairement à cette étude, ayant été calculé : la fréquence et la durée de la godille , le déplacement, la vitesse et l’accélération de la main, la vitesse et l’accélération angulaire de la poignée et du coude, les valeurs de force maximum absolue et relative, le moment temporel où la force maximum a eu lieu, la force moyenne, la force maximum moyenne, la force minimum moyenne et l’indice de fatigue de la godille standard et contrestandard. Les résultats ont démontré que, pour presque tous les individus, les valeurs plus grandes de force maximum ont été atteintes avec la godille standard (p.e. 40.8N pour la godille standard et 34.6N pour la godille contrestandard) et dans la durée de la godille (0.43s pour la godille standard et 0.51s pour la godille contre-standard). L’indice de fatigue a mis en évidence que la force maximum a souffert un déclin tout au long du temps de l’épreuve des deux godilles. L’apparition de la fatigue réduit la capacité d’effectuer des godilles avec une supérieure efficacité de propulsion. Les pratiquantes de nage synchronisée ont la tendance de modifier les paramètres cinématiques de godille avec l’augmentation de la fatigue, ce qui peut être expliqué par la diminution de la force de la propulsion. MOTS-CLÉS: NAGE SYNCHRONISEE, CINEMATIQUE, CINETIQUE, NAGE AMARREE ET GODILLE. XIX.
(20) XX.
(21) Abbreviations and Symbols Abbreviation/Symbol - Term (unit) % - percentage *, a, b, c, d, e and f - significant difference ºC – degrees Celsius cf. - confront e.g. - example F - force FI - fatigue index Fig. - figure Fmax - maximal force FmaxAvg - average of maximal force FmaxTime - the time at which maximal force occurred Fmean - mean force Fmin - minimal force FminAvg - average of minimal force F(t) - force to time Hz – hertz m – meters m.s-1 – meter per second m.s-2 – meter per second squared n - number of subjects N - newton N.kg-1 - newton per kilogram r – correlation. XXI.
(22) rad.s-1 – radians per second rad.s-2 - radians per second squared RFmax - relative maximal force s - seconds SD - standard deviation - mean. XXII.
(23) CHAPTER 1. GENERAL INTRODUCTION. Although many definitions has been used regarding synchronized swimming, the most widely used applies to any form of movement in water in which the swimmer moves synchronously, with or without music, and/or with or without other swimmers (Gray, 1993). Traditionally, synchronized swimming is considered the most beautiful and expressive of the swimming disciplines. Thus, it is a sport that gathers technique with aesthetic, difficulty with grace, and elegance with effort; furthermore, synchronized swimming requires strength, endurance, grace, good respiratory control and musical ear (Martins et al., 2006). Firstly, the main vehicles for synchronized swimming were shows and musicals, beginning to acquire status as a genuine sport only in the 1950s, when it was included as an official event by the Fédération Internationale de Natation Amateur (FINA). Afterwards, it began to spread internationally during the second half of the 20th century, being recognized as an Olympic sport in 1984 (Los Angeles), although not considered a major sport and be essentially practiced by females (Terret, 2005). The main synchronized swimming competitions are the Olympic Games (since 1984), the World Championships (since 1973), the Goodwill Games (since 1990), and the European Championships (since 1993); there are also a number of open international meetings with more flexible rules (Terret, 2005). Despite the differences between synchronized swimming and conventional swimming, there are specific techniques used for synchronized swimmers displacement that come from the conventional swimming techniques. They are performed by using simple movements, like sculling, allowing graceful transitions as well as formations schema (Martins et al., 2006). Sculling is the essence of synchronized swimming, consisting in underwater arm stroke pattern that describes a “figure 8” or an egg-shaped oval path (Chu, 1999; Ito, 2006). Two types of basic sculling in horizontal position of the body can be mentioned: (i) standard sculling (movement towards the head, with the body placed in supine position, the arms in the lateral of the trunk, the wrist in dorsal flexion and the hand palm oriented toward the feet) and (ii) contra-standard 1.
(24) sculling (movement towards the feet with the body in supine position, the arms in the lateral of the trunk, the wrist in palmar flexion and the hand palm oriented towards the head). Sculling is always accomplished by a lateral movement of the hands and forearms from the outside to inside (in-scull/in-sweep), from the inside to outside (out-scull/out-sweep), and the point where motion changed between outside to inside and inside to outside (transition phase) (Arellano et al., 2006; Homma & Homma, 2006 and Martins et al., 2006). Sculling actions purpose is the production of hydrodynamic force. This force will allow support, balance and propulsion of the swimmer’s body (Barthels, 1979; Chu, 1999; Ito, 2006; Martins et al., 2006; Miwa et al., 2010; Homma, 2010). However, there are several factors that may influence the sculling force production, particularly the hand configuration, regarding hydrodynamic characteristics, which can provide different production of lift force, constraining the best performance (Ito, 2006). Additionally, the relative contribution of the hand to the propulsive force is dependent on the arm configuration (Lauder and Dabnichki, 2005). Propulsive force is an important determinant of swimming performance (Toussaint and Beek, 1992; Lauder et al., 2001; Matsuuchi et al., 2009; Sanders and Psycharakis, 2009; Barbosa, 2010; Rouard, 2010; Morouço et al., 2011), and swimming is characterized by the intermittent application of a propulsive force to overcome a velocity- dependent water resistance (drag). So, swimmer’s performance is limited by their ability to produce propulsive force, to minimize the drag forces resisting forward motion and to reduce energy cost (Toussaint and Beek, 1992; Gardano & Dabnichki, 2006; Marinho et al., 2009a; Craig Jr and Pendergast, 1979; Rouard, 2010). Strength training (with emphasis on neural adaptations) explains, in part, the specific positive changes in velocity and aerobic performance due to a better economy of movement (Hoff et al., 2002; Osteras et al., 2002) and, synchronized swimming is a sport with strength demands (Chu, 1999). The above mentioned factors are highly trainable, even among elite swimmers (based on Pendergast et al., 2006). Tethered swimming is a highly reliable method of measuring propulsive force, being shown that it is similar to free swimming (Costil et al., 1986; Chistensen and Smith, 1987; Lee and Payton, 2010; Cortesi, 2010). The propulsive forces, 2.
(25) for example in front crawl, are mainly generated by the arm movements (Hollander et al. 1988), particularly by the forearms and hands (Berger et al. 1995). In addition propulsive forces were strongly linked to kinematic hand parameters (Schleihauf 1979; Berger et al. 1995). The deterioration of propulsive force (decreases in the power-producing capacity of the swimmer) and sculling mechanics during synchronized swimming may be attributed to fatigue (Zamparo, 2005 and Toussaint 2006). Fatigue is a phenomenon that had its origin in the study of human performance and could be defined as a general concept intended to denote an acute impairment of performance that includes both an increase in the perceived effort necessary to exert a desired force and an eventual inability to produce this force (Enoka and Stuart, 1992; Toussaint and Beek, 1992). Studies carried out in synchronized swimming are scarce and despite the importance of sculling in this sport, few studies were conducted and none seems to have compared standard and contra-standard sculling, the force produced by the swimmer and the appearance of fatigue during sculling. In addition, studies evaluating the relationship between force production in tethered swimming and swimming kinematics are scarce and none appears to have studied it in synchronized swimming. To our knowledge, the studies, made until today, in synchronized swimming reported to five general areas: (i) history (e.g. Terret, 2005); (ii) psychology - eating disorders (e.g. Ferrand, 2005; Perini et al., 2009), interactions (e.g. Auweele, 2004; Erikson et al., 2011), sensoperception (e.g. Cabrera, 2008), visual training (e.g. Ahmed and Shosha, 2010), body image (e.g. Urdapilleta et al., 2010), morphological prototypes (e.g. Hawes and Sovak, 1994), passion and performance (e.g. Vallerand et al., 2008), and performance scores (e.g. Gambarelli, 2008); (iii) traumatology sport injury (e.g. Weinberg, 1986; Mountjoy, 1999; Chu, 1999; Mountjoy, 2009; Junge et al., 2009); (iv) physiology – physiological parameters (e.g. Figura e tal., 1993; Chatard et tal., 1999; Jamnik, 1986; Yamamura et al., 2000; Pazikas et tal., 2005; Maydanyuk et al., 2007), levels of hypoxia (e.g. Davies et al., 1993; Davies et al., 1995; Chatard et tal., 1999; Orellana et al., 2006; Alentejano et al., 2008; Alentejano et al., 2010); airway responsiveness (e.g. 3.
(26) Bougault et al., 2010; Gabrilo, 2011); body composition (e.g. Moffat et al., 1980; Mazza et al., 1994; Carter and Jones, 1994; Drinkwater and Mazza, 1994; Martínez et al., 2010) (v) biomechanics - sculling in vertical position of the body (e.g. Homma and Homma, 2006; Homma, 2010; Gomes and Loss, 2010; Gomes et al., 2010), eggbeater kick (e.g. Homma and Homma, 2005; Homma, 2010), and configurations of hand palms (e.g. Ito, 2007). In this sense, the purpose of this Thesis is to study, of both standard and contra-standard sculling, the force parameters (the absolute and relative maximal forces, the time at which maximal force occurred, the mean force, the average of maximal force and the average of minimal force), using a 30s maximal tethered test, the appearance of fatigue during sculling, and the changes in kinematics parameters (displacement, velocity and acceleration of the hand and angular displacement, velocity and acceleration of the elbow and wrist), using 3D video images captured during the tethered swimming test and the relation between kinematic and force parameters. This thesis begins with a pilot study (Chapter 2) whose purpose was to measure the maximal force produced in standard and contra-standard sculling, using a 30s maximal tethered synchronized swimming test. A former female synchronized swimmer and a former female swimmer were studied. This study allowed also to understand differences between synchronized swimmers and swimmers. Studies carried out in synchronized swimming are very scarce, namely those which include biomechanical analysis of the sculling technique; so, the parameters studied were maximal, mean and minimum force, the time when maximal and minimum force occurred, and fatigue index. Understanding the importance of increasing the sample size, it was conducted a new study, with thirteen female synchronized swimmers from national level, in order to measure the force parameters and the fatigue produced in standard and contra-standard sculling in synchronized swimming, using a 30s maximal tethered test (Chapter 3). To our knowledge, besides the case study of our group (presented in chapter 2), this is the first time that individual force to time curves and fatigue index, characterizing standard and contra-standard sculling actions, were assessed. Once again, the variables studied were absolute and 4.
(27) relative maximal force, the time when maximal force occurred, the mean force, the mean values of maximal and minimal force, and the fatigue index. In Chapter 4, the last study of this thesis is presented. Although the importance of sculling in synchronized swimming is undeniable, very few studies were conducted and none seems to have studied the force produced by the swimmer and the appearance of fatigue during sculling besides studies of our group (presented in chapter 2 and 3); furthermore, propulsive mechanism of sculling motion also has not been clearly explained yet (Miwa, 2010). However, it is known that propulsive forces are strongly linked to kinematic hand parameters. Hand force has received considerable attention in the swimming literature but limited information is available to coaches and swimmers on the fluctuations in force throughout a stroke cycle and despite the importance of this information, in the synchronized swimming do not appear to be studies in this area. Lastly, a general discussion is presented based upon the results obtained from the three independent studies and with the reports of the specialized literature (Chapter 5); in this chapter some suggestions for future studies are also presented. The main corresponding conclusions are also presented (Chapter 6) and, finally, all references used are presented in Chapter 7.. 5.
(28) 6.
(29) CHAPTER 2. Quantification of maximal force produced in standard and contra-standard sculling in synchronized swimming. A pilot study. Diogo V1, Soares S1, Tourino C2, Carmo C1, Aleixo I1, Morouço P1,3, Figueiredo P1, Vilas-Boas JP1, Fernandes RJ1 1. Centre of Research, Education, Innovation and Intervention in Sport, Faculty. of Sport, University of Porto, Portugal 2 3. Faculty of Science of Education and of Sport, University of Vigo, Spain Center of Research for Human Movement Sciences, Polytechnic Institute of. Leiria, Portugal. Published on Open Sports Science Journal (2010), 3: 81-83.. 7.
(30) ABSTRACT Studies carried out in synchronized swimming are very scarce, namely those which include biomechanical analysis of the sculling technique. The purpose of this study was to measure the maximal force produced in standard and contrastandard sculling, using a 30s maximal tethered synchronized swimming test. One former female synchronized swimmer and one former female swimmer performed a 2x30s maximum intensity tethered synchronized swimming test, in standard and contra-standard sculling conditions, respectively. Parameters studied were maximal, mean and minimum force, the time when maximal and minimum force occurred, and fatigue index. Results showed that the higher values of maximal and mean force were found in standard sculling, both for the synchronized swimmer and the swimmer. The swimmer attained higher values of absolute and relative maximal force in the standard sculling, but lower values in the contra-standard technique, when compared to the synchronized swimmer. Fatigue Index results evidence that the maximal force declined during the 30s in both participants and in both sculling conditions. This parameter was higher for the contra-standard sculling performed by the swimmer, and for the standard sculling for the synchronized swimmer. In conclusion, there were differences in force production in standard and contra-standard sculling between a swimmer and a synchronized swimming. Those differences could probably be explained by differences in skill competence. Keywords:. Biomechanics,. sculling,. swimming.. 8. synchronized. swimming,. tethered.
(31) INTRODUCTION Synchronized swimming is a complex and physically demanding sport, in which the strength demands and the velocity of movements is combined with high flexibility requirements [1, 2]. In this sport, sculling is an often used technique [1], consisting in underwater arm stroke patterns, with the objective of producing a hydrodynamic force that allows support, balance and propulsion to the swimmer’s body [1, 3]. Although the importance of sculling is undeniable in synchronized swimming, very few studies are known, and none seems to have quantified the maximal force (Fmax) produced by the swimmer. Knowing that there is a high relationship between force and performance in swimming [4], and that strength training (with emphasis on neural adaptations) explains, in part, the specific positive changes in velocity and aerobic performance due to a better economy of movement [5, 6], the purpose of this study was to measure the Fmax produced in standard and contra-standard sculling, using a 30s maximal tethered synchronized swimming test.. METHODS One former female synchronized swimmer (32 years old, height 1.65 m, body mass 49.7 kg and 5 years of practice) and one former female swimmer (26 years old; height, 1.67 m; body mass, 58 kg and 12 years of practice) volunteered to participate in the present study. A 30s tethered swimming protocol was used in order to determine individual force to time - F(t) - curves, in two conditions: (i) standard sculling (movement towards the head, with the body placed in supine position, the arms in the lateral of the trunk, the wrist in dorsal flexion and the hand oriented toward the feet) and (ii) contra-standard sculling (movement towards the feet with the body in supine position, the arms in the lateral of the trunk, the wrist in palmar flexion and the hand oriented towards the head). After a familiarization with the equipment and a standardized warmup, each subject performed a 30s maximum intensity tethered synchronized swimming test. Individual F(t) curves were obtained with the subjects attached by a non-elastic cable to a strained9.
(32) gauge system (Globus, Italy). The beginning and the end of the test were established through an acoustical signal produced by the researcher. Tests were conducted in an indoor, heated (27.5ºC) and 2 m deep swimming-pool. Microsoft Office Excel 2003 was used to compute the relative maximal force (Relative Fmax = Force/Weight), the average of maximal force (FmaxAvg = average of the five highest values during the test) and the fatigue index (FI (%) = ([Fmax–Fmin)/Fmax]x100).. RESULTS Values of Fmax and minimal force (Fmin), as well as the time when these values occurred, are presented in Table 1 in both standard and contra-standard sculling for the two subjects studied. Additionally, the relative Fmax, FmaxAvg and the FI can also be observed.. Table1. Values of maximal (absolute and relative) and minimal force (Fmax, relative FMax and Fmin, respectively), the time when these values occurred, the average of maximal force (FmaxAvg) and fatigue index (FI) in standard and contra-standard sculling in both participants. synchronized. synchronized. swimmer. swimmer. swimmer (standard). swimmer. (standard). (contra-standard). (contra-standard) Fmax (N). 31.47. 26.83. 41.85. 19.31. Relative Fmax (N.Kg ). 0.63. 0.54. 0.72. 0.33. FmaxTime (s). 2.50. 2.80. 3.70. 3.25. -1. Fmin (N). 0.36. 2.86. 3.93. 0.36. FminTime (s). 10.45. 11.05. 26.65. 22.00. FmaxAvg (N). 29.26. 25.89. 35.05. 18.24. FI (%). 78.40. 18.27. 61.34. 71.50. It is possible to observe that both for the synchronized swimmer and the swimmer the higher values of Fmax and FmaxAvg were both found in standard sculling. Comparing the subjects, it is possible to observe that the swimmer attained higher values of Fmax and relative Fmax in the standard sculling, but lower values in the contra-standard technique, when compared to the synchronized swimmer. The values of FI evidence that the Fmax, despite all the 10.
(33) fluctuations (cf. an example in Figure 1), declined during the 30s in both participants and in both sculling conditions. Interestingly, this parameter was higher for the contra-standard sculling performed by the swimmier, and for the standard sculling for the synchronized swimmer. 35 30. Force (N). 25 20 15 10 5 0 -5. 0. 5. 10. 15. 20. 25. 30. Time (s). Figure 1. Example of an individual F(t) curve in standard sculling of the synchronized swimmer. DISCUSSION Nonetheless the fact that the present study is conducted only with two subjects, and that both are former athletes, it is the first time that Fmax (and even FI) produced in standard and contra-standard sculling was assessed. Earlier studies conducted in swimming showed that the relationship between the forces exerted during the tethered swimming test varies according to age, maturation state and competitive level [7, 8]. Indeed, the difference in age may be one of the explanations for the differences in the levels of force attained by our subjects. However, it seems that this is not the main reason for the obtained results, because swimmer (which is younger) only reaches higher levels of force (absolute and relative) in standard sculling. Thus, the higher resemblance between swimming and standard sculling can be the main explanation. These facts can be evidenced using video images during the tethered swimming test, which will enable a detailed analysis of the sculling movement. This procedure will be carried out in future studies. An attempt to compare the presented results to the specialized literature was not fruitful because reference values of force in synchronized swimming were not found. Swimming studies show that swimmers reach significantly higher levels of force compared to those observed in the present study, which may occurred due to: (i) wider amplitudes of the front crawl underwater phases; (ii) higher propulsive continuity in front crawl due 11.
(34) the existence of three underwater phases in opposition to sculling that only have two phases [9]; and (iii) the use of both upper and lower limbs. Complementarily, both subjects are former swimmers, which can explain the low values of force and the high values of FI comparing to trained swimmers (cf. [10]). Morouço et al. [10] mentioned that swimmers who reach high peaks of force are not able to maintain their values for so long, which is not supported by these data. The swimmer reached a higher peak of force in standard sculling and also reached minimal values of force later than synchronized swimmer. Moreover, the lowest fatigue index that the swimmer attained also was in standard sculling movement. This can be explained by reasons already mentioned above: the swimmer is younger, quit training more recently, practiced for more years, and possibly has a better physical general condition. Comparing standard with contra-standard sculling, the synchronized swimmer and the swimmer produced more intense forces in standard sculling. However, the difference between the Fmax of both sculling is greater in the swimmer, wherever the Fmax of standard sculling is much higher than the contra-standard sculling. These results were expected since synchronized swimmers are much more used to perform contra-standard sculling motions than the swimmer.. 12.
(35) CHAPTER 3. Tethered Force Production in Standard and Contra-standard Sculling in Synchronized Swimming. Diogo, V. 1, Soares, S. 1, Tourino, C. 2, Abraldes, J.A. 3, Ferragut, C.4, Morouço, P.5, Figueiredo, P. 1, Vilas-Boas, J.P. 1, Fernandes, R.J. 1 1. University of Porto, Faculty of Sport, Cifi2d, Porto, Portugal. 2. University of Vigo, Faculty of Education and Sport Sciences, Spain. 3. University of Murcia, Faculty of Sports Sciences, Murcia, Spain. 4. Catholic University of Murcia, Faculty of Sports Sciences, Murcia, Spain. 5. Polytechnic Institute of Leiria, CIMH, Portugal. Published on Biomechanics and Medicine in Swimming XI (2010). Norwegian School of Sport Science, pp. 67-69.. 13.
(36) ABSTRACT Studies carried out in synchronized swimming are scarce, inclusively with respect to the biomechanical analysis of sculling. The purpose of this study was to measure the force produced in standard and contra-standard sculling, using a 30s maximal tethered synchronized swimming test. 13 synchronized swimmers performed a 2x30s maximum intensity tethered synchronized swimming. test,. in. standard. and. contra-standard. sculling. conditions,. respectively. The variables were: absolute and relative maximal force, the time when maximal force occurred, the mean force, the mean values of maximal and minimal force, and the fatigue index. Results showed that higher values of maximal force were found in the standard sculling. The Fatigue Index evidenced that the maximal force declined with time in all participants and in both sculling conditions. Key words:. biomechanics,. sculling,. swimming. 14. synchronized. swimming,. tethered.
(37) INTRODUCTION Synchronized swimming is a technical and physically demanding sport, in which the strength and the velocity of movements are combined with high flexibility requirements (Chu, 1999). In this sport, sculling is an often-used technique, consisting in underwater arm stroke patterns whose purpose is the production of hydrodynamic force. This force will allow support, balance and propulsion of the swimmer’s body (Chu, 1999). Although the importance of sculling in synchronized swimming is undeniable, very few studies were conducted, and none seem to have quantified the force produced by the swimmer. The appearance of fatigue during sculling was also not yet studied. Knowing that there is a high relationship between strength and performance in swimming (Risch and Castro, 2007), and that strength training (with emphasis on neural adaptations) explains, in part, the specific positive changes in velocity and aerobic performance due to a better economy of movement (Hoff et al., 2002), the purpose of this study was to measure the force and the fatigue produced in standard and contra-standard sculling in synchronized swimming, using a 30s maximal tethered test.. METHODS Thirteen synchronized swimmers with the same performance level volunteered to participate in this study. Their main physical characteristics are presented in Table 1.. 15.
(38) Table 1. Individual and Mean ± SD values of physical characteristics of the synchronized swimmers (n=13). Participants. Age (years). Mass (kg). Height (cm). Arm span (cm). #1. 16,0. 51,3. 156,0. 156,0. #2. 16,0. 52,3. 158,0. 161,0. #3. 15,0. 57,6. 167,0. 170,0. #4. 18,0. 44,7. 157,7. 154,0. #5. 14,0. 44,9. 159,0. 156,0. #6. 15,0. 44,2. 164,0. 165,0. #7. 18,0. 62,8. 162,0. 167,0. #8. 11,0. 33,2. 149,5. 143,0. #9. 14,0. 45,6. 161,0. 158,0. #10. 17,0. 52,8. 157,0. 153,0. #11. 18,0. 63,0. 170,2. 174,0. #12. 15,0. 54,6. 177,0. 179,0. #13. 18,0. 49,8. 153,0. 160,0. 15.8 ± 2.1. 50.5 ± 8.2. 160.9 ± 7.4. 161.2 ± 9.7. Mean ± SD. A 30s tethered swimming protocol was used in order to determine individual force to time - F(t) - curves in two conditions: (i) standard sculling (movement towards the head, with the body placed in supine position, the arms in the lateral of the trunk, the wrist in dorsal flexion and the hand palm oriented toward the feet) and (ii) contra-standard sculling (movement towards the feet with the body in supine position, the arms in the lateral of the trunk, the wrist in palmer flexion and the hand palm oriented towards the head). After familiarization with the equipment and a standardized warm-up, each subject performed a 30s maximum intensity tethered synchronized swimming test. Individual F (t) curves were obtained with the subjects attached by a non-elastic cable to a straingauge system (Globus, Italy). The beginning and the end of the test were established through an acoustical signal produced by a researcher. Tests were conducted in an indoor, heated (27.5ºC), and 2m deep swimming-pool. The absolute and relative maximal forces (Fmax and RFmax, being RFmax = Force.body weight-1), the time at which Fmax occurred (FmaxTime), the mean force (Fmean), the average of Fmax (FmaxAvg = average of all force values in the first 5 s of the test), the average of minimal force (FminAvg = average of all force values in the last 5s of the test) and the fatigue index (FI (%) = 16.
(39) ([FmaxAvg-FminAvg)/FmaxAvg]x100) were computed. The force values of the first 2s test were eliminated in order to remove the high inertial values associated with the first pull (Fig. 1). After the normality of the distributions was confirmed (Kolmogorov-Smirnov test), T-Test for repeated measures was used to compare mean values of each variable obtained for standard and contra standard sculling techniques. Pearson product-moment correlation coefficient was also computed for the study of relevant association of variables. Significance level was established at 5%.. RESULTS Absolute and relative values of Fmax, FmaxTime, Fmean, FmaxAvg, FminAvg and the FI are presented in Tables 2 and 3 for standard and contra-standard sculling.. Table 2. Individual and Mean ± SD values of absolute maximal (Fmax) and relative (Relative Fmax) force, the time when the Fmax occurred (Fmax Time), mean force (Fmean), the average of maximal and minimum forces (FmaxAvg and FminAvg, respectively) and the fatigue index (FI) in standard sculling (n=13). Swimmer. Fmax (N). Relative Fmax. FmaxTime. Fmean. FminAvg. FmaxAvg. (N.Kg ). (s). (N). (N). (N). -1. FI (%). #1. 30,8. 0,60. 4,9. 12,9. 8,7. 15,8. 44,7. #2. 42,9. 0,82. 7,0. 22,1. 19,8. 25,5. 22,3. #3. 36,1. 0,63. 2,7. 21,5. 16,4. 26,5. 38,3. #4. 18,6. 0,42. 2,6. 5,6. 3,9. 10,3. 61,8. #5. 33,3. 0,74. 8,6. 14,0. 9,2. 20,6. 55,4. #6. 50,1. 1,13. 4,2. 24,8. 20,4. 32,5. 37,2. #7. 51,9. 0,83. 7,9. 26,8. 24,7. 29,9. 17,5. #8. 23,9. 0,72. 6,7. 7,0. 4,7. 10,6. 55,8. #9. 39,7. 0,87. 5,5. 14,1. 8,2. 18,9. 56,9. #10. 39,0. 0,74. 2,5. 20,1. 14,4. 26,0. 43,2. #11. 62,6. 0,99. 4,3. 14,0. 5,8. 26,4. 78,1. #12. 49,4. 0,90. 3,4. 9,8. 4,9. 14,7. 66,8. #13. 51,9. 1,04. 8,2. 24,0. 20,6. 30,1. 31,6. 40.8±12.4. 0.80±0.19. 5.3±2.2. 16.7±7.0. 12.4±7.3. 22.1±7.5. 49.9±17.6. X ± SD. For almost all the subjects, higher absolute and relative Fmax values were found in standard sculling (Table 2 and 3). Mean differences were statistically 17.
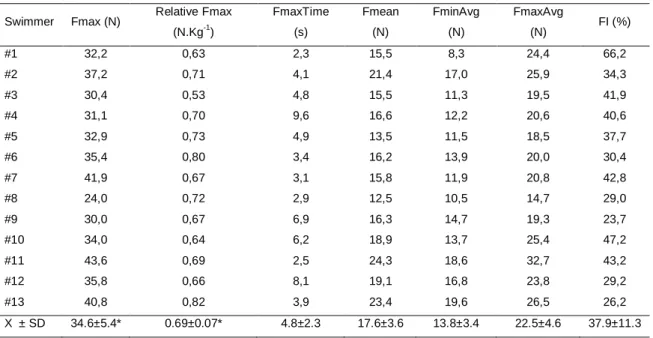
(40) significant for both values. The values of FI evidence that the F, despite all the fluctuations observed (cf. an example in Fig. 1), decreased during the 30s effort in all participants and in both sculling conditions. With the exception of Fmax absolute and relative values, none of the remaining variables showed statistical significant differences between standard and contra-standard sculling actions. The correlation study demonstrated the following findings: (i) age correlated significantly with Fmax (r=0.77), with Fmean (r=0.66), and with FmaxAvg (r=0.71), but only for the contra-standard action; (ii) body mass correlated significantly with Fmax (r=0.66 and r=0.76) and with FmaxAvg (r=0.51 and r=0.66), respectively, for the standard and contra-standard sculling; (iii) body height only correlated with Fmax (r=0.54) for the standard sculling; (iv) arm span correlated significantly with Fmax for both sculling actions (r=0.73 for the standard and r=0.63 for the contra-standard) and (v) FI correlated negatively with FmaxAvg (r=-0.58) and Fmean (r=-0.81) for standard action, and with FminAvg (r=-0.91 and r=-0.54) for both sculling variants.. Table 3. Individual and Mean ± SD values of absolute maximal (Fmax) and relative (relative Fmax) force, the time when the Fmax occurred (Fmax Time), mean force (Fmean), the average of maximal and minimum forces (FmaxAvg and FminAvg, respectively) and the fatigue index (FI) in contra-standard sculling (n=13). Swimmer. Fmax (N). Relative Fmax. FmaxTime. Fmean. FminAvg. FmaxAvg. (N.Kg ). (s). (N). (N). (N). -1. FI (%). #1. 32,2. 0,63. 2,3. 15,5. 8,3. 24,4. 66,2. #2. 37,2. 0,71. 4,1. 21,4. 17,0. 25,9. 34,3. #3. 30,4. 0,53. 4,8. 15,5. 11,3. 19,5. 41,9. #4. 31,1. 0,70. 9,6. 16,6. 12,2. 20,6. 40,6. #5. 32,9. 0,73. 4,9. 13,5. 11,5. 18,5. 37,7. #6. 35,4. 0,80. 3,4. 16,2. 13,9. 20,0. 30,4. #7. 41,9. 0,67. 3,1. 15,8. 11,9. 20,8. 42,8. #8. 24,0. 0,72. 2,9. 12,5. 10,5. 14,7. 29,0. #9. 30,0. 0,67. 6,9. 16,3. 14,7. 19,3. 23,7. #10. 34,0. 0,64. 6,2. 18,9. 13,7. 25,4. 47,2. #11. 43,6. 0,69. 2,5. 24,3. 18,6. 32,7. 43,2. #12. 35,8. 0,66. 8,1. 19,1. 16,8. 23,8. 29,2. #13. 40,8. 0,82. 3,9. 23,4. 19,6. 26,5. 26,2. 34.6±5.4*. 0.69±0.07*. 4.8±2.3. 17.6±3.6. 13.8±3.4. 22.5±4.6. 37.9±11.3. X ± SD. *Different (p<0.05) from respective value of standard sculling (table 2).. 18.
(41) Force (N). 70 65 60 55 50 45 40 35 30 25 20 15 10 5 0 -5 0 -10. 5. 10. 15. 20. 25. 30. Time(s). Figure 1. Example of an individual F(t) curve (unfiltered data) in standard sculling. The cut point of the two first s of force values, correspondent to the first pull, is marked.. DISCUSSION To our knowledge, besides a case study of our group (Diogo et al., in press), this is the first time that F (t) curves and FI, characterizing standard and contrastandard sculling actions, were assessed. Comparing the present results with the specialized literature was not possible since values of force (or tethered force), and FI assessed in synchronized swimming were not found. Studies conducted with swimmers showed significantly higher levels of semi-tethered or tethered force compared to those of the present study (e.g. Kjendlie e Thorsvald, 2006; Strojnik et al., 1999; Wirtz et al., 1999), which may be explained by: (i) longer amplitudes of the front crawl underwater phases; (ii) higher front crawl propulsive continuity, due to the existence of three underwater phases, in opposition to the sculling technique that only have two phases (Rackham, 1974) and (iii) the use of both upper and lower limbs during swimming. Accordingly to the significant difference found between mean values, almost all the synchronized swimmers reached higher values of Fmax in standard sculling comparing to the contra-standard condition. A similar result was observed in our pilot study in which the force values produced by a synchronized swimmer and a female swimmer in standard and contra-standard sculling were compared (Diogo et al., in press). Fmax values were higher in standard sculling in both 19.
(42) subjects. We hypothesized that this higher Fmax production in standard sculling may be due to a higher resemblance of the standard sculling with the swimming movements and to the possibility of being a more “natural” action from the anatomical point a view. Earlier studies conducted in swimming showed that the relationship between the maximal, mean and minimum forces exerted during the tethered swimming test varies according to age, maturational state and competitive level (Sidney et al., 1996; Vorontsov et al., 1999; Morouço et al., 2008). Indeed, the difference in age and maturational state may contribute to explain the differences in force levels attained by our subjects. The correlation value obtained between age and the other variables showed a significant relationship with Fmax only in contrastandard sculling. Height can be another explanation for the above-referred results, as there is a direct relationship between this parameter and peak force (Risch and Castro, 2007). Eventually, longilineal individuals produce lower values of hydrodynamic resistance, reflecting higher peak force values in tethered swimming (Toussaint and Beek, 1992), which is consistent with the significant relationship between body height and Fmax obtained in the present study. However, once in tethered swimming the displacement of the swimmer relatively to the water is null, this effect is more likely related to a scaling effect, being the functionality of muscles related to the square, or the cube of the linear dimensions (depending on considering the muscle cross sectional area or the muscular volume). There may also be other factors that may influence the sculling force production,. namely. the. hand. configuration,. regarding. hydrodynamic. characteristics, which can provide different production of lift force constraining the best performance (Ito, 2006). Additionally, the relative contribution of the hand to the propulsive force is dependent on the arm configuration (Lauder and Dabnichki, 2005). Unfortunately, we did not dispose of video images during the tethered swimming test, which would enable a detailed analysis of the sculling movement. However, we dispose of the arm span measurements. In fact, since it is commonly accepted that longer limbs will imply higher propulsion, it was not surprising to observe a high direct relationship between arm span and Fmax. 20.
(43) Moreover, it is known that the differences in force level can also be explained by differences in technical level (Risch and Castro, 2007). However, once again, this relationship could only be tested with the use of video images during the tethered swimming test, which will enable a detailed analysis of the sculling movement. Morouço et al. (2008) mentioned that swimmers who reach high peaks of force are not able to maintain it for long periods of time. This statement is not supported by the present data, since an inverse relationship were observed between FI and FmaxAvg and Fmean (standard action), and with relative Fmax (contra-standard action). In contrast, FI presented significant negative correlation values with FminAvg in both sculling conditions, which means that fatigue is less visible in the swimmers who have higher average of minimum peak forces. This result appeals for a kinematic plus tethered force production combined analysis of the sculling movement, once swimmers with higher FminAvg seems to be more proficient. CONCLUSION The principal difference observed in force production between standard and contra-standard sculling was found for Fmax, with its absolute and relative values being higher for standard sculling. Mean force decreased during the 30s effort in all participants and in both sculling conditions.. 21.
(44) 22.
(45) CHAPTER 4. Kinematic and Kinetic Analyses of Standard and Contra-Standard Sculling in Synchronized Swimming. Diogo, V. 1, Soares, S. 1, Tourino, C. 3, Figueiredo, P. 1, Vilas-Boas, J.P.. 1,2. ,. Fernandes, R.J. 1,2 1 2. CIFI2D, Faculty of Sport, University of Porto, Porto, Portugal Porto Biomechanics Laboratory (LABIOMEP), University of Porto, Porto,. Portugal 3. University of Vigo, Faculty of Education and Sport Sciences, Spain. To submit for publication in Journal of Applied Biomechanics.. 23.
(46) ABSTRACT Studies carried out in synchronized swimming are scarce, particularly concerning the biomechanical analysis of sculling. The purpose of the present study was to observe the changes in kinematic parameters and force in a 30s maximal tethered synchronized swimming test, as well as, the relation between kinematic and force parameters. Six synchronized swimmers from national level participated in this study. Four underwater digital video cameras (Sony DCRHC42E) at a frequency of 50Hz were used to record a 2x30s maximum intensity tethered synchronized swimming test, in standard and contra-standard sculling conditions. The spatial coordinates of selected points were calculated using the DLT procedure and displacements, velocities and accelerations were calculated for the hands and the angular velocities and angular accelerations were calculated for the wrist and elbow joints. It were also assessed the absolute and relative maximal force, the time when maximal force occurred, the mean force, the mean values of maximal and minimal force, and the fatigue index. Results showed that, in general, higher values of maximal force were found in the standard sculling (e.g. 43.37N for standard sculling and 38.07N for contrastandard sculling), however, mean differences were not statistically significant, as well as for the remaining variables except sculling frequency (2.36Hz for standard sculling and 2.00Hz for contra-standard sculling) and sculling duration (0.43s for standard sculling and 0.51s for contra-standard sculling). The fatigue index evidenced that the maximal force declined with time in all participants and in both sculling conditions. The onset of fatigue reduces the capacity to scull at a high propelling efficiency as well as the capacity to deliver a high amount of work per sculling. Synchronized swimmers tend to modify the sculling kinematic parameters as their fatigue increases and that can be due to a reduction in force production. So, we can conclude that there are a connection between kinematic sculling parameters and force sculling parameters. Key words: Digitization, 3D, stroke parameters, tethered-swimming, force.. 24.
(47) INTRODUCTION Synchronized swimming is a highly artistic, technical and physically demanding sport, in which the strength and the velocity of movements are combined with high flexibility requirements (Chu, 1999; Ito, 2006). Sculling is the essence of this sport, existing two major sculling types performed in horizontal body position: standard sculling (movement towards the head) and, contra-standard sculling (movement towards the feet). Both actions consists in an underwater hand motion that describes a “figure 8” or an egg-shaped oval path, whose principal purpose is the production of propulsive forces, but also allows support and balance the swimmer’s body (Chu, 1999; Ito, 2006; Miwa et al., 2010; Homma, 2010). It seems consensual that propulsive force is an important determinant of swimming performance (Toussaint and Beek, 1992; Payton and Bartlett, 1995; Sanders and Psycharakis, 2009; Rouard, 2010; Morouço et al., 2011). So, swimmer’s performance is limited by their ability to produce propulsive force, but also to minimize the drag forces resisting forward motion, and to reduce energy cost (Toussaint and Beek, 1992; Payton and Bartlett, 1995; Rouard, 2010). The measurement of the propulsive has been of interest to swimming biomechanics for many years (Dopsaj et al., 2003; Marinho et al., 2011; Morouço et al., 2011). However, propulsive mechanism of sculling motion was not been clearly explain yet (Miwa, 2010). Tethered swimming is a highly reliable method of measuring propulsive force, being shown to be similar to free swimming (Chistensen and Smith, 1987; Cortesi, 2010). The propulsive forces, for example in front crawl, are mainly generated by the arm movements, particularly by the forearms and hands (Berger et al. 1995); in addition, propulsive forces were strongly linked to kinematic hand parameters (Schleihauf 1979; Berger et al. 1995). The deterioration of propulsive force (decreases in the power-producing capacity of the swimmer), and sculling mechanics during synchronized swimming may be attributed to fatigue (Zamparo, 2005 and Toussaint 2006). Nevertheless the importance of sculling in synchronized swimming, few studies were conducted, and none seems to analyse both standard and contra25.
(48) standard actions, the force produced by the swimmer and the appearance of fatigue during a prolonged sculling besides only a previous study of our group (Diogo et al., 2010). In addition, studies evaluating the relationship between force production in tethered swimming and swimming kinematics are scarce and none appears to be conducted in synchronized swimming. Therefore, the purpose of the present study was to observe the changes in kinematic and force parameters in a 30s maximal tethered synchronized swimming test, as well as, the hypothetical relationship between kinematic and force parameters.. METHODS Sample Six synchronized swimmers from national level volunteered to participate in this study. Their main physical characteristics were: 17.5±0.8 year’s old, 54.1±7.4 kg body mass, 159.3±6.1cm height, 160.7±8.3cm of arm span, 7.59±1.82cm of width of the hand and 17.25±1.34cm of hand length.. Kinematic Analysis Four underwater fixed digital video cameras (Sony® DCR-HC42E, Nagoya, Japan), with an angle between them that varied from ~75º to 110º, recorded simultaneously and synchronously at a frequency of 50Hz. A complex volume calibration (3x2x3m in the horizontal (x), vertical (z) and lateral (z) directions, respectively), with crossed horizontal rods, was positioned in the swimming pool (cf. Figure 1) with the centre at an equal distance from each camera, which were placed at 1.0 to 1.5m depths to avoid error due to its axes being in the same reference planes of the volume (cf. Figueiredo, 2011). The size of the calibration frame was established to allow a complete horizontal sculling cycle of synchronized swimming. According to Figueiredo (2011), this volume calibration is suitable for synchronized swimming since its actions are mostly in y and z axes. The swimmers were marked with black tape in the following landmarks: distal end of the third finger, metacarpophalangeal joints of the. 26.
(49) second and fifth finger and thumb, center of the wrist joint, elbow, and acromion of the right and left limb.. Figure 1. Volume calibration used in the kinematic analysis.. Since the sculling movement is a repeated motion, only twelve cycles were manually digitized and analyzed: three consecutive cycles at 20%, 40%, 60% and 80% of the test. In this experiment, the right and left arm of every cycle of the sculling, starting from outside, was analyzed. Based on Homma and Homma (2006), sculling was divided in four phases: the in-scull (the stroke phase from outside to inside), the out-scull (the stroke phase from inside to outside) and the transition phase (the point where motion changed between outside to inside and inside to outside). Capture videos were manually digitized using software APASystem (Ariel Dynamics, San Diego, USA), and the spatial coordinates of selected points were calculated using the direct linear transformation procedure (Abdel-Aziz and Karara, 1971) with eight control points; the displacements (3D distance of the endpoints of sculling in lateral directions (z), HD), speeds (measurement of the rate of change in the position of the hand, HS) and accelerations (the rate of change of speed over time, HA) of the hand were calculated and analyzed, and the angular velocities (quantitative expression of the flexion and extension of the arm with the forearm and the forearm with the hand per unit time), and angular acceleration (rate of change of angular velocity over time) were calculated and analyzed for the elbow and wrist joints (EAD, WAD, EAV, WAV, EAA and WAA, respectively) in two conditions: (i) standard sculling (movement towards the head, with the body placed in supine position, the arms in the lateral of the trunk, the wrist in dorsal flexion and the hand palm oriented toward 27.
(50) the feet (cf. figure 2, left panel) and (ii) contra-standard sculling (movement towards the feet with the body in supine position, the arms in the lateral of the trunk, the wrist in palmar flexion and the hand palm oriented towards the head (cf. Figure 2, right panel). Sculling parameters were also studied, particularly the sculling frequency (SF as the ratio between the total number of complete cycles of sculling in the 30s of the test by its duration) and the sculling duration (SD as the mean duration of 12 complete cycles of sculling starting from outside, three consecutive at the 20, 40, 60 and 80% of the test).. Figure 2. Example of standard (left panel) and contra-standard sculling (right panel).. Kinetic analysis A 30s tethered swimming protocol was used in order to determine individual force to time - F(t) - curves in standard and contra-standard sculling. After familiarization with the equipment and a standardized warm-up, each subject performed a 30s maximum intensity tethered synchronized swimming test. Individual F(t) curves were obtained with the subjects attached by a non-elastic cable to a strain-gauge system with a frequency of 20Hz (Globus, Codognè, Italy). The beginning and the end of the test were established through an acoustical signal produced by a researcher. Tests were conducted in an indoor 25m swimming-pool, heated (27.5ºC), and 1.90m deep. The absolute and relative maximal forces (Fmax and RFmax, being RFmax = Force.body mass-1), the time at which Fmax occurred (FmaxTime), the mean force (Fmean), the average of Fmax (FmaxAvg = average of all force values in the first 5s of the test), the average of minimal force (FminAvg = average of all force values in the last 5s of the test) and the fatigue index (FI (%) = ([FmaxAvg-FminAvg)/FmaxAvg]x100) were computed. The force values of the first 2s test were eliminated in order to remove the high inertial values associated with the first pull (cf. Diogo et al., 2010). 28.
(51) As strain-gauge system and digital video cameras had a different frequency, a resample of the values of force was made for a frequency of 50Hz with software developed in Matlab (Massachusetts, USA). The temporal synchronization between video cameras and the strain-gauge system was made using Biopac with the Aknowlegde 3.9.1 software (California, USA) and with a LED system visible in the field of view of each camera. Statistical analysis Statistical analysis was conducted using SPSS computer software version 17.0 for Windows (SPSS Inc., Chicago, USA). Although the normality of the distributions was checked using Shapiro-Wilk test, differences between the four analyzed moments were tested using Friedman Multiple Comparison Test and Wilcoxon Test due to sample size. Wilcoxon Test was also used to compare mean values of each variable obtained for standard and contra-standard sculling techniques. Spearman Correlation Coefficient was computed for the study of relevant association of variables. Statistical significance was defined as p<0.05.. RESULTS Kinematics Analysis The values of sculling frequency, sculling duration, hand displacement, hand speed, hand acceleration, elbow angular velocity, wrist angular velocity, elbow angular acceleration, and wrist angular acceleration are presented in Table 1, both for standard and contra-standard sculling, in the four moments of the 30s tethered swimming test. An average value (and SD) of these moments is also displayed.. 29.
(52) Table 1. Mean ± SD values of frequency and duration of sculling, displacement, speed and acceleration of the hand and, angular velocity and acceleration of the elbow and wrist, both for standard and contra-standard sculling, in four moments of the 30s tethered swimming test (n=6). 20 % SF (Hz) SD (s). S CS S. 40% *ac. 2.52±0.31. 2.04±0.16 *abc. 0.40±0.04. ± SD. 60%. 80%. *. 2.31±0.14. 2.32±0.34. 2.25±0.28. 2.36±0.26. 2.00±0.24. 1.98±0.19. 1.97±0.22. 2.00±0.16. *. 0.43±0.03. 0.44±0.06. 0.45±0.05. 0.43±0.04. CS. 0.49±0.04. 0.51±0.06. 0.51±0.05. 0.51±0.06. 0.51±0.04. S. 0.47±0.13. 0.47±0.13. 0.47±0.11. 0.47±0.11. 0.47±0.00. e. f. HD (m). CS. 0.46±0.15. 0.47±0.16. 0.46±0.16. 0.45±0.16. 0.46±0.01. HS -1 (m.s ). S. 1.75±0.21. 1.68±0.27. 1.64±0.23. 1.60±0.22. 1.67±0.06. CS. 1.97±0.36. HA -2 (m.s ). S. 40.56±10.66. CS. 44.49±22.12. EAV -1 (rad.s ). S. 236.63±91.65. CS. 307.05±226.23. WAV -1 (rad.s ). S. 337.59±186.58. CS. EAA -2 (rad.s ). S. WAA -2 (rad.s ). bc. 1.80±0.35. 1.73±0.39. 1.87±0.12. 34.68±10.30. 37.88±12.14. 38.45±2.82. 42.40±25.52. 39.16±21.30. 37.08±21.63. 40.78±3.30. 239.09±124.24. 220.30±88.20. 205.86±99.87. 225.47±15.51. 306.71±249.92. 305.33±276.67. 300.34±261.11. 304.86±3.10. 304.90±147.25. 284.81±155.57. 255.88±95.19. 295.79±34.37. 395.40±319.34. 358.00±317.51. 361.03±352.09. 337.98±362.61. 363.10±23.84. S. 9502.49±7107.20. 9245.26±9024.42. 7517.81±6214.77. 7172.93±6360.43. 8359.62±1184.26. CS. 13849.63±16935.03. 13531.20±17683.25. 13598.11±18755.90. 14394.47±20488.16. 13843.35±392.15. 15986.44±10355.93. 16167.60±8891.58. 13717.85±9820.35. 12143.79±5642.81. 14503.92±1928.20. 18269.12±20535.24. 19398.62±24460.46. 17642.43±24002.38. 20190.69±3582.40. CS. 1.97±0.50. de. b. 40.67±11.74. b. abc. 25452.57±31731.24. d. SF: sculling frequency, SD: sculling duration, HD: hand displacement, HS: hand speed, HA: hand acceleration, EAV: elbow angular velocity, WAV: wrist angular velocity, EAA: elbow angular acceleration and WAA: wrist angular acceleration. * Significant differences between standard and contra-standard sculling. a Significant differences between 20 and 40%, b between 20 and 60%, c between 20 and 80%, d between 40 and 60%, e between 40 and 80% and f between 60 and 80%.. Relatively to the four moments of the test, in standard sculling, SF decreased from 20 to 40 and to 80%, SD increase from 20 to 40%, 60 and to 80%, HA decrease from 20 to 60%, and 40 to 60%, and WAV decrease from 20 to 60%. In contra-standard sculling, HD decreased from 40 to 80% and 60 to 80%, HS decreased from 20 to 60 and to 80%, 40 to 60 and to 80% and, WAA decreased from 20 to 40, 60 and to 80%. The other variables maintained the values constant along the test. Differences between standard and contra-standard sculling were found in SF (20 and 40%, and average), being higher in standard action, and in SD (20 and 40% and average), that was higher in contra-standard action. No differences 30.
(53) were observed in the other variables. In addition, it were observed a negative relationship between SF and SD (r=-0.88, p<0.05) for the contra-standard sculling. Body mass, arm span, width of the hand and hand length did not correlate with any studied kinematic variable. Tethered Force Analysis Force values are presented in Table 2, both for standard and contra-standard sculling, in the four moments of the 30s tethered swimming test. It were observed significant differences of values of force between 20 and 60 and 80%, and 40 and 80% for standard and contra-standard actions; and, only for standard sculling, it were significant differences between 60 and 80%. Differences between standard and contra-standard sculling were not observed.. Table 2. Mean ± SD values of force in four moments of the 30s tethered swimming test, both for standard and contra-standard sculling (n=6). 20 % S. 22.31±9.85. F (N) CS. 40% bc bc. 24.33±5.17. 60%. 80%. ± SD. e. f. 16.89±8.33. 13.94±7.62. 17.95±3.50. e. 18.07±5.44. 16.41±2.88. 19.75±3.42. 18.65±9.73 20.18±3.22. b. F: force, S: standard sculling, CS: contra-standard sculling. Significant differences between 20 and 60%, c between 20 and 80%, e between 40 and 80% and f between 60 and 80%.. Absolute and relative values of Fmax, FmaxTime, Fmean, FminAvg, FmaxAvg and the FI are presented in Table 3, both for standard and contra-standard sculling.. Table 3. Individual and Mean ± SD values of absolute and relative maximal force, the time when the maximal force occurred, mean force, the average of maximal and minimum forces and, the fatigue index, both for standard and contra-standard sculling (n=6). Swimmer. Fmax (N). RFmax -1 (N.kg ). FmaxTime (s). Fmean (N). FminAvg (N). FmaxAvg (N). FI (%). S. 43.37±16.79. 0.79±0.25. 6.91±5.19. 17.24±7.87. 13.04±8.31. 22.55±7.71. 52.95±21.10. CS. 38.07±5.29. 0.71±0.06. 4.78±2.87. 19.07±3.90. 14.03±4.30. 24.66±4.72. 46.40±16.99. S: standard sculling, CS: contra-standard sculling, Fmax: maximal force, RFmax: relative maximal force, FmaxTime: time when Fmax occurred, Fmean: mean force, FMinAvg: average of minimum forces, FMaxAvg: average of maximal forces and FI: fatigue index.. 31.
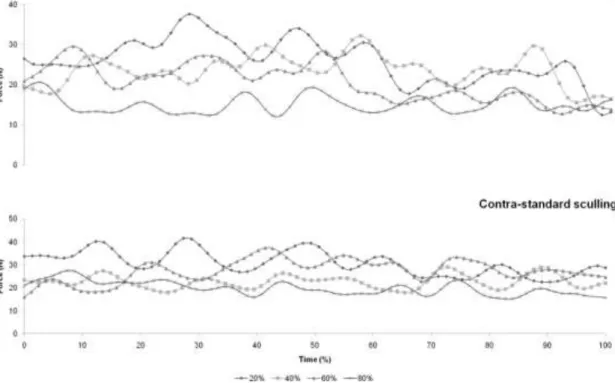
(54) The values of FI evidence that the F, despite all the fluctuations observed (that could be seen also in Figure 3) decreased during the 30s effort in all participants and in both sculling conditions.. Figure 3. Example of an individual F(t) curve, for standard and contra-standard sculling, for 20, 40, 60 and 80% of the 30s tethered synchronized swimming test.. Complementary, it was observed the following relationships: (i) body mass correlated negatively with FmaxTime for the standard sculling (r=-0.83), and positively with Fmax (r=0.83) for the contra-standard sculling; (ii) arm span correlated negatively with F for the contra-standard action (r=-0.83), and positively with Fmax for the contra-standard action (r=0.83); (iii) hand length correlated positively with Fmean for the contra-standard action (r=0.94); and (iv) FI correlated negatively with F (r=-0.94), FminAvg (r=-1.00) and Fmean (r=0.94) for standard action, and negatively with RFmax for the contra-standard sculling (r=-0.93). The width of the hand shows a tendency to relate with Fmean for the standard sculling (although without statistical significance). 32.
(55) Relationship between Kinematic and Force Parameters The relationship between kinematic and tethered force parameters, are displayed in Table 4, for each sculling action. Significant correlations were only found in contra-standard sculling, particularly between SF and FI, SD and FI, RFmax and SF and SD, HS and FMaxAvg and, WAA and F, FMinAvg and FMaxAvg. Other parameters presented a moderate relationship although without statistical significance.. Table 4. Correlation values (Spearman) between kinematic parameters and tethered force parameters both for standard and contra-standard sculling.. SF. SD. HD. HS. HA. EAV. WAV. EAA. WAA. S. F. FI. Fmax. RFmax. FmaxTime. Fmean. FMinAvg. FMaxAvg. .03. ,03. .64. .52. -.67. .03. -.03. .32. *. -.44. -.47. -.41. .24. .41. .15. .20. -.06. **. CS. -.09. ,97. -.03. -.90. S. .15. -,20. -.38. -.17. CS. .43. -,89. *. .37. .99. .03. .60. .60. .09. S. -.17. ,32. .46. .32. -.78. -.17. -.32. .03. CS. .53. -,29. .62. .31. .09. .29. .68. .21. S. -.37. ,20. -.71. -.77. -.20. -.37. -.20. -.71. CS. .71. ,09. .31. .00. -.03. .54. .66. .83. S. -.03. ,14. .37. .31. -.66. -.03. -.14. .09. CS. .60. -,03. .09. .06. .14. .60. .60. .77. S. .14. ,14. .71. .66. -.31. .14. -.14. .43. CS. .77. -,37. .61. .52. -.09. .77. .77. .77. S. .37. -,31. .49. .54. -.54. .37. .31. .43. CS. .77. -,14. .37. .26. -.09. .60. .77. .77. S. .14. -,09. .43. .54. -.26. .14. .09. .37. CS. .77. -,37. .31. .52. -.09. .77. .77. .77. S. .09. -,03. .31. .37. -.43. .09. .03. .20. .71. *. .83. CS. *. .89. -,26. .54. **. .46. -.26. .83. *. *. F: force, FI: fatigue index, Fmax: maximal force, RFmax: relative maximal force, FmaxTime: time when Fmax occurred, Fmean: mean force, FMinAvg: average of minimum forces, FMaxAvg: average of maximal forces, S: standard, CS: contra-standard, SF: sculling frequency, SD: sculling duration, HD: hand displacement, HS: hand speed, HA: hand acceleration, EAV: elbow angular velocity, WAV: wrist angular velocity, EAA: elbow angular acceleration and WAA: wrist angular acceleration. * Significant correlation for p < .05 and ** for p < .01.. DISCUSSION The aim of this study was to analyse the changes in kinematic (using 3D video images) and force parameters during a 30s maximal tethered synchronized swimming test. The relation between kinematic and force parameters were also research. In the high-intensity test, several indicators suggested the reaching of 33.
(56) fatigue by all subjects: the decrease in force, in velocity of the hand and in sculling frequency, as observed before by Toussaint and Beek (1992) and Aujouannet (2006), and the high fatigue index. Kinematic Analysis In general, in standard sculling, SF, HA and WAV decreased, and SD increased, and, in contra-standard sculling, HD, HS and WAA decreased. The other variables maintained stable along the test. These results evidence that, in both actions, the variables mentioned seem to have a tendency to decrease along the test. However, the differences were not significant in all moments, being evident a greater decrease at 40% of the test. The decrease of SF and HS, while SD increases, is in agreement with previous studies (Rouard et al. 1997; Aujouannet, 2006), although reported higher decreases. The duration of contra-standard sculling, was higher, perhaps, due to the greater difficulty of execution compared to standard sculling. Comparison of the obtained values of SF and SD with the specialized literature was not possible once no studies assessed these parameters. However, studies conducted with swimmers showed significantly lower values of stroke frequency compared to those of the present study (e. g. Kennedy et al., 1990; Arellano et al., 1994), which can be explained by shorter amplitude of sculling compared to other strokes. The displacement (3D distance of the endpoints of sculling in lateral directions, z) was very similar in standard and contra-standard sculling, and remained constant during the 30s test. However, it was less uniform in contrastandard action, perhaps, due to a higher resemblance of the standard sculling with the conventional swimming movements, and to the possibility of being a more “natural” action from the anatomical point a view. Complementary, contrastandard sculling presented higher values of linear and angular velocity and acceleration. According to Kamata et al. (2006), swimmers create a higher sculling propulsive force through vortices production; so, standard sculling seems to have a tendency to lower velocity and acceleration values, perhaps because it is a more continuous movement.. 34.
Imagem


+7


Documentos relacionados
Peça de mão de alta rotação pneumática com sistema Push Button (botão para remoção de broca), podendo apresentar passagem dupla de ar e acoplamento para engate rápido
The probability of attending school four our group of interest in this region increased by 6.5 percentage points after the expansion of the Bolsa Família program in 2007 and
Neste trabalho o objetivo central foi a ampliação e adequação do procedimento e programa computacional baseado no programa comercial MSC.PATRAN, para a geração automática de modelos
Ousasse apontar algumas hipóteses para a solução desse problema público a partir do exposto dos autores usados como base para fundamentação teórica, da análise dos dados
Provar que a interseção de todos os subcorpos de E que são corpos de decomposição para f sobre F é um corpo de raízes fe
Despercebido: não visto, não notado, não observado, ignorado.. Não me passou despercebido
In this sense, this study proposes to compare physiological and behavioral responses of preterm infants (PREEMIE), positioned by the Unit Routine Decubitus (URD) and the
A proposta de oferta dos cursos Técnicos Integrados prevista para 2017 vem acompanhada da preocupação da comunidade do Campus Piracicaba em oferecer condições adequadas para o
