Surface Integrity Analisys in the Hard Turning of Cemented Steel AISI 4317
Felipe Kulig Brancoa, Sergio Delijaicova* , Éd Cláudio Bordinassia, Roberto Bortolussia
Received: November 21, 2017; Revised: June 06, 2018; Accepted: July 02, 2018
This work was based on the surface integrity analysis of hardened steel, AISI 4317 case carburized, quenched and tempered with 58 HRC, obtained by a turning operation executed with CBN (cubic boron nitride) tool, varying three basic cutting parameters (cutting speed, feed rate and cutting depth). The surface integrity characterization was conducted analyzing the behavior of the surface roughness Ra, residual stresses and with layer presence after turning. Also, the cutting forces were measured. The experimental planning used was a central composite design. The results and data were statistically treated by the Statistica software, enabling the generation of a mathematical model, relating the dependent variables with the independent variables. The roughness values Ra obtained after the experiments ranged from 0.31 to 2.8 µm, providing an indication that is possible to replace grinding process by hard turning using CBN tools that could reduce machining time and costs. The
hard turning process generated compressive residual stresses profiles and white layer formation, from
1.1 to 5.1 µm, on the surface of the samples. The penetration force showed the highest values for the turning forces measurements. The lowest values for the cutting parameters represented the optimized surface integrity of the AISI 4317 steel.
Keywords: hard turning, surface integrity, residual stresses, turning process.
*e-mail: [email protected]
1. Introduction
In mechanical engineering the functional performances of many parts increase with their mechanical and topographical surface qualities. Quantities of importance in this respect include hardness, residual stresses and surface roughness, which are often summarized by the term of surface integrity. Concerning the design of processes and tools of material
removal processes the identification of parameters, which
result in acceptable surface integrity characteristics, is of major importance.
The surface integrity generated by hard turning was found to depend largely on the tool’s edge geometry. Since
tool wear affects the edge geometry, it can significantly
change the properties of the hard turned surface. Previous investigations have reported that hard turning with worn tool can result in tensile residual stresses at the surface. Also, the depth of the white re-hardened layer was found to increase with tool wear. Therefore, in order to control the functional performance of the surfaces produced by hard turning it is critical to understand the onset of white layer formation
during the finish hard turning process.
As early as 1950, it was well understood that residual stresses were the result of thermal and mechanical loads on the machined surface. Extended research on the mechanisms of residual stress creation, concluded that mechanical forces are
the main cause and the thermal stresses load is insignificant.
Matsumoto et al.1 while studying the effect of hardness on
residual stresses carried out machining experiments in a treated material with 57 HRC. The results revealed that, when hardness and other cutting parameters remain constant, the plastic deformation near the cutting edge is a dominant
factor in the creation of residual stresses profile. Subsurface
residual stresses on hardened turning AISI 52100 steel with hardness of 41 to 57 HRC as expected, it was found that the material with a hardness of 57 HRC produce the highest residual stresses.
By controlling the cutting parameters with proper selection of the cutting inserts, it is possible to tailor the surface integrity
of the component in order to achieve beneficial stress profiles and
acceptable topographical and metallurgical surface properties.
Like many other cutting processes, the tool wear (flank and crater wear) in hard turning has a significant influence on the final surface integrity. Both the physical properties and the functional behavior of the surface are significantly altered with the progress of tool wear. Tonshoff et al.2 showed that
an increase in the flank wear will alter the residual stress profile from beneficial to detrimental state and lead to the
formation of both a “white” and a “dark” etching layer with
inferior topographical properties. Griffiths3 suggested three
different mechanisms for the formation of the white layers:
i) plastic deformation producing a homogenous structure or
a layer with very fine grain size, ii) rapid heating followed
by rapid cooling resulting in a phase transformation and iii) surface reaction with the environment.
Regarding the white layer influence, it is not found
conclusive evidence which suggests the white layer has any aCentro Universitário da Fundação Educacional Inaciana, Departamento de Engenharia Mecânica,
impact on axial fatigue. Nevertheless, Guo et al.4 concluded the fatigue strength reduction on AISI 52100 is up to 8 times
its initial value. Probably, these opposite affirmations are
concluded because in Smith et al.5 the white layers studied had 2 micrometers instead of the 7 micrometers studied by Guo et al.4 Also, it should be noted that when comparing the same white layer produced by hard turning or grinding,
the first one presents more fatigue strength6.
In hard turning of steels, the material is hardened first,
by proper heat treatment and, later put into the machining
process to remove material and define the require shape. Herein, the metal cutting mechanics act differently than the
machining of non-hardened steels. Drastic rise of temperature, in absence of cooling and lubrication, causes a detrimental
effect on the tool and work material including the change
in the microstructure7.
Surface finish is very important feature of any machining
process and the main requirement of many manufacturing, automotive and aerospace applications. For turning operation,
feed rate is the most important factor that affects the surface
roughness. Apart from feed, nose radius and speeds are also important parameters for surface roughness. For hardened
components also surface finish is very important characteristics8. While machining hardened steels, chamfered edge and negative rake and inclination angles help to increase the machining force. Large nose radius with reduced depth of cut leads to minimum true side cutting edge angle, it results high thrust force. And large nose radius may produce good
surface finish and avoid tool vibration. A worsen surface finish can be a hint to changing surface roughness that may
change the service life of component. As hard turning is
mostly utilized for final finishing process, it is important to study about the parameters influence the surface roughness
and in turn fatigue life of the component9.
By transferring a small part of the round insert edges into the straight cutting edges of the pointed insert, an insert design
adjusted for hard machining producing superior surface finish
is achieved. The “wiper radii” are located next to the nose radius and enlarge the contact area of workpiece and tool.
Due to the technological innovations such as ultra-hard tool materials, new tool coatings material, and optimized
tool geometry, machining without cutting fluid called dry
turning is developed. However in dry turning operations, the friction and adhesion between chip and tool tend to be higher which causes higher temperatures, higher wear rates and consequently shorter tool lives. Further, dry turning needs
extremely rigid machine tool which is difficult to implement on the shop floor with the existing machine tools. All these problems related to turning with conventional flood cooling
and pure dry turning lead to research on machining with
minimal fluid application as an alternative10.
The hard turning has become possible with recent improvements in machine tool rigidity and availability of new cutting tool materials such as: cubic boron nitride
(CBN) and ceramics. The traditional method of machining hardened materials included heat treatment, rough turning, and then grinding process. Hard turning eliminates lubrication and reduces processing time when compared to grinding11. Dry machining avoids the problems associated with cutting
fluids but it is very tough to implement dry machining on the existing shop floor as it needs very rigid machine tools
and ultra-hard cutting tools which will again add to the cost of machining12.
The amount of heat generated depends on input parameters
especially cutting speed which is most influencing factor and
the type of material being machined. Heating action caused by machining leads many of the economic and technical problems. In actual practice, there are many factors which change these performance measures, i.e. tool variables, workpiece variables and cutting conditions. Excessive
temperatures directly influence the temperatures of tool face and tool flank and this leads to thermal damage of the
machined surface13.
Increase in the temperature may (i) affect the strength,
hardness, wear resistance and life of the cutting tool, (ii)
cause difficulty in controlling the accuracy due to dimensional
changes in the part being machined and on the machined surface integrity and (iii) cause thermal damage to the
workpiece and affect its properties and service life. The temperature in the cutting zone is affected by the cutting
parameters: the cutting speed, the feed rate, and the depth of cut. It also depends on the properties of the workpiece material, as well as on the physical properties of the tool14.
The case carburized AISI 4317 steel is used extensively by all industry sectors of components and shafts that require
high wear resistance, high core strength and significant impact
properties. It is a chromium steel, nickel and molybdenum, of high temperability, reaching HRC 62 in addition to being case
carburized. It has offered low roughness properties (compatible
with grinding values) and high residual compression stresses when machined in the hardened condition (above HRC 55). Due to the high temperatures reached in the cutting region, it is possible to present a white layer due to machining.
The turning operation of hardened materials, also called
hard turning, is characterized by having high flexibility
and the ability to produce complex geometry parts, in low number of steps and reduced machine preparation time, and
can be performed without the use of fluid, reducing costs and
consequent environmental impact2. Due to these qualities, combined with work quality generated parts resulting from ISO IT6 and surface roughness of 0.2 to 0.3 µm the process of turning hardened materials has been replacing grinding
in finishing operations15.
The focus of this work is to study the mechanical surface integrity and its dependence on machining parameters in the hard turning of parts made from AISI 4317, case carburized, quenched and tempered steel with a hardness of 59 to 62
the parameters cutting speed, feed rate and cutting depth in the surface roughness Ra, residual stresses, cutting forces and white layer resulting from the hard turning process, considering the tool always free of wear.
2. Methods and Materials
For this study, the following variables were established: a) Independent variables: cutting speed (vc), feed rate (f), cutting depth (ap); b) Dependent variables: surface roughness (Ra), white layer, residual stresses, cutting forces.
The specimens used were composed of AISI 4317 steel, whose chemical composition can be visualized in Table 1.
A composite central factorial design (DCC) was used with twenty cylindrical specimens, with a diameter of 40 mm and a length of 75 mm, with center holes on both sides, as shown in Table 2. After machining, the specimens were subjected to the thermochemical carburizing treatment, in order to provide the carbon content in the case carburized layer of 1.00 to 1.10 % and a thickness of 2.5 mm from the surface, followed by tempering to achieve a hardness of 59.92 ± 0.57 HRC.
In each test the inserts were replaced so that the wear
of the tool was not an influence variable. The specimens
were enumerated and rightly protected against corrosion.
The tests were run without cutting fluid.
The operating machine chosen for conducting the experiments was the Romi Centur 30D CNC lathe, with a total power of 10/7.5 kW and maximum and minimum spindle rotations of 4000 to 4 rpm. The insert used in the experiments was the Sandvik VBGW160404S01020F7025. The support adapted for the cutting forces measurement, Sandvik 50035171L6. The use of a piezoelectric transducer mounted on the cutting tool holder allowed the measurement of the machining forces of the experiments in three directions, namely the shear force (Fc), feed force (Fa) and penetration force (Fp).
Measurements of roughness of test specimens after turning were performed with the Mitutoyo model 211 surface tester, adjusted with the JIS 1994 Gaus calibration, using a 0.8 mm
cutoff with x 5 times. Three measurements were made at
120° along the part diameter and in the longitudinal direction. Measurements of the residual stresses of the test specimens were performed using the blind-hole method. The strain gauge used was the Excel PA 062RE-120 and the milling was inverted conical for hardness material SINTCTT/1 with a nominal drilling diameter of 1.8 mm. The special device to perform the incremental drilling process was the MTS 3000 - SINT.
The metallographic study of the machined surface of the samples after the tests made it possible to verify the existence
of the layer of material affected after the machining and
its respective thickness using the software of the Olympus BH2-UMA optical microscope.
The analysis of the data obtained in the experiments and tests was performed by Software Statistica.
3. Results and Discussion
The Table 3 represents the experimental results.
3.1 Surface Roughness Ra
The values for surface roughness Ra observed in Table 3 are the roughness averages measured at three points of each specimen, at 120 degrees and in the direction perpendicular to the direction of the tool feed rate, for the twenty conditions performed. The measured values corroborate with the values obtained by other experiments related to the subject, such as the work of Grzesik16 concerning the turning of quenched and tempered AISI 5140 steel with hardness 60 HRC. These values were obtained, using cutting depth of 0.25 mm, cutting
Table 1. Nominal chemical composition in wt % for AISI 4317 steel
BS C Mn P Max S Max Mo Cr Ni Si
EM 355 0,15
0,20
0,40
0,60 0,04 0,004
0,25 0,35
1,50 1,80
1,40 1,70
0,00 0,40
Table 2. Experimental planning
Body test vc(m/min) f(mm/rev) ap(mm)
1 150.00 0.05 0.05
2 150.00 0.05 0.20
3 150.00 0.15 0.05
4 150.00 0.15 0.20
5 210.00 0.05 0.05
6 210.00 0.05 0.20
7 210.00 0.15 0.05
8 210.00 0.15 0.20
9 129.55 0.10 0.13
10 230.45 0.10 0.13
11 180.00 0.16 0.13
12 180.00 0.18 0.13
13 180.00 0.10 0.05
14 180.00 0.10 0.25
15 180.00 0.10 0.13
16 180.00 0.10 0.13
17 180.00 0.10 0.13
18 180.00 0.10 0.13
19 180.00 0.10 0.13
speed 100 m/min and a feed rate from 0.04 to 0.40 mm/rev, Ra roughness within the range of 0.24 to 5.47 µm.
In order to explain the surface roughness found (Table 3) in this investigation, experiments were conducted to determine
the effects of the variables cutting speed, feed rate and depth
of penetration. The analysis of variance (ANOVA), with 95%
confidence, a quadratic R of 0.85 and a quadratic adjusted R of 0.72, indicated that the feed rate is the most significant
independent variable in the roughness variation Ra followed by cutting speed (Table 4).
The well-known theoretical expression (1) for roughness evaluation takes into account only the combination of the tool tip feed and radius15. The experimental values measured
validate this expression, however, for the minimum values of feed rate used in the experiments, a great discrepancy is observed when compared to the theoretical values. Rech and Moisan17 observed the same similar effects in the machining of cemented, quenched and tempered DIN 27MnCr5 steel of medium hardness of 58 HRC.
(1)
3.2 Cutting forces
The analysis of variance (ANOVA) for the feed rate cutting
force (Table 5), with 95 % confidence, quadratic R of 0.87
Table 3. Values obtained for the experiments. (vc=cutting speed; f=feed rate; ap=cutting depth; Fa=Feed rate cutting force; Fc=Cutting
force; Fp=Penetration force; TR=Residual stresses; WL=White layer thickness)
Body test vc(m/min) f(mm/rev) ap(mm) Ra Fa(N) Fc(N) Fp(N) TR(MPa) WL(mm)
1 150.00 0.05 0.05 0.32 11.71 4.37 29,86 -882 0.0
2 150.00 0.05 0.20 0.31 26.71 9.48 43.37 -304 0.0
3 150.00 0.15 0.05 1.84 26.34 5.83 61.85 -447 3.8
4 150.00 0.15 0.20 2.15 62.94 17.52 82.47 -602 5.1
5 210.00 0.05 0.05 0.33 13.91 5.84 33.42 -407 1.1
6 210.00 0.05 0.20 0.34 31.47 14.96 59.01 -512 1.6
7 210.00 0.15 0.05 2.01 21.96 6.93 47.63 -786 3.3
8 210.00 0.15 0.20 1.93 66.61 20.44 94.56 -768 3.1
9 129.55 0.10 0.13 0.91 34.77 9.85 59.72 -485 2.7
10 230.45 0.10 0.13 0.81 31.11 9.49 62.57 -433 4.4
11 180.00 0.16 0.13 2.15 46.48 11.32 73.94 -744 3.6
12 180.00 0.18 0.13 2.80 51.97 12.04 79.63 -748 3.7
13 180.00 0.10 0.05 0.79 16.47 5.47 34.84 -762 1.5
14 180.00 0.10 0.25 0.77 59.29 19.71 80.34 -334 1.5
15 180.00 0.10 0.13 0.85 34.77 10.22 58.3 -616 1.6
16 180.00 0.10 0.13 0.85 30.38 8.03 46.93 -870 1.8
17 180.00 0.10 0.13 0.73 35.86 11.31 68.96 -870 2.3
18 180.00 0.10 0.13 0.76 35.86 10.95 67.54 -847 2.0
19 180.00 0.10 0.13 0.82 38.79 12.41 63.99 -901 2.1
20 180.00 0.10 0.13 0.87 36.96 11.68 66.12 -895 2.3
Ra
r f
18 3
2
=
f
Table 4. ANOVA for the effect of the independent variables on roughness Ra.
Factor Effect Std.Err. p Coeff. Std.Err. Coeff.
Mean/Interc. 0,836662 0,156144 0,000320 0,836662 0,156144
(1)v (L) -0,057627 0,231402 0,808375 -0,028813 0,115701
v (Q) -0,058174 0,204915 0,782283 -0,029087 0,102457
(2)f (L) 1,150633 0,231402 0,000560 0,575316 0,115701
f (Q) 1,083803 0,204915 0,000353 0,541902 0,102457
(3)ap (L) -0,073791 0,335170 0,830175 -0,036896 0,167585
ap (Q) -0,411285 0,466852 0,399010 -0,205643 0,233426
1L by 2L -0,022500 0,276184 0,936678 -0,011250 0,138092
1L by 3L -0,124033 0,370334 0,744604 -0,062016 0,185167
Table 5. ANOVA for the effect of the independent variables on feed rate force.
Factor Effect t(10) p Coeff. Std.Err. Coeff.
Mean/Interc. 40,4795 14,28566 0,000000 40,47954 2,833578
(1)v (L) 0,9181 0,21863 0,831337 0,45904 2,099651
v (Q) -3,7714 -1,01418 0,334407 -1,88568 1,859319
(2)f (L) 19,2750 4,59005 0,000995 9,63751 2,099651
f (Q) 7,7439 2,08245 0,063934 3,87194 1,859319
(3)ap (L) 36,3978 5,98410 0,000135 18,19892 3,041211
ap (Q) -10,2659 -1,21173 0,253470 -5,13294 4,236042
1L by 2L -1,9175 -0,38258 0,710035 -0,95875 2,505991
1L by 3L 3,5567 0,52923 0,608192 1,77836 3,360275
2L by 3L 16,3221 2,42868 0,035530 8,16103 3,360275
Table 6. ANOVA for the effect of the independent variables on cutting force.
Factor Effect Std.Err. p Coeff. Std.Err. Coeff.
Mean/Interc. 66,2960 4,37573 0,000000 66,2960 4,375729
(1)v (L) 6,4735 6,48474 0,341690 3,2368 3,242368
v (Q) -2,6077 5,74247 0,659453 -1,3038 2,871237
(2)f (L) 21,5241 6,48474 0,007758 10,7621 3,242368
f (Q) 8,4515 5,74247 0,171846 4,2257 2,871237
(3)ap (L) 31,8339 9,39273 0,006895 15,9170 4,696364
ap (Q) -20,4749 13,08294 0,148649 -10,2374 6,541472
1L by 2L -5,3325 7,73971 0,506507 -2,6663 3,869856
1L by 3L 12,8693 10,37815 0,243272 6,4346 5,189076
2L by 3L 9,5371 10,37815 0,379748 4,7686 5,189076
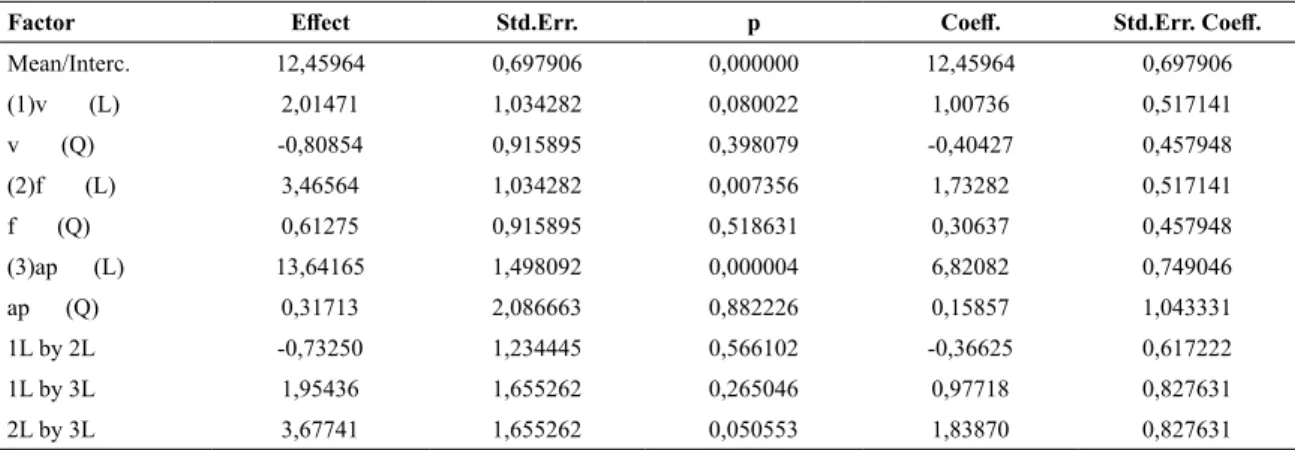
Table 7. ANOVA for the effect of the independent variables on penetration force.
Factor Effect Std.Err. p Coeff. Std.Err. Coeff.
Mean/Interc. 12,45964 0,697906 0,000000 12,45964 0,697906
(1)v (L) 2,01471 1,034282 0,080022 1,00736 0,517141
v (Q) -0,80854 0,915895 0,398079 -0,40427 0,457948
(2)f (L) 3,46564 1,034282 0,007356 1,73282 0,517141
f (Q) 0,61275 0,915895 0,518631 0,30637 0,457948
(3)ap (L) 13,64165 1,498092 0,000004 6,82082 0,749046
ap (Q) 0,31713 2,086663 0,882226 0,15857 1,043331
1L by 2L -0,73250 1,234445 0,566102 -0,36625 0,617222
1L by 3L 1,95436 1,655262 0,265046 0,97718 0,827631
2L by 3L 3,67741 1,655262 0,050553 1,83870 0,827631
and quadratic R adjusted of 0.83, indicated that the feed rate “f” and the cutting depth “ap” and the interaction between
these two parameters are the most significant independent
variables in the variation of the feed rate cutting force “Fa”. For the cutting force (Table 6), a quadratic R of 0.74 was obtained and the quadratic R adjusted of 0.65 indicated that the feed rate f and the cutting depth “ap” are the most
significant independent variables in the cutting force variation
“Fc”. For the penetration cutting force (Table 7), a quadratic R of 0.88 was obtained and the quadratic R adjusted of 0.84 indicated that the feed rate and the cutting depth ap are the
most significant independent variables in the variation of
the penetration cutting force Fp.
Due to the small depths of cut and nose radius during turning of hardened steels, high cutting speeds result in high temperatures at the metal-tool interface, softening the material and consequently resulting in reduced machining forces. On the other hand, low cutting speeds lead to low temperatures at the metal-tool interface and high forces are induced18.
to the negative geometry of the cutting tools normally used in these machining operations18.
3.3 Residual stresses
The use of the blind-hole method allowed the profile of
residual axial and circumferential stresses to be surveyed in relation to the depth of the specimens. The residual circumferential tensions of the test specimens were statistically studied, since the longitudinal residual stresses presented the same behavior when compared to the circumferential stresses. The maximum residual stresses found can be observed in Table 3.
Figure 1 shows a typical graph of residual stress versus depth of test body 1, obtained through the blind-hole
method, and exemplifies the general behavior pattern of
the analyzed specimens. A compressive residual stress is noticed, progressing to a peak and then stabilizing as the depth approaches the core of the component. This behavior is widely observed in several studies concerning the turning of hardened materials and indicates one of the qualities of the incorporation of this manufacturing process, since the surface and the subsurface of components within the compressive regime of residual tension present a better life performance to fatigue and minimize the formation and propagation of3.
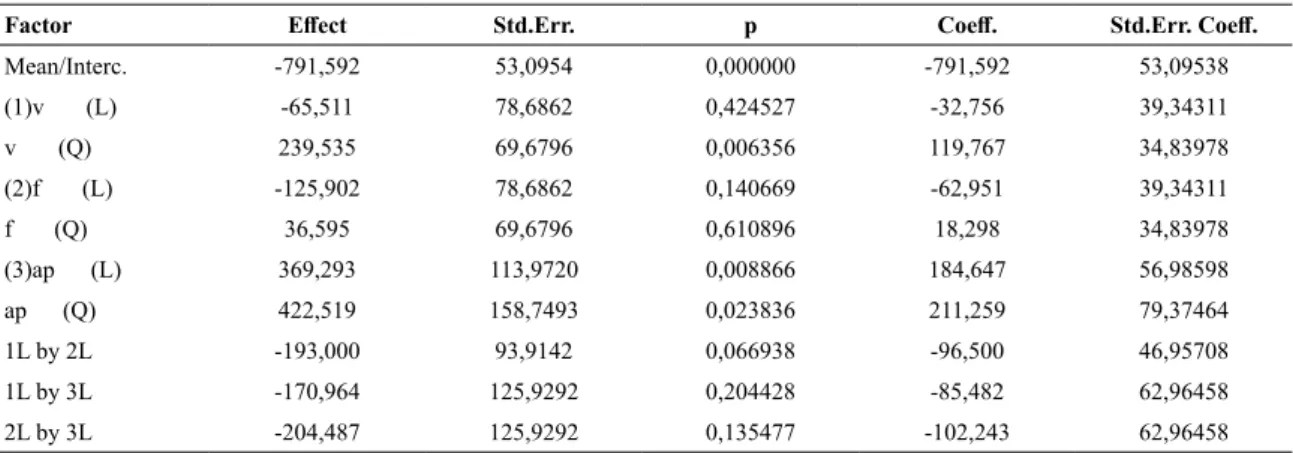
The analysis of variance (ANOVA), with 95% confidence,
R squared of 0.77 and squared R of 0.57 (Table 8), indicates that the cutting depth and the cutting speed vc are the most
significant independent variables in the variation of the
residual circumferential stress.
The Figure 2 indicates values of circumferential residual stress in the interaction of cutting speed and cutting depth. Observing Figure 2 it can be seen that the model predicts that at maximum values of cutting depth ap and cutting speed vc the residual stress is tensile. These machining conditions allow high heat generation at the metal-tool interface and higher temperatures can be observed, thus allowing a possible phase transformation in the surface region of the part. The formation of the martensite retempered on the surface of the piece resulting from this phase transformation is one of the hypotheses that explain the formation of the
white layer, corroborated by the findings of the respective
residual tensile stresses. In the intermediate conditions, the model indicates compressive residual stresses and that the mechanical phenomenon prevails over the thermal, thus generating a great deformation of the grains and imputing a severe plastic deformation to the structure(17).
3.4 White layer
The presence of the white layer (WL) in the samples can be observed in Table 3.
The Figure 3 shows the metallography of specimen 3 and the presence of the white layer. The metallography presents a structure of annealed martensite resulting from the heat treatment process applied to all the specimens and the machined surface shows the presence of the white layer,
generated by the thermo-mechanical effect resulting from the
machining operation. The test of variance (ANOVA), with
95% confidence, quadratic R of 0.70 and quadratic adjusted
R of 0.55 (Table 9), indicates that the feed rate f is the most
significant parameter in the variation of the white layer.
The formation of the white layer is dependent on the machining parameters and its formation attributed to the rapid heating and cooling caused after the machining, thus causing the phase transformation on the surface of
Figure 1. Stress versus strain plot for test body 1 (X is the longitudinal residual stress and Y is the circumferential residual strees)
Table 8. ANOVA for the effect of the independent variables on circumferential residual stress.
Factor Effect Std.Err. p Coeff. Std.Err. Coeff.
Mean/Interc. -791,592 53,0954 0,000000 -791,592 53,09538
(1)v (L) -65,511 78,6862 0,424527 -32,756 39,34311
v (Q) 239,535 69,6796 0,006356 119,767 34,83978
(2)f (L) -125,902 78,6862 0,140669 -62,951 39,34311
f (Q) 36,595 69,6796 0,610896 18,298 34,83978
(3)ap (L) 369,293 113,9720 0,008866 184,647 56,98598
ap (Q) 422,519 158,7493 0,023836 211,259 79,37464
1L by 2L -193,000 93,9142 0,066938 -96,500 46,95708
1L by 3L -170,964 125,9292 0,204428 -85,482 62,96458
Figure 2. "ap x vc" plot for circumferential residual stress values
Figure 3. Metallography of machined surface of specimen 3 and
respective white layer identified. Increase of 500x with attack of
Nital 2 %
Table 9. ANOVA for the effect of the independent variables on white layer.
Factor Effect Std.Err. p Coeff. Std.Err. Coeff.
Mean/Interc. 2,08139 0,447832 0,000911 2,081388 0,447832
(1)v (L) -0,77385 0,663678 0,270670 -0,386925 0,331839
v (Q) -0,43221 0,587711 0,478985 -0,216103 0,293856
(2)f (L) 2,00522 0,663678 0,012865 1,002612 0,331839
f (Q) 1,19650 0,587711 0,069125 0,598248 0,293856
(3)ap (L) 0,22800 0,961295 0,817303 0,114002 0,480648
ap (Q) -1,16251 1,338969 0,405631 -0,581256 0,669485
1L by 2L -1,02833 0,792118 0,223358 -0,514167 0,396059
1L by 3L 0,06258 1,062148 0,954181 0,031288 0,531074
2L by 3L -0,13409 1,062148 0,902041 -0,067045 0,531074
white layer can be generated at surface temperatures of the specimen less than the austenitization temperature, a phenomenon related to the high plastic deformation imputed to the material in the machining.
The white layer tends to be smaller or nonexistent in the areas of lesser feed rate and cutting speed and the greater thicknesses of the white layer are formed under the conditions of greater feed rate and higher cutting speed. In these situations, of maximum feed rate and maximum cutting speeds, the temperature reached combined with a high plastic deformation, generates thermomechanical conditions for the appearance of a white layer thickness of greater depth. In the case of machining a thermo-mechanical process, involving an interdependence between temperature, plastic deformation and shear, it is prudent to say that the three variables, cutting speed, feed rate and shear depth,
influence the formation of the white layer.
Several studies show that the turning process of hardened materials, for certain parameters, does not generate a white
layer in the final product or white layers of smaller magnitudes in depth when compared to the rectification process. When
generated is usually detrimental to the mechanical performance
of the component, since it has different structure and behavior from that of the core, thus behaving differently when subjected
to mechanical stresses, being able to have a shorter fatigue life and favor the appearance of cracks in the surface and
subsurface. It is recommended a super-finishing operation to eliminate this affected surface20.
3.5 Surface integrity optimization
The complex nature of the concept of surface integrity is a known fact, since it involves several interdependent, measurable, or qualitative mechanical, metallurgical, and chemical parameters. The optimization of all responses aiming at a global objective, the surface integrity, which is dependent on the functionality and desired performance of the part and / or the process, can be an indicator of this parameter.
The search for the ideal functionality of the part-process, within this work, sought to obtain the following the part, or the retempering of the welded martensite that
characteristics: A) low roughness in the range obtained by the grinding process; B) minimum cutting forces; C) maximum compressive residual stresses for a better fatigue life of the machined component; (D) the white layer free surface, since structural homogeneity must be guaranteed. It is added to the fact that possibly this layer, result of the retempered material in the surface and subsurface of the piece, can present / display micro-cracks compromising its life to the fatigue.
The search of the parameters of the machining process, cutting speed “vc”, feed rate “f“ and cutting depth “ap” that simultaneously meet the functionality requirements described, represent the indicators of surface integrity associated to the desired objectives. However, it must be recognized that industrial processes need to be dimensioned to reduce the working times and costs involved, which would lead to the choice of more aggressive variables. It would then be necessary to verify the impact of this choice on the dependent variables to evaluate the new surface integrity condition.
It is observed that due to the complexity of the subject it is necessary the aid of computational tools to reach these objectives. The optimization tools represent a good resource for analyzing surface integrity idealized previously. In this work we used the Statistica software that provides the optimization Desirability algorithm.
The results indicated the following optimized cutting parameters: cutting speed “vc”: 120 m/min, feed rate “f”: 0.05 mm / rev and cutting depth “ap”: 0.05 mm. The obtained objectives were: Ra roughness of 0.46 µm, compressive circumferential residual stress “TR”: - 603 MPa, white layer thickness “WL”: 0.65 µm and machining force “Fu”: 36.5 N.
4. Conclusions
The surface integrity of mechanical components made from cemented, quenched and tempered AISI 4317 steel
subjected to turning can be classified from surface quality
studies such as roughness, residual stress generated after the process and possible surface and subsurface changes brought about by machining using metallographic analysis of the studied components. The main conclusions obtained from this work are presented below.
• The roughness Ra obtained through the experiment ranged from 0.31 to 2.80 µm.
• The roughness Ra is basically dependent on the feed rate “f”, having low sensitivity to the parameters cutting speed “vc” and cutting depth “ap”. • The penetration cutting force “Fp” showed the highest
values observed among the other components, with a maximum value of 94.6 N, obtained in machining condition 8 (vc = 210 m / min, f = 0.15 mm / rev and ap = 0.20 mm). The penetration force “Fp” is strongly
dependent on the feed rate f and cutting depth “ap”, parameters related to cutting area and chip size. • It was observed in these experiments that the
penetration cutting force was the one that presented the highest value among the components of the cutting forces.
• The residual stresses verified from the “blind-hole method” presented the characteristic shape according to the literature and the maximum compressive values ranged from -304 to -901 MPa in magnitude and 0.05 to 0.15 mm in depth.
• The significant factors in the change of circumferential residual stress were the cutting depth “ap” and the cutting speed “vc”, and the model indicates a change from residual compressive to tensile stress when these combined or isolated parameters are maximum for the conditions performed.
• There was formation of the white layer in most of the bodies of tests analyzed, of thickness ranging from 1.1 to 5.1 µm.
• The most significant parameter in the formation of the white layer was the feed rate “f”, and the greatest depths are generated when the feed rate is too high, combined or isolated, indicating that possibly the higher temperatures generated during machining are reached under these conditions, Combining the
thermal effect at high plastic deformation resulting
in phase transformation of the surface material. • A optimized condition, with less cutting forces, lower
roughness Ra, maximum compressive circumferential residual stress and less white layer thickness, can be achieved using the cutting parameters “vc” = 120 m / min, feed rate “f” = 0.05 mm / rev and cutting depth “ap” = 0.05 mm. The result is the generation of a Ra surface roughness surface = 0.46 µm, a circumferential residual stress = - 603 MPa and a white layer thickness = 0.65 µm requiring a cutting force “Fu” = 36.5 N.
5. References
1. Matsumoto Y, Barash MM, Liu CR. Effect of Hardness on the
Surface Integrity of AISI 4340 Steel. Journal of Engineering for Industry. 1986;108(3):169-175. DOI: 10.1115/1.3187060
2. Toenshoff HK, Arendr C. Cutting of Hardened Steel. CIRP Annals. 2000;49(2):547-566. DOI: https://doi.org/10.1016/ S0007-8506(07)63455-6
3. Griffiths B. Manufacturing Surface Technology. 1st ed. London: Penton Press; 2001.
4. Guo YB, Wen Q, Woodbury KA. Dynamic Material Behavior
5. Smith S, Melkote SN, Lara-Curzio E, Watkins TR, Allard
L, Riester L. Effect of surface integrity of hard turned AISI
52100 steel on fatigue performance. Materials Science and Engineering: A. 2007;459(1-2):337-346. DOI: https://doi. org/10.1016/j.msea.2007.01.011
6. Pereira O, Rodríguez A, Fernández-Abia AI, Barreiro J, López de Lacalle LN. Cryogenic and minimum quantity lubrication
for an eco-efficiency turning of AISI 304. Journal of Cleaner Production. 2016;139:440-449. DOI: http://doi.org/10.1016/j. jclepro.2016.08.030
7. Mia M, Dhar NR. Prediction of surface roughness in hard
turning under high pressure coolant using Artificial Neural
Network. Measurement. 2016;92:464-474. DOI: http://doi. org/10.1016/j.measurement.2016.06.048
8. D'Addona DM, Raykar SJ. Analysis of Surface Roughness in Hard Turning Using Wiper Insert Geometry. Procedia CIRP. 2016;41:841-846. DOI: http://doi.org/10.1016/j.procir.2015.12.087
9. Srithar A, Palanikumar K, Durgaprasad B. Experimental
Investigation and Surface roughness Analysis on Hard turning of AISI D2 Steel using Coated Carbide Insert. Procedia Engineering. 2014;97:72-77. DOI: http://doi.org/10.1016/j. proeng.2014.12.226
10. Robinson Gnanadurai R, Varadarajan AS. Investigation on
the effect of cooling of the tool using heat pipe during hard turning with minimal fluid application. Engineering Science and Technology, an International Journal. 2016;19(3):1190-1198. DOI: http://doi.org/10.1016/j.jestch.2016.01.012
11. Bensouilah H, Aouici H, Meddour I, Yallese MA, Mabrouki T, Girardin F. Performance of coated and uncoated mixed ceramic tools in hard turning process. Measurement. 2016;82:1-18. DOI: http://doi.org/10.1016/j.measurement.2015.11.042
12. Beatrice BA, Kirubakaran E, Thangaiah PRJ, Wins KLD. Surface Roughness Prediction using Artificial Neural Network
in Hard Turning of AISI H13 Steel with Minimal Cutting Fluid Application. Procedia Engineering. 2014;97:205-211. DOI: http://doi.org/10.1016/j.proeng.2014.12.243
13. Varaprasad B, Srinivasa Rao C, Vinay PV. Effect of Machining
Parameters on Tool Wear in Hard Turning of AISI D3 Steel.
Procedia Engineering. 2014;97:338-345. DOI: http://doi. org/10.1016/j.proeng.2014.12.257
14. Shihab SK, Khan ZA, Mohammad A, Siddiqueed AN. RSM
based Study of Cutting Temperature During Hard Turning with Multilayer Coated Carbide Insert. Procedia Materials Science. 2014;6:1233-1242. DOI: http://doi.org/10.1016/j. mspro.2014.07.197
15. Abrão AM, Aspinwall DK. The surface integrity of turned and
ground hardened bearing steel. Wear. 1996;196(1-2):279-284. DOI: https://doi.org/10.1016/0043-1648(96)06927-X
16. Grzesik W, Wanat T. Surface finish generated in hard turning
of quenched alloy steel parts using conventional and wiper ceramics inserts. International Journal of Machine Tools & Manufacture. 2006;46(15):1988-1995. DOI: https://doi. org/10.1016/j.ijmachtools.2006.01.009
17. Rech J, Moisan A. Surface integrity in finish hard turning of
case-hardened steels. International Journal of Machine Tools and Manufacture. 2002;43(5):543-550. DOI: https://doi. org/10.1016/S0890-6955(02)00141-4
18. Zhou JM, Andersson M, Stahl JE. The monitoring of flank
wear on the CBN tool in the hard turning process. International Journal of Advanced Manufacturing Technology. 2003;22(9-10):697-702. DOI: https://doi.org/10.1007/s00170-003-1569-2
19. Bosheh SS, Mantivega PT. White layer formation in hard turning of H13 tool steel at high cutting speeds using CBN tooling. International Journal of Machine Tools & Manufacture. 2006;46(2):225-233. DOI: https://doi.org/10.1016/j. ijmachtools.2005.04.009
20. Umbrello D, Rizzuti S, Outeiro JC, Shivpuri R, M'Saoubi R.
Hardness-based flow stress for numerical simulation of hard