OPTIMIZATION OF MACHINING PARAMETERS USING TAGUCHI
APPROACH DURING HARD TURNING OF ALLOY STEEL WITH
UNCOATED CARBIDE UNDER DRY CUTTING ENVIRONMENT
A. Das
National Institute of Technology Rourkela, Odisha-769008, India
E-mail: [email protected]
A. Khan
National Institute of Technology Rourkela, Odisha-769008, India
S. Mohanty
3Padmanava College of Engineering Rourkela, Odisha-769002, India
A B S T R A C T K E Y W O R D S
A R T I C L E I N F O
ANOVA, Productivity, S/N ratio, Quality
Received 07 July 2015 Accepted 03 August 2015 Available online 1 December 2015
In today’s world of manufacturing by machining
process two things are very important, one is productivity and the other one is quality. Quality of a product generally depends upon the surface finish and dimensional deviations. The productivity can be seen as a key economic indicator of innovation in terms of higher material removal rate with a less time and cost in machining industries. Taguchi method is a popular statistical technique for optimization of input parameters to get the best output results. Dry machining is a popular methodology for machining hard material and it has been accepted by many researchers to a great extent because of its low cost and safety. Many scientists have taken various input parameters and studied their effects on different output responses. In the present paper an attempt has been made to study the effect of input parameters such as cutting speed, feed rate and depth of cut on Surface roughness, Tool wear, Power consumption and Chip reduction co-efficient under dry condition using uncoated carbide insert. Signal to noise ratio has been used to select the optimal condition for various output responses. ANOVA table has been drawn for each output responses and finally mathematical model of multiple regression analysis has been prepared and authenticity of the statistical model have been checked by normal probability plot. It has been found from the experimental result that the power consumption and flank wear both were minimum at the cutting speed of
2
250 rpm and 400 rpm respectively. Chip reduction coefficient has been found minimum at a depth of cut of 0.3 mm and surface roughness was minimum at 0.1 mm/rev. feed rate.
1. Introduction:
The achivement of high quality, in terms of workpiece dimensional accuracy, surface finish, high production rate, less wear on the cutting tools, economy of machining in terms of cost saving and increase the performance of the product with reduced enviornmental impact are the main and effective challenges of modern metal cutting and machining industries.
A.D. bagawade et al. [1] evaluated the chip area ratio and surface roughness in hard turning of AISI52100 (EN-31) steel (48-50 HRC), machined by PCBN tool. They studied the effects of speed, feed, and depth of cut on chip area ratio and surface roughness.
Y. Kevin Chou and Hui Song [2] employed a mechanistic model to estimate the forces developed during chip formation. Assuming linear growth of plastic zone on the wear land and quadratic decay of stresses in the wear land forces were modelled. Increasing feed rate and cutting speed adversely affect maximum machined surface temperature in new cutting tool but increasing depth of cut favourably affect the maximum machined surface temperature.
S. Delijaicov et al. [3] studied the effect of vibration in hard turning process of AISI 1045. The specimen is first tempered and then quenched up to 53 HRC. Excellent correlation was obtained between the model and the experimental results. They found that the frequency amplitude increases the reliability of model by 5%.
B. Fnides et al. [4] conducted total 27 experiments (Full factorial) to determine the statistical model of surface roughness in hard turning of high alloyed steel X38CrMo5-1. The workpiece was hardened up to 50HRC and machined by mixed ceramic insert. Mathematical models were deduced by multiple regression method in order to express the influence of each cutting regime element on surface roughness. Finally the result concluded that feed rate was the most influencing factor for surface roughness followed by cutting speed. Depth of cut had no importance on surface roughness.
G. Hrinath Gowd et al. [5] studied the effects of machining parameters on cutting forces and Surface roughness and developed second order polynomial model. Experiments were performed and it was concluded that three cutting forces and surface roughness were significantly affected by speed, feed and depth of cut. RSM was used for the prediction of mathematical models for estimation of Fx, Fy, Fz and Surface roughness.
K. Adarsh kumar et al. [6] investigated how surface finish of EN-8 affected by spindle speed, feed, and depth of cut and established a mathematical model between the input parameters and surface roughness using multiple regression analysis. To select the significant parameters ANOVA table was used.
3
turning of AISI 8660. He analysed and found that feed rate is the most effective parameter followed by depth of cut and nose radius on surface roughness.
Tugrul Ozel et al. [8] had examined how surface roughness and resultant force in hard turning of AISI H13 steel effected by cutting edge geometry, hardness of workpiece, feed and cutting speed. He found that lower workpiece hardness and honed edge geometry of the insert produces better surface finish and all the force components were mainly affected by the geometry of cutting edge of the tool, hardness of the workpiece and cutting speed.
Tugrul Ozel and Yigit Karpat [9] used neural network model for prediction of surface roughness and tool flank wear over machining time for variety of cutting conditions in finish hard turning. They found better results from neural network model as compare to the regression model. Feed rate was found to be significant for surface roughness and cutting speed was found to be significant for flank wear.
F. Puh et al. [10] used Taguchi’s L9 orthogonal array design and optimise the
process parameters for hard turning of AISI 4142 with PCBN inserts. He generated the mathematical model between input and output parameters using first order and second order regression analysis. ANOVA table was used for obtaining the significant input parameter.
R. Ramanujan et al. [11] presented a new methodology for the optimisation of the machining parameters on turning Al-15% SiCP metal matrix composites called Desirability function analysis (DFA). For the evaluation of optimum machining parameters on surface roughness and power consumption composite desirability factor was used.
B. Sidda Reddy et al. [12] developed surface roughness model for machining of aluminium alloys, using adaptive neuro-fuzzy interference system (ANFIS). The ANFIS model had been developed in terms of machining parameters to predict the surface roughness using train data. To validate the model experimental validation runs were conducted. Percentage deviation and average percentage deviation had been used to judge accuracy and ability of model. Same data were modelled by RSM and ANFIS, results were compared with each other and ANFIS was found superior one.
S.B. Salvi et al. [13] studied hard turning of 20MnCr5 steel by ceramic inserts. The purpose of this study was to analyse optimum cutting conditions to get lowest
surface roughness. To find the optimal cutting parameters, Taguchi’s approach was
used. After conducting experiments it was found that the feed rate is the most significant parameter followed by cutting speed for surface roughness.
Dilbag Singh and P. Venkateswara Rao [14] investigated how surface roughness in bearing Steel (AISI 52100) is effected by cutting condition and tool geometry by using response surface methodology (RSM). Cutting inserts with different nose radius and rake angles were used. In this study they concluded that surface roughness is significantly affected by feed followed by nose radius and cutting velocity. Interaction effect of rake angle and nose radius was also found significant.
4
2. Experimental setup 2.1. Workpiece material
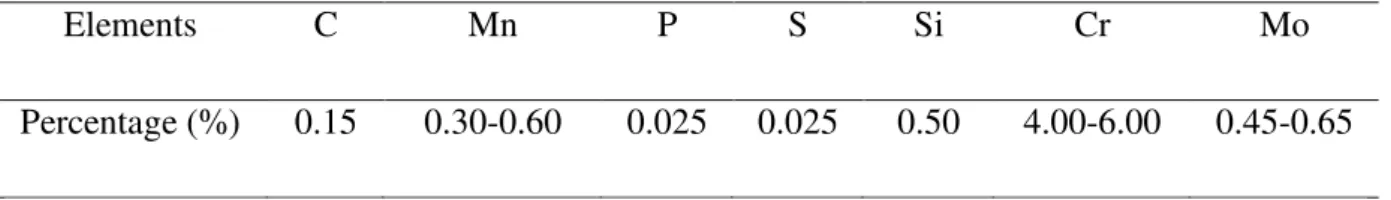
In this research work, chrome moly alloy steel of length 600 mm and diameter of 50 mm, was used as workpiece material. It was prepared at Cast Profile Pvt. Ltd., Kalunga as shown in figure 1. These alloys are mostly used in power plants and petro chemical plants because of their sustainability at high temperature and high pressure with relative ease. The chemical composition of the work piece material is given in table 1. The hardness of the alloy was tested as 48 HRC.
Fig. 1. Work piece material
Table 1: Chemical Composition of the workpiece material
Elements C Mn P S Si Cr Mo
Percentage (%) 0.15 0.30-0.60 0.025 0.025 0.50 4.00-6.00 0.45-0.65
2.2. Cutting insert and tool holder
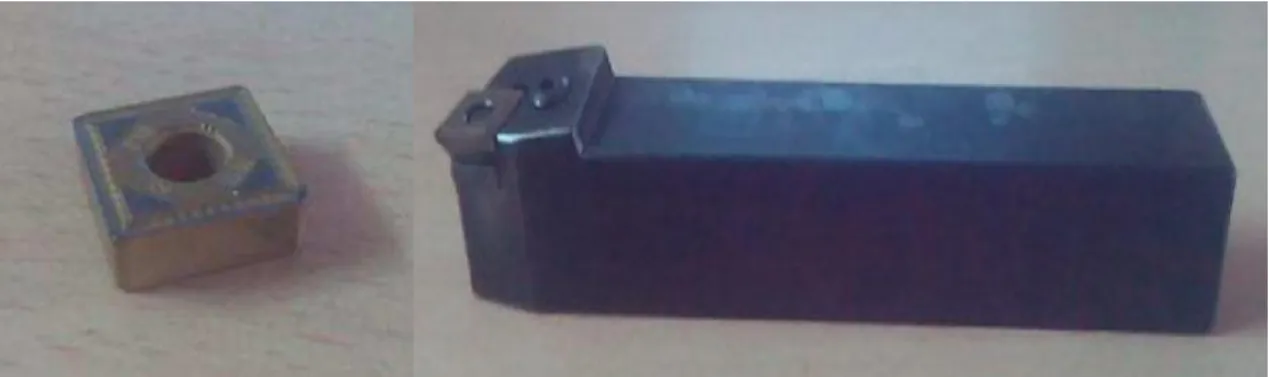
In this experimental study, uncoated carbide inserts were used with the ISO designation of SNMG 120408(Figure 2). The cutting inserts used in this experiment are most significantly used for the proper machining of alloy steels which have resistive properties at elevated temperatures. The inserts were square in shape with zero clearance angle and 0.8 mm nose radius. The inserts were rigidly mounted on a right handed tool holder designated by ISO as PSBNR2525M12. The tool geometry of the insert and tool holder was as below:
Insert shape Square
Clearance angle 00
Cutting edge length 12 mm
Insert thickness 04 mm
Corner radius 08 mm
5
Orthogonal rake angle -60
Nose radius 0.8 mm
Holder style offset shank 750
Shank height 25 mm
Shank width 25 mm
Tool length 150 mm
Cutting edge length 12 mm
Fig. 2. Uncoated carbide insert (left) and PSBNR2525M12 tool holder (right).
2.3 Experimental procedure
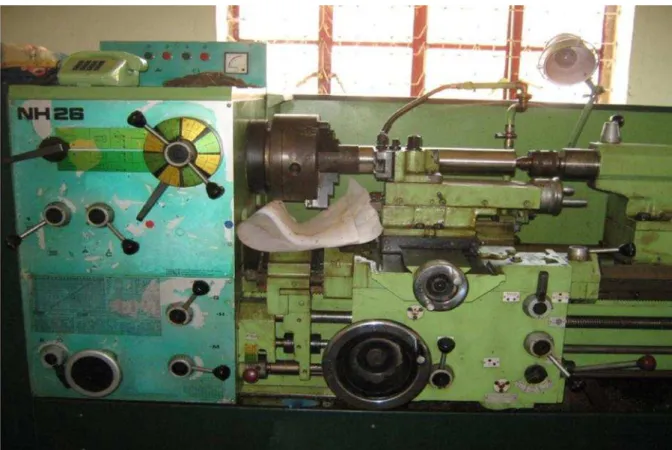
The rough workpiece of chrome-moly alloy steel was first turned to clear the rough skin to avoid any inhomogeneity (Figure 3). The purpose of this experiment was to find the effect of cutting speed, feed rate and depth of cut on output responses like surface roughness, power consumption, chip reduction coefficient and flank wear. Total 27
experiments were conducted according to Taguchi’s orthogonal design with three
different levels for each input parameters. The work piece was held rigidly on lathe and machining time was set as 0.5 minutes for each run. The surface roughness component (Ra) was measured using Taylor/Hobson (sutronic 3+) for 27 cuts and the power consumption was measured by wattmeter connected to the Lathe machine. The wattmeter gave reading of voltage (V), current (I) and power factor (cosϕ) for each run of the experiment. The power consumption was calculated by formula:
cos . .I V
P (1)
Flank wear of the inserts were measured after each experimental run using Stereo zoom optical microscope. The chips were collected for all experimental runs and their thickness were measured using micrometre. The chip reduction co-efficient was calculated by the formula given below:
thickness chip
Uncut
thickness chip
Cut t
coefficien reduction
6
Fig. 3. Lathe Machine
3. Design of experiment
In this study, L27 Taguchi standard orthogonal array with 26 DOF was adopted as the
experimental design. Taghuchi’s orthogonal arrays are the most suitable techniques for
conducting the experimental runs with a less time and cost. Compatible results can be achieved with these design of experiments as compare to full factorial design. Experiments were planned using 3 levels for each input parameter as shown in table 2.
Table 2: Input variable with their levels
Sr.no. Parameters Level 1 Level 2 Level 3
1 Cutting speed (V), rpm 250 420 710
2 Feed rate (F), mm/rev 0.10 0.13 0.15
3 Depth of cut (D), mm 0.3 0.5 1.0
7
Table 3: Measured output responses
Run
Input parameters Measured output responses Cutting Speed (V) rpm Feed rate (F) mm/rev Depth of cut (D) mm Surface roughness
(Ra)
μm Power consumption (P) kw Chip reduction co-efficient () Flank Wear (VB) mm
1 250 0.10 0.3 1.10 0.405 1.138 1.260 2 250 0.10 0.5 1.44 0.610 2.070 0.960 3 250 0.10 1.0 0.04 0.496 3.002 0.880 4 250 0.13 0.3 1.56 0.388 0.637 1.620 5 250 0.13 0.5 1.66 0.476 1.353 0.675 6 250 0.13 1.0 1.42 0.545 1.035 0.657 7 250 0.15 0.3 1.02 0.435 0.966 1.960 8 250 0.15 0.5 1.82 0.480 1.863 0.813 9 250 0.15 1.0 1.50 0.592 2.139 0.965 10 420 0.10 0.3 0.88 0.500 1.449 0.624 11 420 0.10 0.5 1.64 0.518 1.449 0.580 12 420 0.10 1.0 0.80 0.791 2.277 0.923 13 420 0.13 0.3 0.72 0.491 0.557 0.363 14 420 0.13 0.5 1.70 0.514 1.274 0.798 15 420 0.13 1.0 1.16 0.830 2.070 0.827 16 420 0.15 0.3 0.84 0.489 0.552 0.522 17 420 0.15 0.5 1.20 0.624 1.380 0.457 18 420 0.15 1.0 1.14 0.822 1.449 0.572 19 710 0.10 0.3 0.84 0.654 0.724 1.204 20 710 0.10 0.5 1.32 0.792 0.414 0.147 21 710 0.10 1.0 1.18 1.166 1.138 0.160 22 710 0.13 0.3 1.20 0.662 0.398 1.588 23 710 0.13 0.5 1.32 0.818 0.955 1.465 24 710 0.13 1.0 2.50 1.330 1.513 0.916 25 710 0.15 0.3 1.92 0.838 1.035 1.787 26 710 0.15 0.5 3.08 0.760 0.621 0.967 27 710 0.15 1.0 1.50 0.989 1.518 0.601
4. Results and discussion
4.1 Main effect plots of S/N ratio for output responses
S/N ratio is the Signal-to-noise ratio, measuring the variation of the observation in a run. It is generally calculated to select the optimal conditions of input parameters for getting the best output results under a particular working conditions. The value of S/N ratio should be always maximum to reduce the effect of noise. There are three different formulae for calculating the S/N ratio depending on the type of responses. Here, smaller-is-better methodology has been implemented for each output responses which can be calculated as below:
8
4.1.1 Main effect plot for Surface roughness
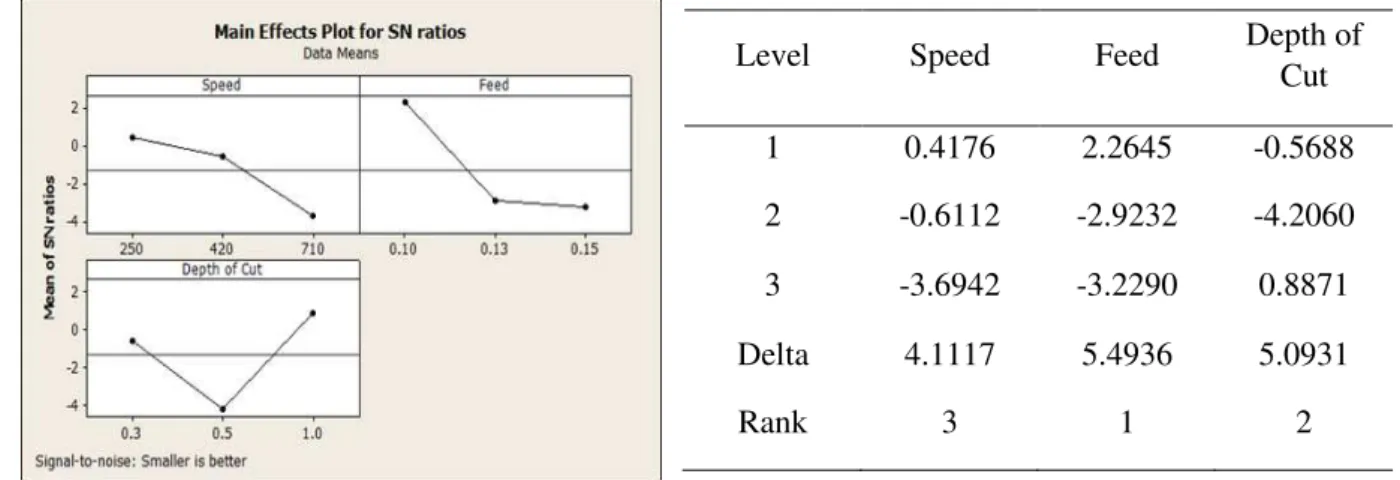
From the figure 4, it is evident that feed rate and depth of cut are more affecting parameters for surface roughness as compare to cutting speed. The optimal condition for the surface roughness is cutting speed = 250 rpm, feed rate = 0.10 mm/rev and depth of cut 1.0 mm. The response table is as shown below (Table 4):
Table 4: Response Table for Signal to Noise Ratio
Fig. 4. Main effect plot for Surface Roughness
4.1.2 Main effect plot for Power consumption
From the figure 5, it is apparent that cutting speed and depth of cut are more affecting parameters for power consumption as compare to feed rate. The optimal condition for the power consumption is cutting speed = 250 rpm, feed rate = 0.10 mm/rev and depth of cut 0.3 mm. The response table is as shown below (Table 5):
Table 5: Response Table for Signal to Noise Ratio
Fig. 5. Main effect plot for Power Consumption
4.1.3 Main effect plot for Chip reduction coefficient
Level Speed Feed Depth of Cut
1 0.4176 2.2645 -0.5688
2 -0.6112 -2.9232 -4.2060
3 -3.6942 -3.2290 0.8871
Delta 4.1117 5.4936 5.0931
Rank 3 1 2
Level Speed Feed Depth of Cut
1 6.260 4.043 5.614
2 4.373 4.041 4.319
3 1.250 3.799 1.951
Delta 5.010 0.244 3.663
9
From the figure 6, it is evident that depth of cut and cutting speed are more affecting parameters for chip reduction coefficient as compare to feed rate. The optimal condition for the chip reduction coefficient is cutting speed = 710 rpm, feed rate = 0.13 mm/rev and depth of cut 0.3 mm. The response table is as shown below (Table 6):
4.1.4 Main effect plot for Flank wear
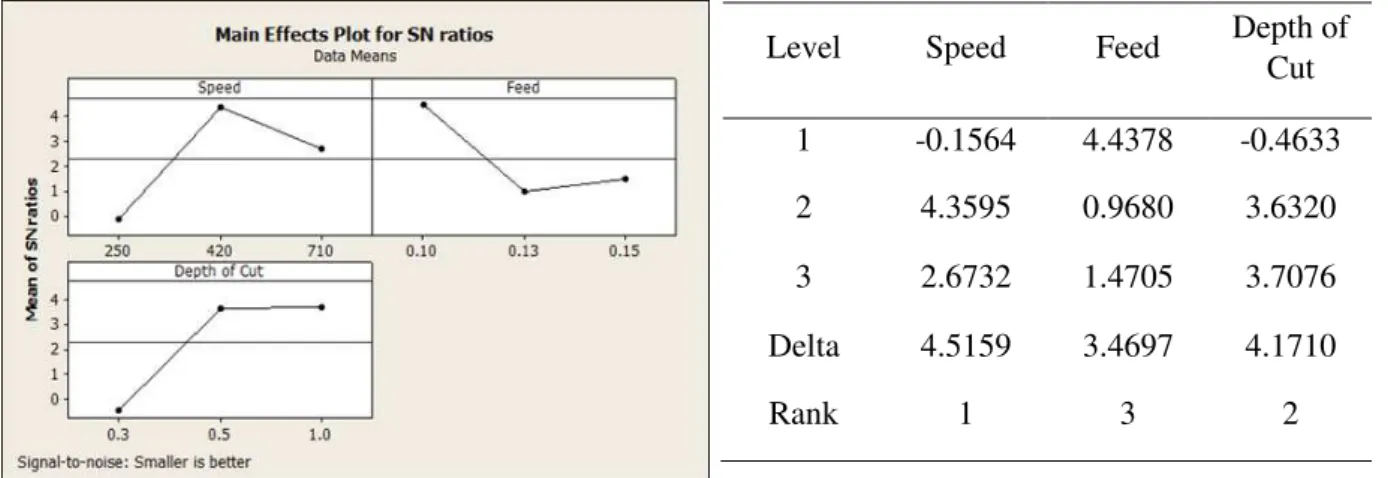
From the figure 7 it is apparent that cutting speed and depth of cut are more affecting parameters for power consumption as compare to feed rate. The optimal condition for the power consumption is cutting speed = 420 rpm, feed rate = 0.10 mm/rev and depth of cut 1.0 mm. The response table is as shown below (Table 7):
Table 7: Response Table for Signal to Noise Ratio
Fig. 7. Main effect plot for Flank Wear
4.2 Analysis of Variance (ANOVA)
ANOVA table is generally prepared to find the significant input parameters which will mostly effect the output responses. Analysis of variance table was prepared for each
output response with a significant level of α = 0.05 and confidence level of 95%. The sources present in the ANOVA table having P-Value less than 0.05 had been treated as the significant parameter for the respective output response.
Table 8. Analysis of Variance for Surface Roughness
Source DOF SS MS F-Value P-Value Remark
V 2 1.3307 0.6653 2.61 0.134 Non significant
F 2 1.4614 0.7307 2.86 0.115
D 2 1.5881 0.7941 3.11 0.100
V×F 4 1.0583 0.2646 1.04 0.445
F×D 4 0.8913 0.2228 0.87 0.520
V×D 4 0.3779 0.0945 0.37 0.824
Error 8 2.0422 0.2553
Total 26 8.7498
S = 0.505243 R-Sq = 76.66% R-Sq(adj) = 24.15%
Level Speed Feed Depth of Cut
1 -0.1564 4.4378 -0.4633
2 4.3595 0.9680 3.6320
3 2.6732 1.4705 3.7076
Delta 4.5159 3.4697 4.1710
10
The above table shows that, for surface roughness none of the parameters and no interactions have been found significant, since all the P-Values are greater than 0.05 (Table 8).
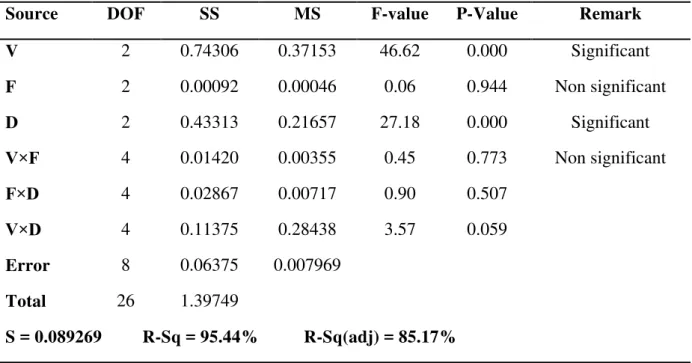
Table 9. Analysis of Variance for Power Consumption
Source DOF SS MS F-value P-Value Remark
V 2 0.74306 0.37153 46.62 0.000 Significant
F 2 0.00092 0.00046 0.06 0.944 Non significant
D 2 0.43313 0.21657 27.18 0.000 Significant
V×F 4 0.01420 0.00355 0.45 0.773 Non significant
F×D 4 0.02867 0.00717 0.90 0.507
V×D 4 0.11375 0.28438 3.57 0.059
Error 8 0.06375 0.007969
Total 26 1.39749
S = 0.089269 R-Sq = 95.44% R-Sq(adj) = 85.17%
From table 9, it was found that cutting speed and depth of cut are the two significant input parameters for power consumption during machining with a P-Value of 0.000. No interactions between the input parameters have been found significant for the power consumption.
Table 10. Analysis of Variance for Chip reduction co-efficient
Source DOF SS MS F-value P-Value Remark
V 2 2.0316 1.0158 7.90 0.013 Significant
F 2 0.8347 0.4173 3.25 0.093 Non significant
D 2 4.2035 2.1018 16.35 0.001 Significant
V×F 4 1.5901 0.3975 3.09 0.082 Non significant
F×D 4 0.2602 0.0650 0.51 0.733
V×D 4 0.6443 0.1611 1.25 0.363
Error 8 1.0285 0.1286
Total 26 10.5929
S = 0.358554 R-Sq = 90.29% R-Sq(adj) = 68.45%
11
Table 11. Analysis of Variance for Flank Wear
Source DOF SS MS F-value P-Value Remark
V 2 1.0356 0.5178 11.47 0.004 Significant
F 2 0.3117 0.1558 3.45 0.083 Non significant
D 2 1.3430 0.6715 14.88 0.002 Significant
V×F 4 0.9558 0.2389 5.29 0.022
F×D 4 0.2177 0.0544 1.21 0.379 Non significant
V×D 4 1.4826 8.21 8.21 0.006 Significant
Error 8 0.3611 0.0451
Total 26 5.7075
S = 0.21244 R-Sq = 93.67% R-Sq(adj) = 79.44%
Table 11 shows that for power consumption, cutting speed and depth of cut are significant parameters with P-Values 0.004 and 0.002 respectively. Interaction between speed-feed and speed-depth of cut have been found significant with P-Values 0.022 and 0.006 respectively.
4.3 Regression analysis equations
Regression analysis is a statistical process for estimating the relationships among variables. It includes many techniques for modelling and analyzing several variables, when the focus is on the relationship between a dependent variable and one or more independent variables. In this paper we have been used multiple regression analysis equations for each output responses, which are represented as under:
(A) Regression Equation for surface roughness
Surface Roughness = 2.44319 - 0.0032849×V - 7.6283×F - 2.49776×D + 0.023989 × D×F
+ 0.00192379×V×D + 12.5776×F×D (4)
(B) Regression Equation for power consumption
Power Consumption = 0.153099 + 0.000263702×V + 1.07576×F + 0.13611×D - 2.65104e-
005×V×F + 0.00101988×V×D - 1.38225× F×D (5)
(C) Regression Equation for Chip reduction co-efficient
Chip reduction co-efficient = 3.30642 - 0.00579908×V - 18.8319×F + 2.66761×D +
0.0386457×V×F - 0.000892791×V×D - 7.42072×F×D (6)
(D) Regression Equation for Flank Wear
Flank Wear = 1.19564 - 0.00250901×V - 2.03003×F + 1.04905×D + 0.0251448×V×F–
0.00125295×V×D - 8.33435×F×D (7)
12
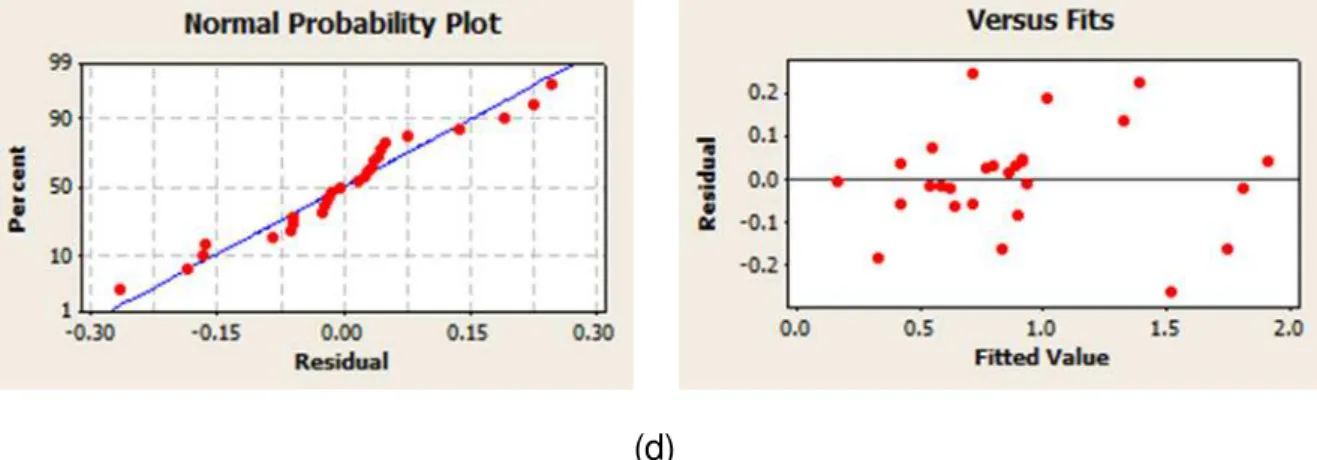
To check the validation or the authenticity of the above statistical model normal probability plot and residual versus fits plot is generally drawn. If the residual points will be scattered in the residual versus fits plot and if the residual points will follow a straight line in the normal probability curve, it has evident that the model will be validate. There will be no inadequacy in the model and there will no unusual structure in the model. It will predict better result in future. So from the graphs as shown in figure 8, it has been cleared that our statistical model is an authenticate model.
(a)
(b)
13
(d)
Fig. 8. Normal Probability plots and Residual versus Fits Plots for:
(a) Surface roughness (b) Power consumption (c) Chip reduction coefficient and (d) Flank wear
5. Conclusion
From the above experimental study we conclude the following points for individual output responses:
1. Feed is the influencing parameter which only affects the surface roughness of the workpiece. It is not significant for the other output responses i.e. power consumption, chip reduction coefficient and tool wear.
2. Speed can be consider as the most influencing parameter for power consumption and flank wear but its effect is very negligible for surface roughness and chip reduction coefficient. 3. Depth of cut is the most significant machining parameter which affects the chip reduction coefficient but less significant for all other responses i.e. surface roughness, power
consumption and flank wear.
14 References
[1] Bagawade A.D., Ramdasi P.G. and Pawade R.S. The effects of cutting conditions on chip area ratio and surface roughness in hard turning of AISI 52100 steel. International Journal of Engineering research and Technology, 2012; 1: 1-6.
[2] Chou Y. K. and Song H. Thermal modelling for white layer predictions in finish turning. International Journal of Machine Tools and Manufacture, 2005; 45: 481-495
[3] DeliJaiCov S., Leonardi F., Bordinassi E.C. and Batalha G.F. Improved model to predict surface roughness based on cutting vibrations signal during hard turning. Archives of
materials science and Engineering, 2010; 45:102-107.
[4] Fnides B., Yallese M.A., Mabrouki T. and Rigal J. F. Surface roughness model in turning hardened hot work steel using mixed ceramic tool. ISSN 1392-1207 Mechanika, 2009; 3(77): 68-73.
[5] Gowd G.H., Reddy M.G. and Sreenivasulu B. Empirical modelling of hard turning process of Inconel using response surface methodology. International Journal of Emerging Technology and Advanced Engineering, 2012; ISSN 2250-2459.
[6] Kumar K.A., Ratnam Ch., Murthy BSN., Ben B.S. and Reddy K.R.R.M., Optimisation of surface roughness in face turning operation in machining of EN-8. International Journal of Engineering Science and Emerging Technology, 2012; 807-812.
[7] Motorcu A.R. The optimisation of machining parameters using the Taguchi method for surface roughness of AISI 8660 hardened alloy steel. Journal of Mechanical Engineering, 2010; 56: 391-401.
[8] Ozel T., Hsu T.K. and Zeren E. Effects of Cutting edge geometry work piece hardness, feed rate and cutting speed on surface roughness and forces in finish turning of hardened AISI H13 steel. International Journal of Advance Manufacturing Technology, 2005; 25: 262-269. [9] Ozel T. and Karpat Y. Predictive modelling of surface roughness and tool wear in hard turning using regression and neural networks. International Journal of machine Tools and Manufacture, 2005; 45: 467-469.
[10] Puh F., Segota T. and Jurkovic Z. Optimisation of hard turning process parameters with PCBN tool based on the Taguchi method. Technical Gazette, 2012; 19: 415-419.
[11] Ramanujam R. Taguchi multi machining characteristics optimisation in turning of Al-15 SiCP composites using desirability function analysis. Journal of studies of Manufacturing, 2010; 120-125.
15 [13] Salvi S.B., Deshmukh R.R. and Deshmukh S.D. Analysis of surface roughness in hard turning by using Taguchi method. International Journal of Engineering Science and
Technology, 2013; 5:365-370.
[14] Singh D. and Rao P. V. A surface roughness prediction model for hard turning process. International Journal of Advance Manufacturing Technology, 2007; 32: 1115-1124.
[15] Suresh P.V.S., Rao P.V. and Deshmukh S.G. A genetic algorithm approach for