Article
Printed in Brazil - ©2018 Sociedade Brasileira de Química*e-mail: [email protected]
Magnetic Solid-Phase Extraction Combined with Dispersive Liquid-Liquid
Microextraction Followed by HPLC for Determination of Four Aromatic Amines
Released from Azo Dyes in Paper Samples
Xiaolan Li,a Dongling Meng,a Ruiqi Liub and Yaling Yang*,b
aTechnology Center, China Tobacco Guangxi Industrial Co., Ltd., 530000 Nanning, P.R. China
bFaculty of Life Science and Technology, Kunming University of Science and Technology,
Kunming, 650093 Yunnan, P.R. China
A novel extraction technique combining dispersive liquid-liquid microextraction (DLLME) with magnetic solid-phase extraction (MSPE) is presented for pre-concentration of four primary aromatic amines (PAAs) released from azo dyes in paper samples prior to high performance liquid chromatography (HPLC). n-Octanol was used as the extractant and hydrophobic oleic acid modified Fe3O4 nanoparticles (Fe3O4@OA NPs) as an efficient adsorbent was applied to retrieve the
PAAs-containing n-octanol in the DLLME step. Because of the rapid mass transfer associated with the DLLME and MSPE steps, fast extraction could be achieved. The main parameters affecting the efficiency of MSPE-DLLME procedure of PAAs were investigated and optimized. Under optimum conditions, the recoveries ranged from 79.6 to 88.5% and the limits of detection (LODs) were in the range of 0.21-1.16 ng mL-1 (S / N = 3). The intra-day precision (relative standard deviation
(RSD)) was below 7.8% and inter-day RSD was less than 11%.
Keywords: aromatic amines, magnetic solid-phase extraction, dispersive liquid-liquid microextraction, paper samples
Introduction
Primary aromatic amines (PAAs) are widely used in industry, in the production of dyes, cosmetics, pesticides, pharmaceuticals and as the intermediate in many chemical syntheses.1,2 Research showed that many aromatic amines
could cause damage to desoxyribonucleic acid (DNA) and reacted positively in mutagenicity tests.3 Many of these
amines are known to be highly mutagenic and carcinogenic and to form adducts with proteins and DNA.4,5 According
to the European Union (EU) regulations for food contact materials,6,7 the limit of PAAs released by the packaging
material (expressed as aniline) must be below 10 µg aniline equivalent per kg of food.8 The German Federal Institute
of Consumers Health Protection and Veterinary Medicine (BgVV) established a spectrophotometric method to determine the total content of PAAs in food packaging materials some years ago.9 PAAs can be produced by the
decomposition of azo dyes used in printing inks, as the chromophoric azo group under certain conditions can be reduced to form aromatic PAAs. Since the matrices in which
PAAs are present are very complex and the concentrations in samples are in the trace levels, the analytical methodologies to determine these compounds must be sensitive, selective and precise to establish a reliable relationship between intake and effects in human health.
Analysis of PAAs is often performed by classical high performance liquid chromatography (HPLC)10,11 and gas
chromatography (GC).12,13 However, two-step derivatization
is generally required to improve the GC properties because of the polarity of the amines.14 Hence, HPLC analysis
seems to be a good alternative to analysis since it requires only one-step derivatization. In addition, chromatographic techniques are usually limited by low sensitivity. To overcome this drawback, several pre-concentration procedures such as solid-phase microextraction (SPME),15,16 solid-phase
extraction (SPE),8 liquid-phase microextraction (LPME),17
liquid-liquid-liquid microextraction (LLLME),18,19 stir
bar sorptive extraction (SBSE),2 dispersive
liquid-liquid microextraction (DLLME),20 hollow fiber based
microextraction (HFME),21 and microporous membrane
liquid-liquid extraction (MMLLE)22 have been developed
Magnetic solid-phase extraction (MSPE) is a promising sample pretreatment technique23 and categorized as a SPE
technique.24 In recent years, nanoparticles (MNPs) have
gained popularity as acceptor phases due to their higher specific surface area (surface area-to-volume ratio).25 The
higher the interfacial area between extractant and sample, the faster the mass transfer, thus equilibrium is reached sooner.26 Moreover, several surface modifications have been
proposed to improve MNPs capacity, such as polymers, surfactants,27 biological receptors,28 gold,29 carbon30 or
silica shells,31 etc. The surfactant-coated MNPs could be
physisorbed or chemisorbed depending on the nature of the interaction with surfactant and nanoparticle. For instance, oleic acid (OA) was used as a surfactant chemically adsorbed in MNPs to extract fatty acids.32
Dispersive liquid-liquid microextraction (DLLME) is a novel sample preparation technique offering high enrichment factors from low volumes of water samples.33
Advantages of DLLME in simplicity, low cost and ease of method development have made it available to virtually all analytical laboratories.20 In DLLME, target analytes
were extracted from water to small volumes of extraction solvent and it has been applied for the extraction of different compounds, such as polycyclic aromatic hydrocarbons34
and chlorophenols35 or aromatic amines.36 The method
based on DLLME combined with MSPE made innovative use of magnetic particles and overcame the need for time consuming steps associated with DLLME such as centrifugation or cooling.37-39
In this work, the azo dyes in paper samples were reduced by sodium dithionite to produce carcinogenic aromatic amines in the presence of citrate buffer. The method of MSPE-DLLME followed by HPLC was developed for the determination of released aromatic amines. n-Octanol was used as the extractant, and hydrophobic oleic acid modified Fe3O4 nanoparticles (Fe3O4@OA NPs)
as an efficient adsorbent was applied to retrieve the PAAs containing n-octanol in the DLLME step. Because of the rapid mass transfer associated with the DLLME and the MSPE steps, extraction equilibrium could be achieved quickly. Parameters affecting the efficiency of extraction were investigated and optimized with standard solutions. Under the optimum conditions, good reproducibility, sensitivity and recoveries could be achieved.
Experimental
Materials
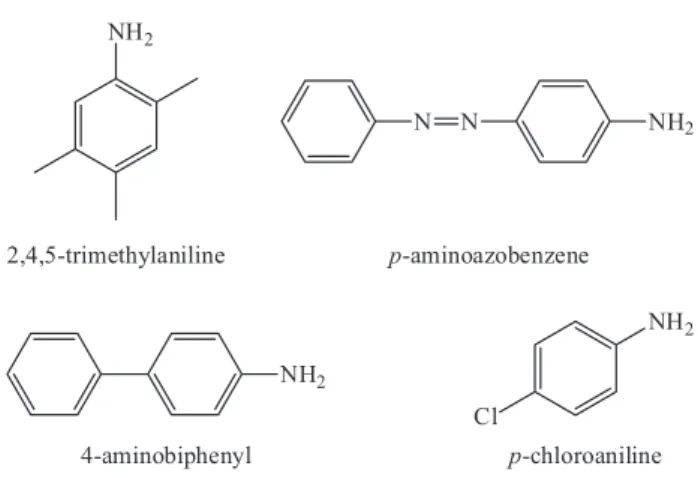
All reagents were analytical grade and used as supplied. Standards of 4-aminobiphenyl (CAS: 92-67-1, pKa = 4.35),
2,4,5-trimethylaniline (CAS: 137-17-7), p-chloroaniline (CAS: 106-47-8, pKa = 4.15), and p-aminoazobenzene (CAS: 60-09-3, pKa = 4.47) were all purchased from
Bailingwei Technology Co., Ltd. (Beijing, China). Structures of four PAAs are shown in Figure 1.
Iron(II) chloride tetrahydrate (FeCl2.4H2O), iron(III)
chloride hexahydrate (FeCl3.6H2O) and ammonia
solution (NH4OH) were obtained from Zhiyuan Chemical
Reagent Co., Ltd. (Tianjin, China). The desorption solvents acetonitrile and methanol were purchased from Fengchuan Chemical Reagent Co., Ltd. (Tianjin, China). Acetonitrile (HPLC grade) was purchased from Merck (Germany). Decyl alcohol, n-octanol and octylic acid were supplied by Aladdin (Shanghai, China). Ammonium dihydrogen phosphate (NH4H2PO4), disodium hydrogen
phosphate (Na2HPO4), citric acid (C6H8O7), sodium
dithionite (Na2S2O4) and sodium hydroxide (NaOH)
were purchased from Fengchuan Chemical Reagent Co., Ltd. (Tianjin, China). Deionized water was prepared with a Milli-Q system (USA). Phosphate buffer solution was prepared by adding 0.575 g NH4H2PO4 and 0.7 g
Na2HPO4 to 1000 mL double distilled deionized water to
the required pH value.
Instruments and HPLC conditions
Chromatographic separation and quantification were performed on Agilent 1260 Series HPLC system (Agilent Technologies, USA) with a reversed phase C18 analytical column of 150 × 4.6 mm (Agilent TC C18) at column temperature of 30 °C. Acetonitrile and phosphate buffer solution (30mM NH4H2PO4 + Na2HPO4, pH = 6.9) were
used as mobile phases with the gradient program as follows: 15% acetonitrile (0 min), ramped to 80% acetonitrile (35 min). The flow rate was 1.0 mL min-1 and the injection
volume was 10 µL. The wavelength was set at 240 nm.
A transmission electron microscope (TEM) HitachiH-800 (Tokyo, Japan) was used to characterize the modified and unmodified magnetic adsorbents. X-ray powder diffraction (XRD) patterns of Fe3O4 NPs and
modified Fe3O4 NPs were collected on a Rigaku D/max
2200 powder diffraction meter (Tokyo, Japan). Chemical interactions were studied using an IRTracer-100 Fourier transformed infrared spectrometer (FTIR, Shimadzu, Japan) in the range of 400-4000 cm-1. Vortex mixer (Shanghai,
China) was used to accelerate mass transfer efficiency. A pH-meter (PHS-3C) was used for pH measurements. An Nd-Fe-B strong magnet (15 × 12 × 5 cm, 1.4 Tesla magnet) was used for adsorbents collection and magnetic decantation.
Synthesis of Fe3O4@OA NPs
Analogously to the synthesis method of Fe3O4@OA NPs,
which was a co-precipitation method,32 the procedure was
as follows: 0.52 g FeCl2.4H2O and 1.41 g FeCl3.6H2O were
dissolved in 50 mL deionized water. The solution was heated to 80 °C with vigorous stirring. 5 mL of ammonia solution (NH3.H2O) was added rapidly into the solution. The
resulting suspension was vigorously stirred for 5 min. Then, 1 mL oleic acid was added into the suspension. The reaction was kept at 80 °C for 25 min with constant stirring under N2 atmosphere. The resulting precipitate was separated
by a magnetic field and washed with deionized water for three times and twice with absolute ethyl alcohol, and then the suspension was completely decanted by magnetic decantation and re-dispersed in 100 mL of deionized water. The concentration of Fe3O4@OA NPs was estimated to be
20 mg mL-1. Finally, the synthesized Fe
3O4@OA NPs were
stored at 4 °C.
Preparation of standard solutions and samples
A standard solution of 100 µg mL-1 of each aromatic
amine was prepared in acetonitrile and renewed monthly. Different types of paper samples were purchased from local commercial stores and kept at room temperature until their analysis.
The azo dyes in cigarette papers and colored paper napkin samples could be reduced to aromatic amines for analysis.40 The reduction reaction procedure was
accomplished as follows: the samples were cut into 5 × 5 mm fragments, mixed evenly. An accurately weighed amount of cigarette paper sample (1.0 g) was placed in the 50 mL centrifuge tube. Then, p-aminoazobenzene samples were soaked to 20 mL of 0.5 M sodium hydroxide solution (20 mL of citrate buffer solution (pH = 6) for
the other PAAs samples) until the temperature reached (70 ± 2 °C and then kept at this temperature for 30 min. 3 mL of a freshly prepared Na2S2O4 solution with an
adequate concentration (200 mg mL-1), were added to
the solution and left for 30 min at constant temperature (70 °C) to accomplish the reaction. Then, the tube was cooled to room temperature. The released amines were subsequently extracted and concentrated by DLLME and MSPE.
MSPE-DLLME procedure
For this extraction procedure, 1 mL sample solution was diluted to 10 mL with deionized water spiked with 100 ng mL-1 of each PAAs. 70 µL of n-octanol was added
to the sample solution and stirred with a vortex agitator for 2 min. 100 µL of above Fe3O4@OA NPs suspension
was added to the solution. The mixture was vortex mixed for another 2 min. Then, Fe3O4@OA NPs were separated
quickly from the sample solution by using an external magnet, the supernatant was decanted and MNPs were eluted by 1 mL of methanol and vortex mixing for 2 min. Finally, the eluent was isolated from MNPs by using an external magnet and filtered by a 0.45 µm membrane and injected into the HPLC instrument for subsequent analysis.
Results and Discussion
Characterization of magnetic nanoparticles
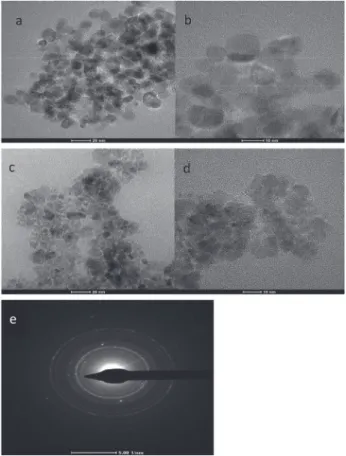
The hydrophobic MNPs are shown via transmission electron microscopy (TEM) for bare and coated MNPs. As shown in Figures 2a-2d, the particle size was greatly reduced after coating procedure. This may be due to the fact that bare MNPs have strong magnetic dipole-dipole interaction and hence are attracted strongly and form big clusters causing bigger particle size, but after efficient coating of MNPs, a non-magnetic layer is formed on the surface of each particle which prevents increase in particle size. The selected area electron diffraction (SAED) patterns for Fe3O4@OA NPs are shown in Figure 2e.
It shows bright ring patterns indicating polycrystalline nature of the MNPs.
FTIR spectra of hydrophobic MNPs (Figure 3) represent absorption bands at 1519 and 1631 cm-1, which are related
to the vibration of the carboxyl group (COO–), and bands at
2850 and 2920 cm-1 (b), which correspond to the stretching
of the C−H bonds of the oleic acid molecule.41 The band at
3211 cm-1 is ascribed to the stretching of the N
−H bonds
Effect of the type and the volume of extraction solvent
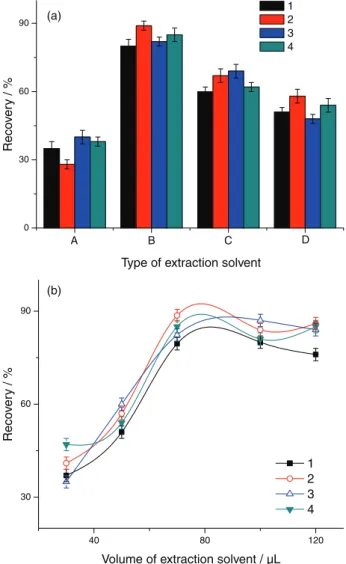
Selection of extractant is of great importance in DLLME in order to obtain an efficient extraction performance. Choosing the extractant is influenced by several requirements. First of all, the solvent should be immiscible with aqueous solution and should have low density relative to water. Second, the target analytes should have good solubility in the selected solvent to ensure high extraction enrichment. Additionally, the solvent should have a low vapor pressure to prevent loss during agitation. According to these requirements, n-octanol and n-decyl alcohol and n-octylic acid were chosen to investigate the extraction efficiency of four PAAs. As can be seen in Figure 4a, n-octanol was found to give the highest extraction efficiency for all analytes. Therefore, the n-octanol was chosen as extraction solvent for the subsequent experiments.
To evaluate the effect of the volume of extraction solvent, the experiments were evaluated by adding different volumes of n-octanol in the range of 30-120 µL. As can be seen in Figure 4b, the extraction recovery of PAAs increased with the increase of n-octanol and remained constant. Therefore, 70 µL of n-octanol was selected as the optimum volume of extraction solvent for further experiments.
Effect of the adsorbent amount
In order to study the effect of the amount of adsorbent on the extraction efficiency, 50-200 µL of Fe3O4@OA NPs
were added to the sample solution. The obtained results (in Figure 5) showed that by increasing the adsorbent amount up to 100 µL, extraction recovery slowly increased, due to
Figure 2. TEM image of: (a, b) Fe3O4 NPs; (c, d) Fe3O4@OA NPs; (e)
selected area electron diffraction (SAED) pattern for Fe3O4@OA NPs.
Figure 3. FTIR spectra of (a) Fe3O4; (b) Fe3O4@OA; (c) Fe3O4@OA@
the increase of accessible sites, and then remained constant. It can be attributed to higher surface area-to-volume ratio of Fe3O4@OA NPs. Therefore, 100 µL of Fe3O4@OA NPs
could achieve satisfactory results.
Effect of the pH
As mentioned above, the target PAAs are potentially ionizable compounds. The pH is one of the prime factors influencing the adsorption behavior of a mixed hemimicelles system due to the different charge density of Fe3O4@OA NPs surface at the different working pH. In this
sense, pH values ranging from 3.0 to 10.0 were studied. As can be seen in Figure 6, recoveries of four PAAs decrease slightly when pH value increases from 7.0 to 10.0. This may be explained by the fact that negative ions in solution and on the surface of Fe3O4@OA NPs compete for adsorption
for the positive ions of surfactant at high pH, which goes against the mixed hemimicelles formation on the surface of Fe3O4@OA NPs. Therefore, pH = 6.0 is selected for the
following studies.
Vortex mixing and magnetic separation time
It is found that, as the agitation speed increased, the extraction efficiency improved significantly.24 The vortex
mixing in MSPE-DLLME was used to disperse n-octanol to directly extract the analytes within a short time, and was designed to absorb n-octanol that contained the target compounds. Therefore, a series of vortex mixing times were evaluated. Experimental results (in Figure 7) showed that 2 min is sufficient for achieving satisfactory extraction of four PAAs. Furthermore, the unique magnetic responsivity
0 30 60 90
1 2 3 4
A B C D
40 80 120
30 60 90
Volume of extraction solvent / µL Type of extraction solvent
Reco
ver
y /
%
Reco
ver
y /
%
1 2 3 4 (a)
(b)
Figure 4. (a) The effect of the type of extraction solvent: (A) Fe3O4@OA NPs,
(B) Fe3O4@OA@n-octanol NPs, (C) Fe3O4@OA@n-decyl alcohol NPs, (D) Fe3O4@OA@n-octylic acid NPs; (b) the effect of the volume of extraction solvent. (1) p-Chloroaniline, (2) 2,4,5-trimethylaniline, (3) 4-aminobiphenyl, (4) p-aminoazobenzene.
Figure 5. The effect of the adsorbent amount. (1) p-Chloroaniline;
(2) 2,4,5-trimethylaniline; (3) 4-aminobiphenyl; (4) p-aminoazobenzene.
Figure 6. The effect of pH. (1) p-Chloroaniline; (2) 2,4,5-trimethylaniline;
(3) 4-aminobiphenyl; (4) p-aminoazobenzene.
0 30 60 90
1 2 3 4
A B C D
40 80 120
30 60 90
Volume of extraction solvent / µL Type of extraction solvent
Reco
ver
y /
%
Reco
ver
y /
%
1 2 3 4 (a)
of Fe3O4@OA NPs can accelerate adsorbent separation
from solution (about 30 s) with an external magnet in our experiments. Therefore, analysis time is shortened greatly compared with the traditional column passing SPE.
Desorption condition
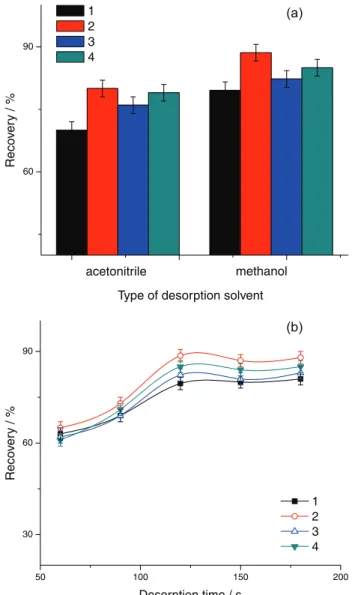
Desorption of analytes from the magnetic adsorbents was studied using different organic solvents (acetonitrile, methanol), which were known to rapidly and completely disrupt the mixed hemimicelles. According to the results shown in Figure 8a, it revealed the desorption ability of methanol was superior to that of acetonitrile. Quantitative recoveries of analytes (79.6-88.5%) were obtained with 1 mL of methanol. Therefore, methanol was selected as the desorption solvent. Desorption time was another important optimization factor. A variety of desorption times in the range from 1 to 5 min was studied by vortex mixing. As shown in Figure 8b, as the desorption time increased to 2 min, the adsorbed analytes could be eluted under continuous vortex mixing, and the system had reached the desorption balance. Therefore, Fe3O4@OA NPs were vortex mixed for 2 min in
each desorption process in order to achieve complete elution.
Analytical validation of the method
Table 1 and Figure 9 summarize quantitative parameters of the proposed method such as linearity, limits of detection (LODs), precision and sensitivity for extraction of PAAs from sample solutions. Under the optimized conditions, the calibration curves were linear with correlation coefficient ranging from 0.9969 to 0.9998 in the concentration level of 0.10-50 µg mL-1.
The proposed method was compared with Chinese National Standard43 for azo dye determination in textiles.
The Chinese National Standard for azo dye determination in textiles was as follows: the azo dyes in textile samples should be reduced by sodium dithionite to produce carcinogenic aromatic amines in the presence of citrate buffer medium. The aromatic amines in aqueous solution were isolated and purified with SPE, concentrated and analyzed by gas chromatography coupled with electron capture detector (GC-ECD). The data of intra- and inter-day precision and accuracy for the four PAAs in different paper samples are summarized in Table 2. Analytical results of this proposed method and Chinese National Standard for the four PAAs in different paper samples: (1) different cigarette papers, (2) different colored paper napkin samples, were calculated and shown in Table 3. The recoveries of the proposed method for the four PAAs in cigarette paper
Figure 7. The effect of stirring time on extraction. (1) p-Chloroaniline;
(2) 2,4,5-trimethylaniline; (3) 4-aminobiphenyl; (4) p-aminoazobenzene.
60 90
Type of desorption solvent 1
2 3 4
acetonitrile methanol
Reco
ver
y / %
50 100 150 200
30 60 90
Desorption time / s
1 2 3 4
Reco
ver
y /
%
(a)
(b)
Figure 8. Desorption condition: (a) the type of desorption solvent;
(b) desorption time. (1) p-Chloroaniline; (2) 2,4,5-trimethylaniline; (3) 4-aminobiphenyl; (4) p-aminoazobenzene.
60 90
Type of desorption solvent 1
2 3 4
acetonitrile methanol
Reco
ver
y / %
50 100 150 200
30 60 90
Desorption time / s
1 2 3 4
Reco
ver
y /
%
(a)
were in the range of 79.6-88.5% at two spiked levels. The LODs for the four PAAs were from 0.21 to 1.16 ng mL-1
at a signal-to-noise ratio (S / N) of 3. It is evident that the proposed method has good feasibility and reliability. On the other hand, the advantages of the proposed method over the Chinese National Standard are faster operation, no need of large amounts of organic extraction solvent, and low extraction time.
Efficiency of the proposed method was evaluated by comparing the obtained results with those of other reported pretreatment techniques and given in Table 4. The comparison results showed that the proposed method has the advantage over most of the previous methods due to time saving property for sample preparation, lower LOD
and wider linear ranges. Moreover, this method can achieve satisfactory recoveries within a very short extraction time and a small amount of adsorbent.
The developed method was successfully applied for determination of four PAAs in paper samples. Figure 10 shows typical HPLC chromatograms of extracted and pre-concentrated PAAs. Figure 10a shows the chromatogram of the paper spiked with PAAs by MSPE-DLLME, and Figure 10b shows the chromatogram of the paper sample spiked with PAAs by MSPE, meanwhile Figures 10c and 10d show the chromatograms of spiked and non-spiked runoff paper samples. The results indicate that the method is effective and feasible for the concentration and purification of trace amounts of PAAs released from azo dyes in real paper samples.
Conclusions
In this work, the method MSPE-DLLME followed by HPLC for the determination of four PAAs released from azo dyes in paper samples was developed. The method demonstrates that n-octanol can be used as extraction solvent without employing disperser solvent. The application of hydrophobic magnetic nanoparticles was to retrieve the PAAs-containing n-octanol. Under the optimum conditions, vortex mixing in the DLLME step for 2 min and in MSPE for 2 min and then desorption with methanol. Overall, this study indicates that the MSPE-DLLME method is suitable for conducting studies on referral infected of PAAs released from azo dyes in paper samples with sufficient specificity, simplicity and sensitivity.
Table 1. The performance characteristics of the proposed method
Analyte LDRa / (µg mL-1) Regression equation R2 b LODc / (ng mL-1)
2,4,5-Trimethylaniline 0.10-50 y = 40.611x − 0.5119 0.9988 1.16
p-Chloroaniline 0.10-50 y = 64.956x − 1.6193 0.9972 0.97
4-Aminobiphenyl 0.10-50 y = 10.205x + 4.5354 0.9969 0.21
p-Aminoazobenzene 0.10-50 y = 35.929x − 0.5443 0.9998 0.56
aLDR: linear dynamic range; bR2: square of correlation coefficient; cLOD: limit of detection.
Figure 9. The linear fitting of four PAAs: (y) the peak area of the
analyte; (x) the concentration of the analyte. (1) p-Chloroaniline; (2) 2,4,5-trimethylaniline; (3) 4-aminobiphenyl; (4) p-aminoazobenzene.
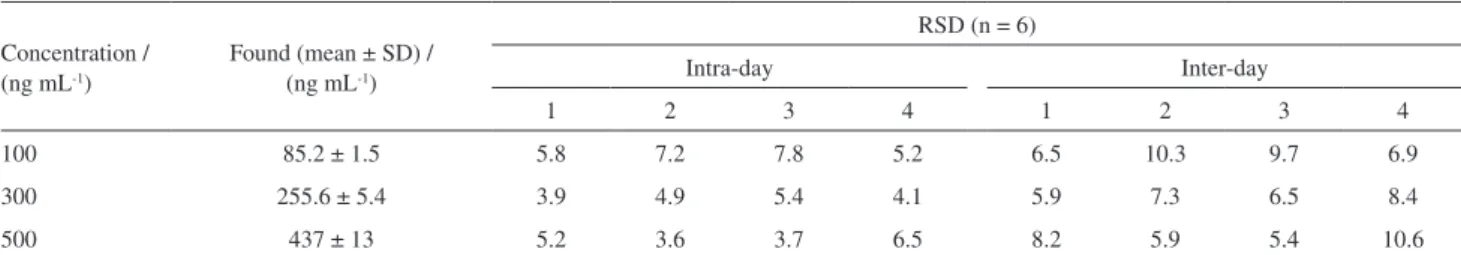
Table 2. Precision and accuracy for determination of PAAs in paper samples (n = 6, intra-day; n = 6, inter-day; series per day, 3 days)
Concentration / (ng mL-1)
Found (mean ± SD) / (ng mL-1)
RSD (n= 6)
Intra-day Inter-day
1 2 3 4 1 2 3 4
100 85.2 ± 1.5 5.8 7.2 7.8 5.2 6.5 10.3 9.7 6.9
300 255.6 ± 5.4 3.9 4.9 5.4 4.1 5.9 7.3 6.5 8.4
500 437 ± 13 5.2 3.6 3.7 6.5 8.2 5.9 5.4 10.6
SD: standard deviation; RSD: relative standard deviation. (1) p-Chloroaniline; (2) 2,4,5-trimethylaniline; (3) 4-aminobiphenyl; (4) p-aminoazobenzene.
0 10 20 30
0 1000 2000
1-y = 40.611x – 0.5119; R2 = 0.9988 2-y = 64.956x – 1.6193; R2
= 0.9972 3-y = 10.205x + 4.5354; R2
= 0.9969 4-y = 35.929x – 0.5443; R2
= 0.9998
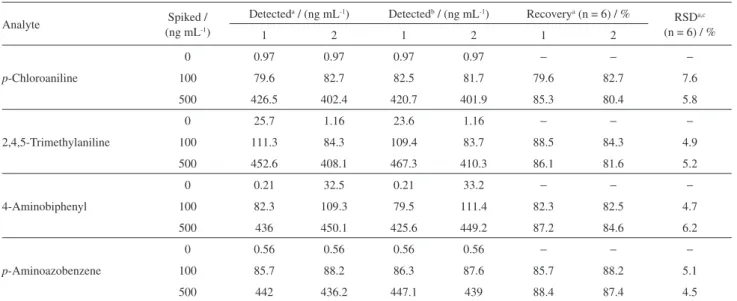
Table 3. Analytical results of determination of samples spiked with PAAs at two spiked levels
Analyte Spiked /
(ng mL-1)
Detecteda / (ng mL-1) Detectedb / (ng mL-1) Recoverya (n = 6) / %
RSDa,c (n = 6) / %
1 2 1 2 1 2
p-Chloroaniline
0 0.97 0.97 0.97 0.97 − − −
100 79.6 82.7 82.5 81.7 79.6 82.7 7.6
500 426.5 402.4 420.7 401.9 85.3 80.4 5.8
2,4,5-Trimethylaniline
0 25.7 1.16 23.6 1.16 − − −
100 111.3 84.3 109.4 83.7 88.5 84.3 4.9
500 452.6 408.1 467.3 410.3 86.1 81.6 5.2
4-Aminobiphenyl
0 0.21 32.5 0.21 33.2 − − −
100 82.3 109.3 79.5 111.4 82.3 82.5 4.7
500 436 450.1 425.6 449.2 87.2 84.6 6.2
p-Aminoazobenzene
0 0.56 0.56 0.56 0.56 − − −
100 85.7 88.2 86.3 87.6 85.7 88.2 5.1
500 442 436.2 447.1 439 88.4 87.4 4.5
aThe method of this work; bthe method of Chinese National Standard; cRSD: relative standard deviation. (1) Different cigarette papers; (2) different colored paper napkin samples.
Table 4. Comparison of different analytical methods applied to extract the PAAs
Analysis method Matrix Recovery / % LR / (ng mL-1) Extraction
time / min
LOD /
(ng mL-1) Reference
MIL-DLLME-HPLC vegetable oils 81.8-114.2 5.00-1000 7 1.31-1.49 1
HF-LLLME-HPLC water samples 88.5-105.4 0.5-500 30 0.05-0.1 44
HF-LPME-HPLC environmental water samples 80-103 5-200 80 0.5-1.5 45
IL-DLLME-HPLC water samples 93.4-106.4 2-200 4 0.45-2.6 46
LLLME-HPLC water 74.7-87.5 3-1000 20 0.8-1.80 47
SPME-HPLC water samples 55.3-104.7 5-5000 20 1.4-3.0 48
MSPE-DLLME-HPLC paper samples 79.6-88.5 10-5000 2 0.21-1.16 this work
LR: linear range; LOD: limit of detection; MIL-DLLME-HPLC: magnetic ionic liquid combined with dispersive liquid-liquid microextraction high-performance liquid chromatography; HF-LLLME-HPLC: hollow fiber combined with liquid-LLME-HPLC; HF-LPME-HPLC: HF combined with liquid-phase microextraction-HPLC; IL-DLLME-HPLC: ionic liquid combined with DLLME-HPLC; SPME-HPLC: solid-phase microextraction-HPLC; MSPE-DLLME-HPLC: magnetic solid-phase extraction combined with DLLME-HPLC.
Figure 10. The typical HPLC chromatograms of four PAAs: (a) sample spiked with PAAs by MSPE-DLLME (100 ng mL-1); (b) sample spiked with PAAs
Acknowledgments
The considerable support provided by the Analysis and Testing Center of Kunming University of Science and Technology is acknowledged.
References
1. Wang, Y.; Sun, Y.; Xu, B.; Li, X.; Jin, R.; Zhang, H.; Song, D.;
J. Chromatogr. A2014, 1373, 9.
2. Huang, X. J.; Qiu, N. N.; Yuan, D. X.; Lin, Q. M.; J. Chromatogr. A2009, 1216, 4354.
3. Asthana, A.; Bose, D.; Durgbanshi, A.; Sanghi, S. K.; Kok, W. T.; J. Chromatogr. A2000, 895, 197.
4. Akyüz, M.; Talanta2007, 71, 486.
5. Palmiotto, G.; Pieraccini, G.; Moneti, G.; Dolara, P.;
Chemosphere2001, 43, 355.
6. García-Lavandeira, J.; Salgado-Petinal, C.; Blanco, E.; Cela, R.; Anal. Bioanal. Chem.2010, 397, 751.
7. Li, R.; Zhang, Y.; Lee, C. C.; Lu, R.; Huang, Y.; J. Chromatogr. A2010, 1217, 1799.
8. Aznar, M.; Canellas, E.; Nerín, C.; J. Chromatogr. A2009, 1216, 5176.
9. Wang, X.; Chen, Y.; J. Chromatogr. A2009, 1216, 7324. 10. Cárdenes, L.; Ayala, J. H.; Afonso, A. M.; González, V.;
J. Chromatogr. A2004, 1030, 87.
11. Gennaro, M. C.; Marengo, E.; Chromatographia1988, 25, 603. 12. Akyüz, M.; Ata, S.; J. Pharm. Biomed. Anal.2008, 47, 68. 13. Hemvichian, K.; Ishida, H.; Polymer2002, 43, 4391. 14. Akyüz, M.; Atmos. Environ. 2008, 42, 3809.
15. Chang, W. Y.; Sung, Y. H.; Huang, S. D.; Anal. Chim. Acta2003,
495, 109.
16. Martín-Calero, A.; Ayala, J. H.; González, V.; Afonso, A. M.;
Anal. Bioanal. Chem.2009, 394, 937.
17. Reddy-Noone, K.; Jain, A.; Verma, K. K.; Talanta2007, 73, 684.
18. Zhou, Q. X.; Long, P.; Xie, G. H.; Xiao, J. P.; Li, P. P.; Bai, H. H.; Kou, Y. P.; Int. J. Environ. Anal. Chem.2010, 90, 1099. 19. Zhu, L.; Tay, C. B.; Lee, H. K.; J. Chromatogr. A2002, 963,
231.
20. Rezaee, M.; Yamini, Y.; Faraji, M.; J. Chromatogr. A2010, 1217, 2342.
21. Tao, Y.; Liu, J. F.; Wang, T.; Jiang, G. B.; J. Chromatogr. A
2009, 1216, 756.
22. Zhou, Q.; Jiang, G.; Liu, J.; Cai, Y.; Anal. Chim. Acta2004,
509, 55.
23. Jiménez-Soto, J. M.; Cárdenas, S.; Valcárcel, M.; Anal. Chim. Acta2012, 714, 76.
24. Shi, Z. G.; Lee, H. K.; Anal. Chem. 2010, 82, 1540.
25. Royston, E.; Ghosh, A.; Kofinas, P.; Harris, M. T.; Culver, J. N.;
Langmuir2008, 24, 906.
26. Yadav, T.; Pfaffenbach, K.; US pat. 7007872 B2 2006 (US 10/898,852).
27. Alsmadi, N. A.; Wadajkar, A. S.; Cui, W.; Nguyen, K. T.;
J. Nanopart. Res.2011, 13, 7177.
28. Zhang, C.; Zhang, Z.; Yu, B.; Shi, J.; Zhang, X.; Anal. Chem. 2002, 74, 96.
29. Chithrani, B. D.; Chan, W. C.; Nano Lett. 2007, 7, 1542. 30. Aguiló-Aguayo, N.; Liu, Z. In Carbon Nanomaterials
Sourcebook: Nanoparticles, Nanocapsules, Nanofibers, Nanoporous Structures, and Nanocomposites, vol. II; Sattler, K. D., ed.; CRC Press: Boca Raton, 2016, ch. 18, p. 401. 31. Bonini, M.; Wiedenmann, A.; Baglioni, P.; Mater. Sci. Eng., C
2006, 26, 745.
32. Lan, Q.; Liu, C.; Yang, F.; Liu, S.; Xu, J.; Sun, D.; J. Colloid Interface Sci.2007, 310, 260.
33. Zgoła-Grześkowiak, A.; Grześkowiak, T.; TrAC, Trends Anal. Chem.2011, 30, 1382.
34. Shi, Z. G.; Lee, H. K.; Anal. Chem.2010, 82, 1540.
35. Moradi, M.; Yamini, Y.; Esrafili, A.; Seidi, S.; Talanta2010,
82, 1864.
36. Wang, X.; Fu, L.; Wei, G.; Hu, J.; Zhao, X.; Liu, X.; Li, Y.;
J. Sep. Sci. 2008, 31, 2932.
37. Pérez, R. A.; Albero, B.; Tadeo, J. L.; Sánchez-Brunete, C.;
Microchim. Acta2016, 183, 157.
38. Wang, N.; Shen, R.; Yan, Z.; Feng, H. ; Cai, Q.; Yao, S.; Anal. Methods2013, 5, 3999.
39. Mukdasai, S.; Thomas, C.; Srijaranai, S.; Anal. Methods2013,
5, 789.
40. Pinheiro, H. M.; Touraud, E.; Thomas, O.; Dyes Pigm.2004,
61, 121.
41. Ghosh, R.; Pradhan, L.; Devi, Y. P.; Meena, S. S.; Tewari, R.; Kumar, A.; Sharma, S.; Gajbhiye, N. S.; Vatsa, R. K.; Pandey, B. N.; J. Mater. Chem. 2011, 21, 13388.
42. Huang, H. Y.; Huang, T. C.; Lin, J. C.; Chang, J. H.; Lee, Y. T.; Yeh, J. M.; Mater. Chem. Phys.2013, 137, 772.
43. Chen, Y.; Zheng, Y. Y.; Yang, H. Y.; Zhu, Y.; Zhang, H. Y.; GB/T 17592-2011: Textiles - Determination of the Banned Azo Colourants; The Standardization Administration of the People’s Republic of China: China, 2011.
44. Zhao, L.; Zhu, L.; Lee, H. K.; J. Chromatogr. A 2002, 963, 239. 45. Tao, Y.; Liu, J. F.; Wang, T.; Jiang, G. B.; J. Chromatogr. A
2014, 1216, 756.
46. Fan, Y. C.; Hu, Z. L.; Chen, M. L.; Chao, S. T.; Zhu, Y.; Chin. Chem. Lett. 2008, 19, 985.
47. Yazdi, A. S.; Es’haghi, Z.; Talanta 2005, 66, 664.
48. Knize, M. G.; Salmon, C. P.; Hopmans, E. C.; Felton, J. S.;
J. Chromatogr. A1997, 763, 179.
Submitted: August 15, 2017 Published online: November 9, 2017