ARTIGO ORIGINAL
RESUMO
Introdução: O peso ao nascer é importante na morbimortalidade neonatal e está relacionado com o desenvolvimento de doenças crónicas na idade adulta. Este estudo pretende avaliar a utilização das curvas de crescimento Intergrowth 21st em alternativa às de
Fenton e Kim 2013 no diagnóstico de leve e grande para a idade gestacional num grupo de recém-nascidos Portugueses.
Material e Métodos: Estudo analítico e retrospetivo avaliando o peso ao nascer de recém-nascidos de termo e pré-termo segundo ambas as curvas de crescimento. Grupos estudados: ‘Termo-semanas’ e ‘Termo-dias’ (recém-nascidos de termo com idade gestacio-nal em semanas e dias, respetivamente), ‘Pré-termo-semanas’ e ‘Pré-termo-dias’ (recém-nascidos pré-termo com idade gestaciogestacio-nal em semanas e dias, respetivamente).
Resultados: Foram incluídos 14 056 recém-nascidos, 6% pré-termo. Usando as curvas de crescimento Intergrowth 21st, os grupos
‘Termo-semanas’ (n = 12 081), ‘Termo-dias’ (n = 1118), ‘Pré-termo-semanas’ (n = 617) e ‘Pré-termo-dias’ (n = 240) classificados como leves para a idade gestacional segundo Fenton e Kim 2013 foram classificados como adequados para a idade gestacional em 52,8%, 57,8%, 37,7% e 9,3% respetivamente; e 9,2%, 9,2%, 5,9% e 0,6% dos adequados para a idade gestacional foram classificados como grandes para a idade gestacional, respetivamente. No grupo ‘Pré-termo-dias’, 7,9% dos adequados para a idade gestacional seriam leves para a idade gestacional e 22,2% dos grandes para a idade gestacional seriam adequados para a idade gestacional, todos com idade gestacional abaixo de 231 dias.
Discussão: O uso do Intergrowth 21st nesta amostra resultou num menor número de recém-nascidos classificados como leves para a
idade gestacional, exceto nos recém-nascidos muito prematuros.
Conclusão: Tendo em conta os resultados obtidos, sugerimos que as maternidades portuguesas considerem a utilização das curvas de crescimento Intergrowth 21st em detrimento das de Fenton e Kim 2013. Contudo, mais estudos são necessários para confirmar
estes resultados.
Palavras-chave: Antropometria; Gráficos de Crescimento; Idade Gestacional; Peso ao Nascer; Portugal; Recém-Nascido; Recém---Nascido Prematuro
Performance of Intergrowth 21
Growth Charts in the
Diagnosis of Small and Large for Gestational Age in
Term and Preterm Newborns
O Desempenho das Curvas do Intergrowth 21
stno
Diagnóstico de Leve e Grande para a Idade Gestacional
em Recém-nascido de Termo e Pré-termo
1. Neonatology Service. Department of Pediatrics. Hospital Santa Maria. Centro Hospitalar e Universitário Lisboa Norte. Centro Académico de Medicina de Lisboa. Lisboa. Portugal. 2. Biomaths Laboratory. Faculty of Medicine. University of Lisbon. Lisbon. Portugal.
Autor correspondente: Bárbara Marques. [email protected]
Recebido: 25 de junho de 2018 – Aceite: 17 de junho de 2019 | Copyright © Ordem dos Médicos 2020
Bárbara MARQUES1, Rosa MARTINS1, Teresa RODRIGUES2, Graça OLIVEIRA1, Margarida ABRANTES1
Acta Med Port 2020 Jan;33(1):15-21 ▪ https://doi.org/10.20344/amp.10990 ABSTRACT
Introduction: Birth weight is a major contributor to neonatal morbidity and mortality and is associated with chronic diseases in adult-hood. This study aimed to evaluate the use of Intergrowth 21st instead of the Fenton & Kim 2013 growth charts in the diagnosis of small
and large for gestational age in a group of Portuguese newborns.
Material and Methods: We conducted an analytical and retrospective study to evaluate birth weight of term and preterm newborns using both growth charts. Groups studied: ‘Term-weeks’ and ‘Term-days’ (term newborns with gestational age in weeks and days, re-spectively), ‘Preterm-weeks’ and ‘Preterm-days’ (preterm newborns with gestational age in weeks and days, respectively).
Results: A total of 14 056 newborns were included, 6% preterm. Using the Intergrowth 21st growth charts, the groups ‘Term-weeks’
(n = 12 081), ‘Term-days’ (n = 1118), ‘Preterm-weeks’ (n = 617) and ‘Preterm-days’ (n = 240), classified as small for gestational age according to the Fenton & Kim 2013 growth charts were adequate for gestational age in 52.8%, 57.8%, 37.7% and 9.3% respectively; and 9.2%, 9.2%, 5.9% and 0.6% of adequate for gestational age newborns were large for gestational age, respectively. In the ‘Preterm-days’ group, 7.9% of adequate for gestational age newborns were small for gestational age and 22.2% of large for gestational age newborns were adequate for gestational age, all with gestational age below 231 days.
Discussion: The use of the Intergrowth 21st growth charts in this sample resulted in a lower number of newborns being classified as
small for gestational age, except in very preterm newborns.
Conclusion: Considering the results obtained, we suggest that Portuguese maternity hospitals use the Intergrowth 21st instead of the
Fenton & Kim 2013 growth charts. However, more studies are needed to confirm these results.
Keywords: Anthropometry; Birth Weight; Gestational Age; Growth Charts; Infant, Newborn; Infant, Premature; Portugal
INTRODUCTION
Birth weight is an important factor in neonatal morbidity and mortality, and is also associated with the development of chronic diseases in adulthood.1
According to the American Academy of Pediatrics, small for gestational age newborns are those with a birth weight below the 10th percentile for gestational age; adequate for
ARTIGO ORIGINAL gestational age newborns are those with a birth weight between the 10th and the 90th percentile and large for
gesta-tional age newborns are those with a birth weight above the 90th percentile.2 Other cut-offs were suggested as the third
and fifth percentile for the definition of small for gestational age and the 95th and 97th percentile for the definition of large
for gestational age.3
A newborn is small for gestational age due to constitu-tional reasons or because of fetal growth restriction (associ-ated, for example, with maternal conditions or socioeconom-ic factors). These newborns have a higher risk of neonatal complications, such as neonatal asphyxia, meconium aspi-ration syndrome, hypoglycemia, polycythemia, bronchopul-monary dysplasia, and neurodevelopmental disorders.4–7
Large for gestational age newborns present a greater pre-disposition for obstetric complications, traumatic delivery, hypoglycemia, hyperbilirubinemia, polycythemia, neonatal asphyxia, longer hospital stay and neonatal death.8,9 In the
long term, both situations are associated with metabolic syndrome, arterial hypertension, dyslipidemia, coronary disease and type 2 diabetes mellitus.10–13
Percentiles or z-score charts are applied to interpret birth weight. Growth expressed in percentiles or z-scores can be reference charts, describing how individuals grew at a given time and place; or standard charts, which reflect how individuals should grow when nutritional, environmen-tal, and health restrictions are minimal.14,15
The Fenton & Kim growth charts are widely used and were last updated in 2013.14,16 These charts are commonly
used in Portuguese maternity hospitals to evaluate birth weight in term and preterm newborns. They are almost standard charts that provide data between 24 and 50 weeks of gestational age for both genders. These charts result from a meta-analysis which included six studies from differ-ent countries conducted between 1991 and 2007 (Germany, Australia, Canada, Scotland, United States of America and Italy) with a total of 3 986 456 newborns with weight, head circumference and length of up to 40 weeks of gestational age. It also included the WHO Multicentre Growth Reference Study (2006) with 882 term newborns. Thus, these growth charts include birth weight data between 24 and 40 weeks of gestational age that result from a meta-analysis of six studies and birth weight data of term newborns from the WHO study.16 In order to harmonize the transition between
the anthropometry measurements of the meta-analysis group of newborns and the group of newborns from the WHO study, statistical softeners were used between 36 and 50 weeks of gestational age.16,17
However, the Fenton & Kim 2013 growth charts16 have
some limitations.14,17 These charts do not take into account
the physiological weight loss in the two weeks after birth in more immature preterm newborns, which influences their growth evaluation.14,16,17 On the other hand, between 36 and
50 weeks of gestational age, statistical smoothing was used to standardize data, which means that after 36 weeks of gestational age their use is not precise.16,17
The Intergrowth 21st (International Fetal and Newborn
Growth Consortium for the 21st Century) project aimed to
complement the WHO Multicentre Growth Reference Study (2006), developing international standards for fetuses, born infants and the postnatal growth period of preterm new-borns.17–19 This project was conducted between 2009 and
2014 in eight countries (Brazil, China, India, Italy, Kenya, Oman, United Kingdom and United States of America) with growth, health, nutrition and neurodevelopment from 14 weeks of gestational age to two years of age being stud-ied.18 The inclusion criteria were well defined. It included
low-risk and well-nourished pregnant women, with good pregnancy surveillance, whose fetuses showed adequate growth.18,19 The NCSS (Newborn Cross-sectional Study)
aimed to obtain standard curves of weight, length and head circumference at birth for gestational age. It included 20 486 newborns that fulfilled the inclusion criteria, with charts between 33 and 43 weeks of gestational age being obtained.19 Subsequently, 408 newborns younger than 33
weeks, some with risk factors for fetal growth restriction (ini-tially excluded), were added to the study in order to obtain data below 33 weeks of gestational age.20,21
Nevertheless, the project did not consider some fac-tors that could also influence birth weight, such as mater-nal and patermater-nal birth weight and matermater-nal weight gain during pregnancy. Therefore, local validation studies were suggested.22,23
This study aimed to evaluate the use of the Intergrowth 21st growth charts19,20 instead of the Fenton & Kim 2013
growth charts16 in the diagnosis of small and large for
ges-tational age in term and preterm newborns born to normal weight women with low-risk pregnancies in a Portuguese maternity hospital.
MATERIAL AND METHODS Type of study
A retrospective study was conducted in Santa Maria Hospital, Lisbon, Portugal, with data regarding birth notifi-cation between 2006 to 2015 and data from the Portuguese Very Low Birth Weight database between 2010 to 2015. All data used was from Santa Maria Hospital. Repeated data from the two sources were removed, and therefore data from the Portuguese Very Low Birth Weight database prevailed.
Given this was a retrospective study and that the analy-sis of data was anonymous, Ethical Committee approval was not considered required. Nevertheless all the proce-dures were done according to the regulations established by the Clinical Research and Ethics Committee and to the Helsinki Declaration of the World Medical Association.
Participants
Inclusion criteria were as follows: maternal age between 18 and 35 years, adequate pregnancy surveillance and absence of chronic maternal disease. Exclusion crite-ria were as follows: maternal obesity [body mass index (BMI) ≥ 30 kg/m2], any use of tobacco, alcohol or drugs
ARTIGO ORIGINAL assisted reproductive treatments, fetal growth restriction
(estimated fetal weight < 10th percentile), fetal
malforma-tions, stillbirths and deaths.
Variables
The following variables were analyzed: gestational age in weeks, gestational age in days (data not interchangea-ble), birth weight in grams, percentile of birth weight accord-ing to the Fenton & Kim 2013 growth chart,16 percentile of
birth weight according to Intergrowth 21st growth chart19,20
and percentile of birth weight according to Intergrowth 21st growth chart19,20 after categorization according to the
Fenton & Kim 2013 growth chart.16 Growth charts where
used according to gender.
Definitions
Both growth charts were applied to each newborn and the following categorization was used: small for gestational age (SGA) — birth weight below the 10th percentile;2
ade-quate for gestational age (AGA) — birth weight between the 10th and 90th percentile;2 large for gestational age (LGA) —
birth weight above the 90th percentile.2
Term newborns were defined as those who were born with gestational age of 37 weeks or more (259 days or more); and preterm newborns as those who were born with gestational age less than 37 weeks (258 days or less).
Four groups were considered: ‘Term-weeks’ group — term newborns with gestational age in weeks; ‘Term-days’ group — term newborns with gestational age in days; ‘Preterm-weeks’ group — preterm newborns with gestation-al age in weeks; ‘Preterm-days’ group — preterm newborns with gestational age in days.
Statistical analyses
Data was analyzed with Microsoft Excel 2010® and
IBM® SPSS® Statistics v.22.0®. For nominal or ordinal
vari-ables, descriptive statistics and exploratory data analysis
were applied, using absolute and relative frequencies, sim-ple or conditional. Scale variables were characterized with minimum and maximum values and median. The median was chosen as a measure of central tendency, being more adequate than the mean for clinical context. Statistical infer-ence was also used: inferinfer-ence about proportion was per-formed by 95% confidence intervals [95% CI (p)], based on the Wilson score method.
RESULTS
Sample description
The sample was composed of 14 056 newborns, of which 857 (6%) were preterm. In the group of term new-borns (n = 13 199) the median gestational age was 39 weeks (minimum 37 weeks, maximum 42 weeks), and the median birth weight was 3250 g (minimum 1240 g, maximum 5150 g). In the group of preterm newborns, the median gesta-tional age was 35 weeks (minimum 24 weeks, maximum 36 weeks), and the median birth weight was 2315 g (minimum 430 g, maximum 3905 g).
‘Term-weeks’ Group (Tables 1, 2 and 3)
This group consisted of 12 081 newborns. The medi-an gestational age was 39 weeks (minimum 37 weeks, maximum 42 weeks), and the median birth weight was 3255 g (minimum 1830 g, maximum 5150 g). According to the Fenton & Kim 2013 growth charts,16 1679 (13.9%),
10 155 (84.1%) and 247 (2.0%) newborns were classi-fied as SGA, AGA and LGA, respectively, and according to the Intergrowth 21st growth charts,19,20 792 (6.6%), 10 110
(83.7%) and 1179 (9.8%) newborns were classified as SGA, AGA and LGA, respectively. When applying the Intergrowth 21st growth charts19,20 after categorization with the Fenton &
Kim 2013 growth charts,16 792 (47.2%), 9223 (90.8%) and
247 (100%) were classified as SGA, AGA and LGA in both charts, respectively. However, 887 (52.8%) of those classi-fied as SGA in the Fenton & Kim 2013 growth charts16 were
Table 1 – Sample description: categorization in each group as SGA, AGA and LGA according to the Fenton & Kim 2013 growth chart and the Intergrowth 21st growth chart
Fenton & Kim 2013
% (n) Intergrowth 21 st % (n) ‘Term-weeks’ Group SGA 13.9 (1679) 6.6 (792) AGA 84.1 (10 155) 83.7 (10 110) LGA 2.0 (247) 9.8 (1179) ‘Term-days’ Group SGA 13.1 (147) 5.5 (62) AGA 85.2 (952) 84.9 (949) LGA 1.7 (19) 9.6 (107) ‘Preterm-weeks’ Group SGA 8.6 (53) 5.3 (33) AGA 85.4 (527) 83.6 (516) LGA 6.0 (37) 11.0 (68) ‘Preterm-days’ Group SGA 22.5 (54) 26.3 (63) AGA 73.8 (177) 70.4 (169) LGA 3.8 (9) 3.3 (8)
ARTIGO ORIGINAL
classified as AGA in the Intergrowth 21st growth charts19,20
[95% CI (p): 50.4% – 55.2%] and 932 (9.2%) of those clas-sified as AGA in the Fenton & Kim 2013 growth charts16
have been classified as LGA in the Intergrowth 21st growth
charts19,20 [95% CI (p): 8.6% – 9.8%]. ‘Term-days’ Group (Tables 1, 2 and 4)
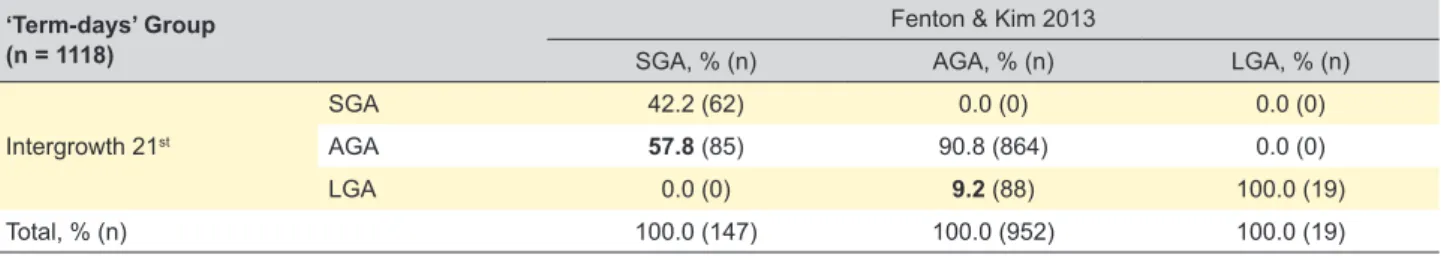
This group included 1118 newborns. The median ges-tational age was 278 days (minimum 259 days, maximum 292 days), and the median birth weight was 3240 g (mini-mum 1240 g, maxi(mini-mum 4395 g). The classification of SGA, AGA and LGA according to the Fenton & Kim 2013 growth charts16 and the Intergrowth 21st growth charts19,20 was
simi-lar to the previous group, as shown in Table 1. Likewise, when the Intergrowth 21st growth charts19,20 were applied
after categorization with the Fenton & Kim 2013 growth charts,16 62 (42.2%), 864 (90.8%) and 19 (100%) were
clas-sified as SGA, AGA and LGA in both charts, respectively. However, 85 (57.8%) newborns classified as SGA in the Fenton & Kim 2013 growth charts16 were classified as AGA
in the Intergrowth 21st growth charts19,20 [95% CI (p): 49.7%
– 65.5%] and 88 (9.2%) newborns classified as AGA in the Fenton & Kim 2013 growth charts16 have been classified as
LGA in the Intergrowth 21st growth charts19,20 [95% CI (p):
7.6% – 11.3%].
‘Preterm-weeks’ Group (Tables 1, 2 and 5)
A total of 617 newborns were studied in this group. The median gestational age was 35 weeks (minimum 25 weeks, maximum 36 weeks), and the median birth weight was 2490 g (minimum 705 g, maximum 3905 g). According to the
Fenton & Kim 2013 growth charts,16 53 (8.6%), 527 (85.4%)
and 37 (6.0%) newborns were classified as SGA, AGA and LGA, respectively, and according to the Intergrowth 21st
growth charts,19,20 33 (5.3%), 516 (83.6%) and 68 (11.0%)
newborns were classified as SGA, AGA and LGA, respec-tively. When the Intergrowth 21st growth charts19,20 were
applied after categorization with the Fenton & Kim 2013 growth charts,16 33 (62.3%), 496 (94.1%) and 37 (100%)
were classified as SGA, AGA and LGA in both charts, respectively. However, 20 (37.7%) newborns classified as SGA in the Fenton & Kim 2013 growth charts16 were
clas-sified as AGA in Intergrowth 21st growth charts19,20 [95% CI
(p): 25.9% – 51.2%] and 31 (5.9%) newborns classified as AGA in the Fenton & Kim 2013 growth charts16 have been
classified as LGA in the Intergrowth 21st growth charts19,20
[95% CI (p): 4.2% – 8.2%].
‘Preterm-days’ Group (Tables 1, 2 and 6)
In this group, 240 newborns were included. The median gestational age was 213 days (minimum 168 days, maxi-mum 258 days), and the median birth weight was 1295 g (minimum 430 g, maximum 3825 g). According to the Fenton & Kim 2013 growth charts,16 54 (22.5%), 177 (73.8%) and
9 (3.8%) newborns were classified as SGA, AGA and LGA, respectively, and according to the Intergrowth 21st growth
charts,19,20 63 (26.3%), 169 (70.4%) and 8 (3.3%) newborns
were classified as SGA, AGA and LGA, respectively. When the Intergrowth 21st growth charts19,20 were applied after
categorization with the Fenton & Kim 2013 growth charts16,
49 (90.7%), 162 (91.5%) and 7 (77.8%) were classified as SGA, AGA and LGA in both charts, respectively. However, 5 Table 2 – Group proportion analyses
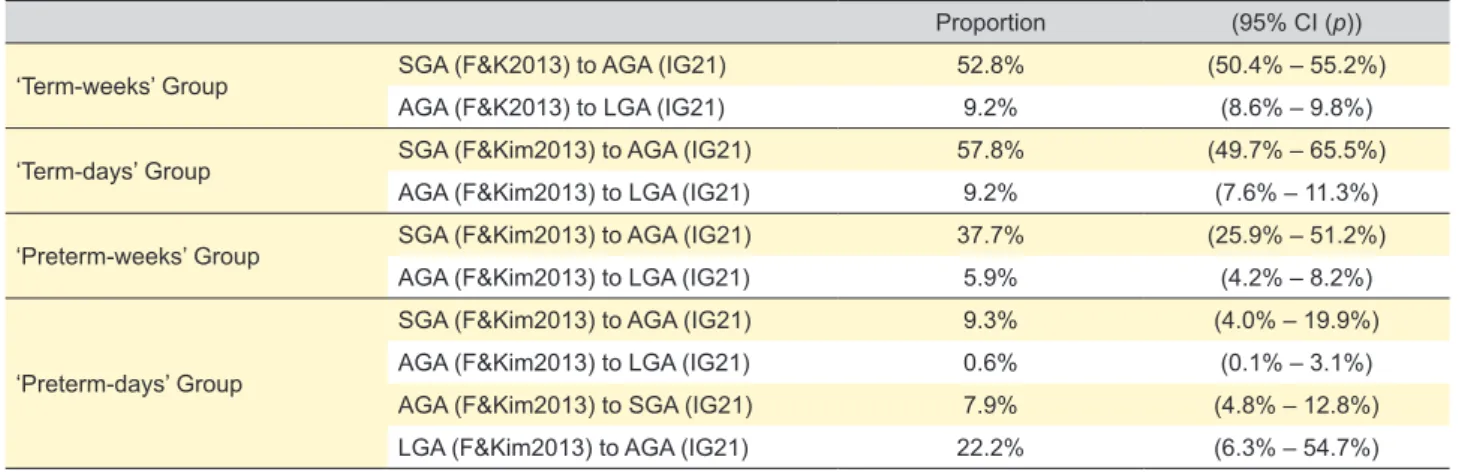
Proportion (95% CI (p))
‘Term-weeks’ Group SGA (F&K2013) to AGA (IG21) 52.8% (50.4% – 55.2%)
AGA (F&K2013) to LGA (IG21) 9.2% (8.6% – 9.8%)
‘Term-days’ Group SGA (F&Kim2013) to AGA (IG21) 57.8% (49.7% – 65.5%)
AGA (F&Kim2013) to LGA (IG21) 9.2% (7.6% – 11.3%)
‘Preterm-weeks’ Group SGA (F&Kim2013) to AGA (IG21) 37.7% (25.9% – 51.2%)
AGA (F&Kim2013) to LGA (IG21) 5.9% (4.2% – 8.2%)
‘Preterm-days’ Group
SGA (F&Kim2013) to AGA (IG21) 9.3% (4.0% – 19.9%)
AGA (F&Kim2013) to LGA (IG21) 0.6% (0.1% – 3.1%)
AGA (F&Kim2013) to SGA (IG21) 7.9% (4.8% – 12.8%)
LGA (F&Kim2013) to AGA (IG21) 22.2% (6.3% – 54.7%)
SGA: small for gestational age; AGA: adequate for gestational age; LGA: large for gestational age; F&K2013: Fenton & Kim 2013; IG21: Intergrowth 21st
Table 3 – ‘Term-weeks’ group categorization as SGA, AGA and LGA according to the Intergrowth 21st growth chart and the Fenton & Kim
2013 growth chart in each category ‘Term-weeks’ Group
(n = 12 081)
Fenton & Kim 2013
SGA, % (n) AGA, % (n) LGA, % (n)
Intergrowth 21st
SGA 47.2 (792) 0.0 (0) 0.0 (0)
AGA 52.8 (887) 90.8 (9223) 0.0 (0)
LGA 0.0 (0) 9.2 (932) 100.0 (247)
Total, % (n) 100.0 (1679) 100.0 (10 155) 100.0 (247)
ARTIGO ORIGINAL
(9.3%) newborns classified as SGA in the Fenton & Kim 2013 growth charts16 were classified as AGA in the Intergrowth
21st growth charts19,20 [95% CI (p): 4.0% – 19.9%] and 1
(0.6%) newborn classified as AGA in the Fenton & Kim 2013 growth charts16 was classified as LGA in the Intergrowth 21st
growth charts19,20 [95% CI (p): 0.1% – 3.1%]. Nevertheless,
below 231 days of gestational age (33 weeks, n = 183), there were 14 (7.9%) newborns classified as AGA in the Fenton & Kim 2013 growth charts16 which were classified
as SGA in the Intergrowth 21st growth charts19,20 [95% CI (p):
4.8% – 12.8%] and 2 (22.2%) newborns classified as LGA in the Fenton & Kim 2013 growth charts16 were classified as
AGA in the Intergrowth 21st growth charts19,20 [95% CI (p):
6.3% – 54.7%). This group under 231 days of gestational age had a median gestational age of 207 days (minimum 179 days, maximum 230 days) and a median birth weight of 964 grams (minimum 570 g, maximum 1880 g).
DISCUSSION
Although widely used in Portugal, the Fenton & Kim 2013 growth charts16 have some limitations.14,16,17 Therefore,
the existence of more reliable growth charts is important. Intergrowth 21st is a prospective, multiethnic,
multicen-tre and population-based project which showed that birth anthropometry was identical in low-risk women. Thus,
growth charts developed in this project were intended to be used both within populations and to compare different nationalities.15,18,19
Our study included a sample of Portuguese term and preterm newborns. It showed that fewer term newborns classified as small for gestational age were observed when the Intergrowth 21st growth charts19,20 were applied in birth
weight: 13.9% with the Fenton & Kim 2013 growth charts16
vs 6.6% with the Intergrowth 21st growth charts19,20 in the
‘Term-weeks’ group and 13.1% with the Fenton & Kim 2013 growth charts16 vs 5.5% with the Intergrowth 21st growth
charts19,20 in the ‘Term-days’ group. Furthermore, more than
50% of newborns of ‘Term-weeks’ group [sample propor-tion 52.8%, 95% CI (p): 50.4% - 55.2%] and more than 50% of newborns of ‘Term-days’ group [sample proportion 57.8%, 95% CI (p): 49.7% – 65.5%] classified as small for gestational age according to the Fenton & Kim 2013 growth charts16 would be classified as adequate for gestational age
in the new Intergrowth 21st growth charts.19,20 There were
similar findings in other studies. In a New Zealand study, it was found that the Intergrowth 21st growth charts19,20
iden-tified fewer small for gestational age newborns than the locally used charts (4.5% vs 11.6%). However, the authors established that infants not identified by the Intergrowth 21st growth charts19,20 as small for gestational age had an
Table 4 – ‘Term-days’ group categorization as SGA, AGA and LGA according to the Intergrowth 21st growth chart an the Fenton & Kim
2013 growth chart in each category ‘Term-days’ Group
(n = 1118)
Fenton & Kim 2013
SGA, % (n) AGA, % (n) LGA, % (n)
Intergrowth 21st
SGA 42.2 (62) 0.0 (0) 0.0 (0)
AGA 57.8 (85) 90.8 (864) 0.0 (0)
LGA 0.0 (0) 9.2 (88) 100.0 (19)
Total, % (n) 100.0 (147) 100.0 (952) 100.0 (19)
SGA: small for gestational age; AGA: adequate for gestational age; LGA: large for gestational age
Table 5 – ‘Preterm-weeks’ group categorization as SGA, AGA and LGA according to the Intergrowth 21st growth chart and the Fenton &
Kim 2013 growth chart in each category ‘Preterm-weeks’ Group
(n = 617)
Fenton & Kim 2013
SGA, % (n) AGA, % (n) LGA, % (n)
Intergrowth 21st
SGA 62.3 (33) 0.0 (0) 0.0 (0)
AGA 37.7 (20) 94.1 (496) 0.0 (0)
LGA 0.0 (0) 5.9 (31) 100.0 (37)
Total, % (n) 100.0 (53) 100.0 (527) 100.0 (37)
SGA: small for gestational age; AGA: adequate for gestational age; LGA: large for gestational age
Table 6 – ‘Preterm-days’ group categorization as SGA, AGA and LGA according to the Intergrowth 21st growth chart and the Fenton & Kim
2013 growth chart in each category ‘Preterm-days’ Group
(n = 240)
Fenton & Kim 2013
SGA, % (n) AGA, % (n) LGA, % (n)
Intergrowth 21st
SGA 90.7 (49) 7.9 (14) 0.0 (0)
AGA 9.3 (5) 91.5 (162) 22.2 (2)
LGA 0.0 (0) 0.6 (1) 77.8 (7)
Total, % (n) 100.0 (54) 100.0 (177) 100.0 (9)
ARTIGO ORIGINAL increased risk of adverse neonatal outcomes.
23 Another
study that included 1.25 million term pregnancies yielded identical results, with 10.5% of newborns being classified as small for gestational age according to a standard growth chart, while with the Intergrowth 21st growth charts19,20 only
4.4% were identified. However, in the same study it was found that the differences appeared to be related to physi-ological differences between different populations (such as maternal height).24
Results were different in preterm newborns (‘Preterm-weeks’ and ‘Preterm-days’ groups). In the ‘Preterm-(‘Preterm-weeks’ group there was also a reduction in the amount of small for gestational age newborns when the Intergrowth 21st growth
charts19,20 were applied: 8.6% with the Fenton & Kim 2013
growth charts16 vs 5.3% with the Intergrowth 21st growth
charts.19,20 Moreover, an important percentage of preterm
newborns [sample proportion 37.7%, 95% CI (p): 25.9% – 51.2%] classified as small for gestational age according to the Fenton & Kim 2013 growth charts16 would be classified
as adequate for gestational age with the new Intergrowth 21st growth charts.19,20 However, in the ‘Preterm-days’
group the amount of small for gestational age newborns is higher when the Intergrowth 21st growth charts19,20 were
used, unlike what happened in previous groups: 22.5% with the Fenton & Kim 2013 growth charts16 vs 26.3% with the
Intergrowth 21st growth charts.19,20 In this group, it was also
found that a small number of newborns classified as ade-quate and large for gestational age according to the Fenton & Kim 2013 growth charts16 would be classified as small and
adequate for gestational age, respectively, according to the Intergrowth 21st growth charts.19,20 This may be related with
gestational age itself, as these newborns all have a ges-tational age below 33 weeks. Furthermore, the ‘Preterm-days’ group had a median gestational age lower than the ‘Preterm-weeks’ group (30 weeks + 3 days vs 35 weeks). A study comparing the use of the Fenton & Kim 2013 growth charts16 with the Intergrowth 21st growth charts19,20 in
pre-term newborns also found similar results: a higher amount of small for gestational age newborns using the latest charts (15% vs 12%).17 Thus, it may be suggested that in
very preterm infants, the Intergrowth 21st growth charts19,20
may increase the number of those classified as small for gestational age in comparison with the Fenton & Kim 2013 growth charts.16
Our study showed that it would be beneficial for Portuguese newborns to use the Intergrowth 21st growth
charts.19,20 The consequences of being small for gestational
age are well known. The increased risk of hypoglycemia, polycythemia and hypothermia, for instance, leads to spe-cific interventions and investigations in order to prevent these situations. Other frequent situation in these newborns is dietary supplementation, with increased risk of obesity and metabolic syndrome in future.12,13,24
By replacing the Fenton & Kim growth charts16 with the
Intergrowth 21st growth charts,19,20 there would be fewer
newborns classified as small for gestational age, with fewer unnecessary or potentially harmful interventions (glucose
monitoring or dietary supplementation, for example). It would be important to carry out a prospective study to con-firm these findings.
This study has some limitations. Although a large sample was analyzed (more than 14 000 newborns), this is a retro-spective study, using previously existing data, not collected for the purpose of the study. Furthermore, data was from a specific hospital in Lisbon. So, this sample is not represent-ative of the Portuguese population. Furthermore, the inclu-sion and excluinclu-sion criteria were different from those used in the Intergrowth 21st project18,19: data such as maternal
height, maternal body mass index, socioeconomic situation, previous gynecological history, number of previous abor-tions and obstetric history were not considered. Therefore, we propose a multicentre national prospective study using the same criteria as the Intergrowth 21st project,18,19 in order
to make a more reliable comparison of charts, including the evaluation of length and head circumference.
CONCLUSION
The use of the Intergrowth 21st growth charts19,20 in this
study, instead of the Fenton & Kim 2013 growth charts,16
resulted in a lower number of newborns being classified as small for gestational age. However, in very premature new-borns the opposite was found, with more newnew-borns classi-fied as small for gestational age with the Intergrowth 21st
growth charts19,20 than with the Fenton & Kim 2013 growth
charts.16 The use of more suitable growth charts in birth
weight evaluation would lead to more appropriate attitudes towards each newborn, which could influence their neonatal approach and eventual risk of chronic disease as adults. Considering the methodology of the Intergrowth 21st
pro-ject and the results obtained in this study, we suggest that Portuguese maternity hospitals use the Intergrowth 21st
instead of the Fenton & Kim 2013 growth charts. However, more studies are needed to complement these results.
ACKNOWLEDGEMENTS
The authors acknowledge the assistance of Máximo Marques for his help and support with computer issues and Daniela Grendele for her help as a native speaker.
PROTECTION OF HUMANS AND ANIMALS
The authors declare that the procedures were fol-lowed according to the regulations established by the Clinical Research and Ethics Committee and to the Helsinki Declaration of the World Medical Association.
DATA CONFIDENTIALITY
The authors declare having followed the protocols in use at their working center regarding patients’ data publication.
CONFLICT OF INTEREST
The authors declare that they have no conflict of interest.
FUNDING SOURCES
ARTIGO ORIGINAL
REFERENCES
1. Law CM. Significance of birth weight for the future. Arch Dis Child Fetal Neonatal. 2002;86:F7–F8.
2. Philip AG. Historical perspectives: classification by birthweight and gestational age. Neoreviews 2003;4:e91–3.
3. Xu H, Simonet F, Luo ZC. Optimal birth weight percentile cut-offs in defining small- or large-for-gestational-age. Acta Paediatr. 2010;99:550– 5.
4. Graz MB, Tolsa JF, Fumeaux CJ. Being small for gestational age: does it matter for the neurodevelopment of premature infants? A cohort study. PLoS One. 2015;10:e0125769.
5. Nobile S, Marchionni P, Carnielli VP. Neonatal outcome of small for gestational age preterm infants. Eur J Pediatr. 2017;176:1083–8. 6. McIntire DD, Bloom SL, Casey BM, Leveno KJ. Birth weight in relation
to morbidity and mortality among newborn infants. N Engl J Med. 1999;340:1234–8.
7. Iughetti L, Lucaccioni L, Ferrari F. Challenges in the development and growth of small for gestational age newborns. Expert Rev Endocrinol Metab. 2017;12:253–60.
8. Lawrence EJ. A matter of size: Part 2. Evaluating the large-for-gestational-age neonate. Adv Neonatal Care. 2007;7:187–97. 9. Brito S, Brett A, Agro J. Recém-nascidos grandes para a idade
gestacional: o conceito e a realidade. Acta Pediatr Port. 2014;45:7–15. 10. Rodrigues FP, Martinelli S, Bittar RE, Francisco RP, Zugaib M.
Comparação entre duas curvas de crescimento para o diagnóstico de recém-nascidos pequenos para a idade gestacional. Rev Bras Ginecol Obstet. 2015;37:59–63.
11. Chiavaroli V, Cutfield WS, Derraik JG, Pan Z, Ngo S, Sheppard A, et al. Infants born large-for-gestational age display slower growth in early infancy, but no epigenetic changes at birth. Sci Rep. 2015;30:14540. 12. Vaag A. Low birth weight and early weight gain in the metabolic
syndrome: consequences for infant nutrition. Int J Gynaecol Obstet. 2009;104:S32–4.
13. Ojha S, Saroha V, Symonds ME, Budge H. Excess nutrient supply in early life and its later metabolic consequences. Clin Exp Pharmacol Physiol. 2013;40:817–23.
14. Secção de Neonatologia da Sociedade Portuguesa de Pediatria.
Recomendação de curvas de crescimento para crianças nascidas pré-termo. Acta Pediatr Port. 2013;44:94–9.
15. Papageorghiou AT, Kennedy SH, Salomon LJ, Altman DG, Ohuma EO, Stones W, et al. The INTERGROWTH-21st fetal growth standards: toward the global integration of pregnancy and pediatric care. Am J Obstet Gynecol. 2018;218:S630–40.
16. Fenton TR, Kim JH. A systematic review and meta-analysis to revise the Fenton growth chart for preterm infants. BMC Pediatr. 2013;13:59. 17. Tuzun F, Yucesoy E, Baysal B, Kumral A, Duman N, Ozkan H.
Comparison of INTERGROWTH-21 and Fenton growth standards to assess size at birth and extrauterine growth in very preterm infants. J Matern Fetal Neonatal Med. 2017;30:1–6.
18. Villar J, Altman DG, Purwar M, Noble JA, Knight HE, Ruyan P, et al. The objectives, design and implementation of the INTERGROWTH-21st Project. BJOG. 2013;120:9–26.
19. Villar J, Ismail LC, Victora CG, Ohuma EO, Bertino E, Altman DG, et al. International standards for newborn weight, length, and head circumference by gestational age and sex: the Newborn Cross-Sectional Study of the INTERGROWTH-21st Project. Lancet. 2014;384:857–68. 20. Villar J, Giuliani F, Fenton TR, Ohuma EO, Ismail LC, Kennedy SH.
INTERGROWTH-21st Consortium. INTERGROWTH-21st very preterm size at birth reference charts. Lancet. 2016;387:844–5.
21. Villar J, Papageorghiou AT, Pang R, Ohuma EO, Ismail LC, Barros FC, et al. The likeness of fetal growth and newborn size across non-isolated populations in the INTERGROWTH-21st Project: the Fetal Growth Longitudinal Study and Newborn Cross-Sectional Study. Lancet Diabetes Endocrinol. 2014;2:781–92.
22. Saugstad OD. New growth charts for newborn babies. Lancet. 2014;384:833–5.
23. Anderson NH, Sadler LC, McKinlay CJ, McCowan LM. INTERGROWTH-21st vs customized birthweight standards for identification of perinatal mortality and morbidity. Am J Obstet Gynecol. 2016;214:509.e1–7. 24. Francis A, Hugh O, Gardosi J. Customized vs INTERGROWTH-21st
standards for the assessment of birthweight and stillbirth risk at term. Am J Obstet Gynecol. 2018;218:S692–9.