https://doi.org/10.1590/0004-282X20170058
ARTICLE
Revisiting head circumference of Brazilian
newborns in public and private maternity hospitals
Revisitando o perímetro craniano de recém nascidos brasileiros de maternidades
públicas e privadas
Maria do Socorro Teixeira Amorim1, Aurea Nogueira de Melo1
In newborns, measurements of head circumference (HC) provide an indirect method of estimating head growth
dur-ing the intrauterine and neonatal periods and durdur-ing the irst years of life. Head size relects the growth of the brain and
has been associated with body size, brain malformations, or
merely be familial factors1. Dobbing, in 19742, emphasized
that brain growth does not occur in a linear and symmetrical fashion but is, instead, characterized by periods of increased
cell growth. he human brain experiences two growth spurts.
he initial growth spurt occurs from 12 to 18 weeks of gesta
-tion and is characterized by neuronal multiplica-tion. he sec
-ond growth spurt begins at 28 weeks of gestation and extends
through birth until the third year of life. his growth is con
-sidered the major period of growth of the brain. During these
growth spurt phases, the brain is more vulnerable and
sus-ceptible to the presence of both internal and external factors
that can afect brain and body growth. Davies3 argued that
HC is more inluenced by genetic factors than by weight and
height and that it is less susceptible to maternal factors, such as diabetes, multipara, prior abortions, hypertension, malnu-trition, or placental anomalies.
Several studies have investigated HC in newborns and infants and correlated them with maternal, placental, and
fetal factors4. In fact, previous studies5 have reported
correla-tions between HC and other anthropometric measurements or gestational age (GA). Up until now, few research groups in
Brazil have studied HC or its correlation with GA and gender6.
herefore, the aim of this study was to revisit newborn HC
Universidade Federal do Rio Grande do Norte, Departamento de Pediatria, Programa de Pós-Graduação em Ciências da Saúde, Natal RN, Brasil.
Correspondence: Aurea Nogueira de Melo; Rua Paulo Lyra, 2183 / Ap. 301; 59064-550 Natal RN, Brasil; E-mail: [email protected]
Conflict of interest: There is no conlict of interest to declare.
Received 29 June 2016; Received in inal form 08 November 2016; Accepted 14 March 2017.
ABSTRACT
Objective: To revisit the head circumference (HC) of newborns in public and private maternity hospitals; to correlate our indings with the
gestational age, gender, and type of delivery; and build and validate graphs and curves. Methods: This was a prospective study performed on healthy newborns. Differences in HC were analyzed as a function of gestational age, gender, the healthcare system and the type of delivery. Smoothed percentile curves were created using the least mean squares method. Results: Of the included newborns, 697 were born in private maternity hospitals and 2,150 were born in public maternity hospitals. In all, 839 were born by vaginal delivery, and 1,311 were born by cesarean delivery. At 37 to 42 weeks of gestation, male newborns had a larger HC than females. Infants born in private maternity and those born by cesarean delivery had a larger HC. Conclusion: An important result of the present study is that our analyses allowed us to generate curves and statistically-validated graphs that can be used in clinical neonatal practice.
Keywords: neonatal head circumference; gestational age; gender; public and private maternity; newborn.
RESUMO
Objetivo: Revisitar o perímetro cefálico (PC) de recém nascidos (RN) correlacionando com a idade gestacional (IG), gênero, tipo de parto (TP), sistema de saúde e construir e validar gráicos e curvas. Métodos: Estudou-se prospectivamente RN sadios analisando-se as diferenças entre os PC segundo a IG, gênero, TP e sistema de saúde. As curvas suavizadas de percentis foram criadas pelo método LMS (least mean squares). Resultados: 692 nasceram em maternidades privadas, 2.150 em maternidade pública, 839 nasceram de parto vaginal e 1.311 parto cesáreo. O gênero masculino apresentou PC maior que o feminino nas IG de 37 a 42 semanas. Os RN de maternidades privadas tiveram PC maior que os de maternidade pública. Os nascidos de parto cesáreo tiveram PC maior que os de parto vaginal. Conclusão:
Importante consequência deste estudo foi que os resultados permitiram a criação de curvas e gráicos validados estatisticamente de aplicabilidade na prática clínica neonatal.
and to correlate it with GA, gender and the type of delivery
so that we could evaluate the data to identify any diferences
between newborns delivered in public and private maternity hospitals. Moreover, an additional purpose was to build and validate simple graphs and curves that can be used in neona-tal clinical practice.
METHODS
Study design and participants
his was a prospective neonatal and cross-sectional study that involved examinations performed on singleton live newborns born from 34 to 42 weeks of GA to mothers
at public maternity hospitals that assist poor communi-ties, and at two private hospitals that assist communities
belonging to the middle and upper social classes. hese hos
-pitals serve several cities in the Rio Grande do Norte state,
Brazil, and the study included newborns born from 2008 to 2009. he exclusion criteria were the following: infants with
malformations of the central nervous system (CNS), chro-mosomal abnormalities, or congenital infections; mothers with hypertensive disorders of pregnancy, diabetes or
ges-tational diabetes, a history of smoking, or multiple preg -nancies; forceps deliveries; undetermined or questionable GA; and mothers who did not agree to participate in the
study. Outlier values were deined as measurements that
were above or below the mean plus four standard
devia-tions (SD), and were excluded from the study.
Procedures
To identify signiicant diferences according to GA,
we divided the groups according to the health care system used (public and private), gender (male and female), and
the type of delivery (vaginal and cesarean). he following socio-demographic variables of the mothers were analyzed:
GA, race, education, marital status, family income, number of prenatal visits, and type of delivery (protocol developed
by the authors). he mothers were interviewed daily, and the
data were analyzed using Microsoft Excel 2007. Head circum
-ference was measured by a pediatric neonatologist (MSTA)
and a child neurologist (ANM) within the irst 48 hours after
birth, while in shared rooms of maternity hospitals, under adequate conditions of light and temperature, in newborns without edema or cephalohematoma. Head
circumfer-ence was obtained using an inextensible plastic measuring tape that was placed around the external occipital protu -berance at the level of the eyebrows and anterior glabella. Measurements were recorded in cm to two decimal places.
he GA was deined as the number of completed weeks from
the last menstrual period7. his result was compared with
the methods described by Capurro et al.8 he newborns
were selected by a neonatologist when a postnatal
clini-cal examination did not exhibit any alterations. he project
was approved by the Research Committee of the Graduate Program in Health Sciences at the Universidade Federal do Rio Grande do Norte. All of the parents or guardians of the newborns who were assessed in the present study signed an informed consent form.
Statistical analysis
Data analyses were performed using the SPSS 17.0 and
R 2.11.1. statistical software programs9. he Student’s t test
for independent variables was used to identify correlations between mean HC and other factors, including GA, gender, the health system, and the type of delivery. To evaluate the
inluence of GA, gender, the type of delivery, and the type
of health care system on HC, analysis of variance was
per-formed with Tukey’s post hoc test. Curves for HC were built
for the 10th, 25th, 50th, 75th, 90th, and 95th percentiles of GA and
stratiied by gender, the health care system, and the type
of delivery using the least mean squares (LMS) method10.
his method assumes that the Box-Cox transformation can
be used to convert independent data with positive values
into normally-distributed data. he L, M, and S parame
-ters were calculated for each age group and then smoothed
using a cubic spline function11. he M parameter expressed
the median HC for each GA group, the S parameter
repre-sented the coeicient of variation for each GA group, and the L parameter and Box-Cox coeicient were employed
to mathematically transform the HC measurements into
normally distributed data for each GA group. he coei
-cient L corresponded to a value that minimized the sum of the squared deviations of each variable. Using these three parameters, it was possible to construct curves for any
desired percentile with the formula: C100a(t) = M(t)[1+L(t)S(t)
Za]1/L(t), where Z
a was the SD that corresponded to the area
“a,” C100a(t) was the percentile that corresponded to Za, t was
the GA, and L(t), M(t), S(t), and C100a(t) indicated the
corre-sponding values for each curve at age t. he LMS method was incorporated into the LMS Chart Maker Pro software
version 2.312.To evaluate the quality of the it, Z scores were
calculated for each GA using the following formula: Z score
= [(HC/M)•L-1]/(LS). Because the curves were based on a
normal distribution of Z scores, the mean and SDs were
cal-culated for each GA and were expected to be 0.0 ± 1.0. he
analysis of the calculated Z score distributions was used to
determine whether the curves adequately it the data. To
validate the curves, the Z scores, SDs, and conidence inter
-vals (CIs) for each GA were calculated from diferent sam
-ples at random using the LMS parameters obtained for the curves for each GA. Mean and CI values were compared to zero, and the SDs were compared to one (using an alpha
of 0.05 for the nine comparisons within each interval). he
curves were then evaluated by analyzing the percentage of
children who fell within the expected intervals. By deini
-tion, approximately 10% of a population is below the 10th
and 10% is above the 90th percentile. he curves that were
newly-created for HC were validated using distinct samples for all combined GAs, genders, and types of health care sys-tem, and mean and CI values were calculated for each GA.
RESULTS
he reference population consisted of 4,560 singleton live births. he following groups were excluded from the study: women who did not agree to the study (434/9.51%); women who underwent a forceps delivery (43/0.94%); preterm infants in the ICU (180/3.94%); neonates with CNS malformations (18/0.39%), congenital anomalies (22/0.48%), congenital infections (80/1.75%) or uncertain or
undetermined GA (606/13.28%); newborns born to moth
-ers with hypertensive disord-ers of pregnancy (200/4.38%),
diabetes or gestational diabetes (100/2.19%) or multi
-ple pregnancies (30/0.65%). he study population com
-prised 2,847 newborns, of whom 1,495 (52.51%) were male and 1,352 (47.49%) were female. With regard to the health
care system used, 697 infants were born in private
hos-pitals, of which 344 (49.35%) were male and 353 (50.65%) were female; 555 (79.62%) were born in the state capital, and 142 (20.38%) came from other cities; and 686 (99.76%) were Caucasian and 11 (1.59%) were Black. In relation to maternal education, 316 (45.33%) mothers had a high school education, 332 (52.36%) had a college education, and 49 (7.03%) had only a basic education. With respect
to the type of delivery, 626 (89.81%) were cesarean deliver
-ies, and 71 (10.19%) were vaginal deliveries. Similarly, 2,150
infants were born in public maternity facilities. Of these,
1,151 (53.53%) were male and 999 (46.46%) were female, 1,369 (63.67%) were born in the capital, and 781 (36.32%) came from other cities. With regard to race, 1,973 (91.76%) were Caucasian and 177 (8.23%) were Black. With respect to maternal education, 1,273 (59.20%) had an elementary
education, 70 (3.25%) had a college education, 732 (34.05%) had a high school education, and 75 (3.48%) were illiterate. With respect to the type of delivery, 1,311 (60.98%) were born by cesarean and 839 (39.02%) were vaginal deliveries. In the overall analysis, the Student’s t tests showed that,
according to the type of health care system used, the mean
HC was 34.49 ± 1.72 cm for infants born in public materni
-ties and 34.90 ± 1.34 cm for infants born in private hospitals and this diference was signiicant (p < 0.001). With respect to gender, the mean HC was 34.24 ± 1.45 cm in females and 34.91 ± 1.75 cm in males, and this diference was signiicant (p < 0.001). When the mean HC was analyzed according to the type of delivery, it was 34.12 ± 1.54 cm and 34.81 ± 1.65 cm
in children born by vaginal and cesarean delivery,
respec-tively, and this diference was signiicant (p < 0.001). Another
result, that was considered in the comparison between GA
and gender, was that no signiicant diferences were observed between the genders in gestational ages from 34-35 weeks.
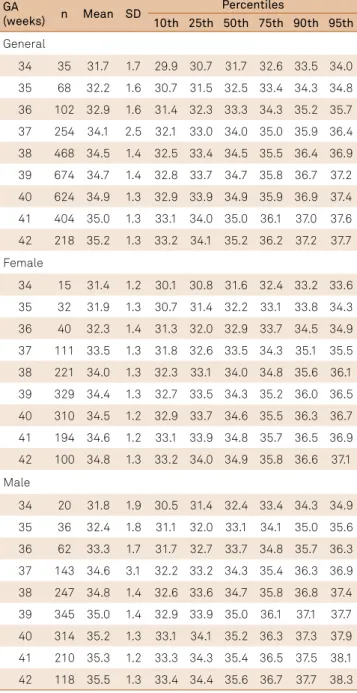
Table 1 shows comparisons across mean HC accord-ing to GA, the type of delivery, gender and the health
sys-tem. Comparisons were calculated using the Student’s t-test. In newborns born at 38 to 41 weeks of pregnancy, the mean HC was signiicantly diferent between those with a cesarean or vaginal birth (p < 0.001). In infants born at 36 to 42 weeks of gestation, the mean HC was signiicantly lower in females than in males (p < 0.001). In infants born at 38 to 40 weeks, those born in private maternity hospitals had a signiicantly
larger mean HC than those born in public maternity
hospi-tals (p < 0.001).
Tables 2–5 show the mean and SD values for these
rela-tionships as well as the 10th through 95th percentiles for the
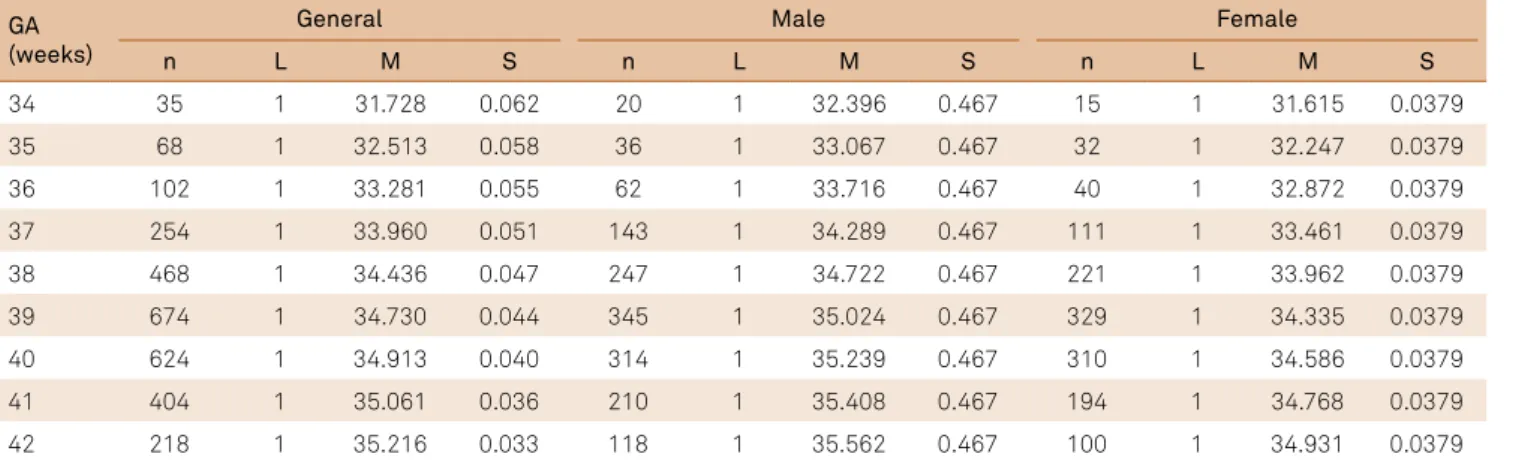
HC curves that were created according to GA for all new-borns of both genders, who were born in both healthcare systems (private and public) and who were born by either type of delivery. Table 6 presents the estimates of the LMS values that were calculated according to GA for the general curve and gender.
Table 1. Comparisons of mean head circumference by GA, according health system, gender and type of delivery using the Student’s t-test.
GA (weeks)
Cesarean Vaginal
p-value Female Male p-value Private Public p-value
n Mean SD n Mean SD n Mean SD n Mean SD n Mean SD n Mean SD
34 16 31.3 1.9 19 32.0 1.3 0.159 15 31.4 1.2 20 31.8 1.9 0.509 4 32.0 0.8 31 31.6 1.8 0.695
35 33 32.6 1.5 35 31.9 1.6 0.074 32 31.9 1.3 36 32.4 1.8 0.167 12 32.9 1.4 56 32.1 1.6 0.088 36 52 32.9 1.7 50 33.0 1.5 0.858 40 32.3 1.4 62 33.3 1.7 0.003 27 33.7 1.7 75 32.7 1.5 0.004* 37 161 34.4 3.0 93 33.7 1.2 0.040* 111 33.5 1.3 143 34.6 3.1 0.001* 76 34.5 1.2 178 33.9 2.9 0.145
38 323 34.7 1.3 145 33.9 1.3 0.001* 221 34.0 1.3 247 34.8 1.4 0.001* 172 34.7 1.2 296 34.3 1.4 0.001* 39 505 34.9 1.4 169 34.3 1.4 0.001* 329 34.4 1.3 345 35.0 1.4 0.001* 230 35.2 1.2 444 34.5 1.4 0.001* 40 422 35.1 1.3 202 34.5 1.3 0.001* 310 34.5 1.2 314 35.2 1.3 0.001* 115 35.3 1.2 509 34.8 1.4 0.001* 41 281 35.2 1.2 123 34.6 1.4 0.001* 194 34.6 1.2 210 35.3 1.2 0.001* 46 35.0 1.2 358 35.0 1.3 0.943
42 140 35.3 1.3 78 35.1 1.3 0.336 100 34.8 1.3 118 35.5 1.3 0.001* 15.0 35.5 1.3 203 35.2 1.3 0.385
DISCUSSION
his analysis of neonatal HC enabled us to create a set of
curves of fetal intrauterine growth that are based solely on HC as a function of GA, considering that HC is essential during
rou-tine examination of newborns, and relects fetal and postnatal
brain growth. Anthropometry undoubtedly remains a simple,
universal, noninvasive, and inexpensive method to assess brain
growth. Measuring HC during the neonatal period is the most sensitive method available to assess brain growth from birth,
especially in the irst year of life, because it relects, to some extent, intrauterine CNS development. his makes it the most
important parameter to monitor neurodevelopment after
birth13,14. We performed a prospective neonatal cross-sectional
study that allowed us to obtain an accurate assessment of GA and HC. Despite its limitations, this is one of the most widely-accepted methods used to create growth curves that are aimed
at determining HC at birth and post-birth15. We studied the fol
-lowing two distinct population groups: families of lower socio -economic status who were assisted by the public health care system in the Maternity Hospital of the Universidade Federal do Rio Grande do Norte, which is a reference hospital in Natal, Brazil, and families of higher socioeconomic status who were served by the private health care system. It was, therefore,
pos-sible to determine diferences in HC at birth that were based on the distinct social class into which the infant was born. he exclusion criteria allowed us to obtain a sample of singleton,
healthy newborns and to create standard growth curves that
Table 3. Head circumference percentiles by the GA of Brazilian newborns in relation to the general sample of the private health system and gender.
GA
(weeks) n Mean SD
Percentiles
10th 25th 50th 75th 90th 95th
General
34 4 32.0 0.8 30.8 31.5 32.3 33.1 33.8 34.2 35 12 32.9 1.4 31.5 32.3 33.1 33.9 34.6 35.0 36 27 33.7 1.7 32.2 33.0 33.8 34.6 35.3 35.8 37 76 34.5 1.2 32.8 33.5 34.4 35.2 35.9 36.4
38 172 34.7 1.2 33.2 34.0 34.8 35.6 36.4 36.9 39 230 35.2 1.2 33.5 34.3 35.1 36.0 36.7 37.2 40 115 35.3 1.2 33.7 34.4 35.3 36.1 36.9 37.4 41 46 35.0 1.2 33.7 34.4 35.3 36.2 36.9 37.4
42 15 35.5 1.3 33.7 34.5 35.3 36.2 37.0 37.4 Female
34 2 32.0 1.4 31.0 31.7 32.4 33.2 33.8 34.2 35 6 33.5 0.6 31.5 32.2 32.9 33.6 34.3 34.7
36 14 33.0 1.3 31.9 32.6 33.3 34.1 34.8 35.2 37 31 33.9 1.0 32.4 33.1 33.8 34.6 35.3 35.7 38 81 34.3 1.2 32.9 33.6 34.3 35.1 35.8 36.2
39 119 34.8 1.2 33.3 34.0 34.8 35.5 36.2 36.7 40 67 35.1 1.2 33.5 34.2 35.0 35.8 36.5 36.9 41 25 34.8 1.1 33.5 34.2 35.0 35.8 36.5 36.9 42 8 34.9 1.1 33.4 34.2 35.0 35.7 36.5 36.9
Male
34 2 32.0 0.0 31.3 32.0 32.8 33.5 34.2 34.6 35 6 32.3 1.8 32.0 32.7 33.5 34.3 35.0 35.4 36 13 34.5 1.9 32.7 33.4 34.2 35.0 35.7 36.1
37 45 34.9 1.2 33.2 33.9 34.7 35.6 36.3 36.7 38 91 35.1 1.2 33.6 34.4 35.2 36.0 36.7 37.2 39 111 35.6 1.2 33.9 34.7 35.5 36.3 37.1 37.5 40 48 35.7 1.1 34.1 34.9 35.7 36.5 37.3 37.7
41 21 35.4 1.3 34.2 35.0 35.8 36.7 37.4 37.9 42 7 36.2 1.2 34.4 35.1 35.9 36.8 37.5 38.0
GA: gestational age.
Table 2. Head circumference percentiles by GA of newborns in relation to the general sample and gender.
GA
(weeks) n Mean SD
Percentiles
10th 25th 50th 75th 90th 95th
General
34 35 31.7 1.7 29.9 30.7 31.7 32.6 33.5 34.0
35 68 32.2 1.6 30.7 31.5 32.5 33.4 34.3 34.8 36 102 32.9 1.6 31.4 32.3 33.3 34.3 35.2 35.7
37 254 34.1 2.5 32.1 33.0 34.0 35.0 35.9 36.4
38 468 34.5 1.4 32.5 33.4 34.5 35.5 36.4 36.9
39 674 34.7 1.4 32.8 33.7 34.7 35.8 36.7 37.2
40 624 34.9 1.3 32.9 33.9 34.9 35.9 36.9 37.4 41 404 35.0 1.3 33.1 34.0 35.0 36.1 37.0 37.6
42 218 35.2 1.3 33.2 34.1 35.2 36.2 37.2 37.7
Female
34 15 31.4 1.2 30.1 30.8 31.6 32.4 33.2 33.6
35 32 31.9 1.3 30.7 31.4 32.2 33.1 33.8 34.3
36 40 32.3 1.4 31.3 32.0 32.9 33.7 34.5 34.9 37 111 33.5 1.3 31.8 32.6 33.5 34.3 35.1 35.5
38 221 34.0 1.3 32.3 33.1 34.0 34.8 35.6 36.1
39 329 34.4 1.3 32.7 33.5 34.3 35.2 36.0 36.5
40 310 34.5 1.2 32.9 33.7 34.6 35.5 36.3 36.7
41 194 34.6 1.2 33.1 33.9 34.8 35.7 36.5 36.9 42 100 34.8 1.3 33.2 34.0 34.9 35.8 36.6 37.1
Male
34 20 31.8 1.9 30.5 31.4 32.4 33.4 34.3 34.9
35 36 32.4 1.8 31.1 32.0 33.1 34.1 35.0 35.6
36 62 33.3 1.7 31.7 32.7 33.7 34.8 35.7 36.3
37 143 34.6 3.1 32.2 33.2 34.3 35.4 36.3 36.9
38 247 34.8 1.4 32.6 33.6 34.7 35.8 36.8 37.4 39 345 35.0 1.4 32.9 33.9 35.0 36.1 37.1 37.7
40 314 35.2 1.3 33.1 34.1 35.2 36.3 37.3 37.9
41 210 35.3 1.2 33.3 34.3 35.4 36.5 37.5 38.1
42 118 35.5 1.3 33.4 34.4 35.6 36.7 37.7 38.3
represented an estimate of optimal intrauterine growth. here
is no doubt that constructing intrauterine growth curves for a
particular population can reveal proper proiles and that this
method can allow us to avoid potential errors that arise from classifying newborns based on curves that are not appropriate
for evaluating a particular population group16.
Revisiting the HC of newborns, our results corroborate
previous indings regarding mean HC15,17,18,19,20. By analyzing the two sample groups in this study, we observed that the
Table 4. Head circumference percentiles of newborns in relation to the general sample of the public health system and gender.
GA
(weeks) n Mean SD
Percentiles
10th 25th 50th 75th 90th 95th
General
34 31 31.6 1.8 30.0 30.9 31.9 32.9 33.8 34.3
35 56 32.1 1.6 30.6 31.5 32.5 33.5 34.4 35.0
36 75 32.7 1.5 31.2 32.1 33.2 34.2 35.1 35.7
37 178 33.9 2.9 31.7 32.7 33.7 34.8 35.7 36.3 38 296 34.3 1.4 32.2 33.1 34.2 35.2 36.2 36.8
39 444 34.5 1.4 32.5 33.5 34.5 35.6 36.6 37.1
40 509 34.8 1.4 32.8 33.7 34.8 35.9 36.8 37.4 41 358 35.0 1.3 33.0 33.9 35.0 36.1 37.1 37.7
42 203 35.2 1.3 33.2 34.2 35.2 36.3 37.3 37.9
Female
34 13 31.4 1.3 29.8 30.5 31.4 32.2 32.9 33.3 35 26 31.6 1.2 30.4 31.2 32.0 32.8 33.6 34.0
36 26 32.0 1.4 31.0 31.8 32.6 33.5 34.3 34.7
37 80 33.4 1.4 31.6 32.4 33.3 34.1 34.9 35.4
38 140 34.0 1.3 32.1 32.9 33.8 34.7 35.4 35.9 39 210 34.3 1.4 32.5 33.3 34.2 35.1 35.9 36.3
40 243 34.4 1.2 32.8 33.6 34.5 35.4 36.2 36.6
41 169 346 1.3 33.0 33.8 34.7 35.6 36.4 36.9
42 92 34.8 1.26 33.2 34.0 34.9 35.8 36.6 37.1
Male
34 18 31.8 2.0 30.2 31.2 32.3 33.3 34.3 34.9
35 30 32.5 1.8 30.8 31.8 32.9 34.0 35.0 35.6 36 49 33.0 1.5 31.4 32.4 33.5 34.6 35.7 36.2
37 98 34.5 3.6 31.9 33.0 34.1 35.2 36.2 36.9
38 156 34.6 1.4 32.3 33.4 34.5 35.7 36.7 37.3
39 234 34.8 1.4 32.6 33.7 34.8 36.0 37.0 37.7 40 266 35.2 1.4 32.9 33.9 35.1 36.3 37.3 38.0
41 189 35.4 1.2 33.1 34.2 35.3 36.5 37.6 38.2
42 111 35.5 1.3 33.3 34.4 35.5 36.7 37.8 38.4
Table 5. Head circumference percentiles by gestational age of newborns in relation to the general sample according to type of delivery.
GA
(weeks) n Mean SD
Percentiles
10th 25th 50th 75th 90th 95th
Cesarean
34 16 31.3 1.9 30.4 31.3 32.3 33.2 34.1 34.6
35 33 32.6 1.5 31.0 31.9 32.9 33.9 34.8 35.4
36 52 32.9 1.7 31.7 32.6 33.6 34.6 35.5 36.1
37 161 34.4 3.0 32.2 33.1 34.2 35.2 36.1 36.7
38 323 34.7 1.3 32.6 33.6 34.6 35.6 36.6 37.1
39 505 34.9 1.4 32.9 33.8 34.9 35.9 36.9 37.5
40 422 35.1 1.3 33.1 34.0 35.1 36.2 37.1 37.7
41 281 35.2 1.2 33.2 34.2 35.2 36.3 37.3 37.8
42 140 35.3 1.3 33.3 34.3 35.4 36.4 37.4 38.0
Vaginal
34 19 32.0 1.3 30.3 31.1 31.9 32.8 33.6 34.1
35 35 31.9 1.6 30.8 31.6 32.5 33.4 34.1 34.6
36 50 33.0 1.5 31.3 32.1 33.0 33.9 34.7 35.2
37 93 33.7 1.2 31.8 32.6 33.5 34.4 35.2 35.7
38 145 33.9 1.3 32.1 33.0 33.9 34.8 35.6 36.1
39 169 34.3 1.4 32.5 33.3 34.2 35.2 36.0 36.5
40 202 34.5 1.3 32.7 33.6 34.5 35.4 36.3 36.8
41 123 34.6 1.4 33.0 33.8 34.8 35.7 36.6 37.1
42 78 35.1 1.3 33.2 34.1 35.0 36.0 36.8 37.4
Table 6. Estimates of LMS values by GA for the general curve and gender.
GA (weeks)
General Male Female
n L M S n L M S n L M S
34 35 1 31.728 0.062 20 1 32.396 0.467 15 1 31.615 0.0379
35 68 1 32.513 0.058 36 1 33.067 0.467 32 1 32.247 0.0379
36 102 1 33.281 0.055 62 1 33.716 0.467 40 1 32.872 0.0379
37 254 1 33.960 0.051 143 1 34.289 0.467 111 1 33.461 0.0379
38 468 1 34.436 0.047 247 1 34.722 0.467 221 1 33.962 0.0379
39 674 1 34.730 0.044 345 1 35.024 0.467 329 1 34.335 0.0379
40 624 1 34.913 0.040 314 1 35.239 0.467 310 1 34.586 0.0379
41 404 1 35.061 0.036 210 1 35.408 0.467 194 1 34.768 0.0379
42 218 1 35.216 0.033 118 1 35.562 0.467 100 1 34.931 0.0379
mean HC of children born in private maternity hospitals was higher across all of the parameters studied in relation
to those born in public maternity hospitals. hese data are
consistent with a study by Hackman et al.21,in which
socio-economic status determined not only the social class and
strongly inluenced the experiences of pregnant women, but which may have afected the future of their newborns
through adulthood. hese authors argue that lower socio
-economic status during the prenatal period is correlated with premature births and a compromised mental state
and academic performance in the future. he lower socio
-economic conditions and lower level of education of the pregnant women who were assisted at the public mater-nity hospitals meant that they had reduced access to infor-mation. Both of these factors could mean that the mother
was not aware of the importance of prenatal care or of fac-tors that could impair intrauterine brain growth, and this
lack of knowledge could result in a reduction in HC at birth. he present study corroborated the observation that
mothers who were assisted in the public health care
sys-tem were more likely to have inadequate nutrition and to live in stressful environments. hese factors may explain, to some extent, the larger HC observed in infants born to
mothers with higher socioeconomic status.he HCs of
males were observed to be larger than those of females in both preterm and term infants, and these results in male newborns were similar to the results reported in
previ-ous studies10,11,12,13,14,15,16,17,18,19,20,21,22,23,24. Whitehouse et al.25
measured free testosterone levels in the umbilical cord blood and demonstrated that these levels were inversely
Figure 1. Intrauterine growth curves of head circumference by gestational age, in relation to the general sample (A), males (B) and females (C).
34 35 36 37 38 39 40 41 42
Gestational Age, weeks
Centimeters 38.0 36.0 33.0 31.0 30.0 39.0 37.0 35.0 32.0 34.0
34 35 36 37 38 39 40 41 42
Gestational Age, weeks
Centimeters 38.0 36.0 33.0 31.0 30.0 39.0 37.0 35.0 32.0 34.0
34 35 36 37 38 39 40 41 42
Gestational Age, weeks
Centimeters 38.0 36.0 33.0 31.0 30.0 39.0 37.0 35.0 32.0 34.0 90th 50th 95th 75th 25th 10th 90th 50th 95th 75th 25th 10th 90th 50th 95th 75th 25th 10th
A
B
C
Figure 2. Intrauterine growth curves of head circumference by gestational age according to the private health system: general (A), males (B), and females (C).
34 35 36 37 38 39 40 41 42
Gestational Age, weeks
Centimeters 38.0 36.0 33.0 31.0 30.0 39.0 37.0 35.0 32.0 34.0
34 35 36 37 38 39 40 41 42
Gestational Age, weeks
Centimeters 38.0 36.0 33.0 31.0 30.0 39.0 37.0 35.0 32.0 34.0
34 35 36 37 38 39 40 41 42
Gestational Age, weeks
correlated with HC growth in female infants during brain
growth in utero and with brain development during infancy.
Gur et al.26 argued that increased intracranial volume is
associated with a proportional increase in gray and white matter in male infants, whereas increased white matter is
observed at a lower rate in females. Lombardo et al.27
con-cluded that fetal testosterone levels could inluence speciic brain regions that later developed into sexually dimorphic
gray matter. In addition, the mean HCs observed in this
study in males and females in the 10th, 25th, 50th, 75th, and
90th percentiles in infants born at 34 to 41 weeks of gesta
-tion were similar to the values obtained by Olsen et al.15.
We observed that HC was larger in infants born via cesar
-ean deliveries that were performed in public and private
hospitals at 38 to 41 weeks of gestation. To the best of our
knowledge, this diference has not been previously reported
in the literature. One explanation is that HC may temporar
-ily be reduced during vaginal deliveries for anatomical rea-sons such as the passage of the newborn through the birth
canal or because of fetal presentation his observation partly explains the fact that women prefer this type of delivery
because it is less painful.
Cesarean deliveries have increased in Natal, Brazil in par-allel with improved socioeconomic conditions and increased
education among pregnant women. his higher demand for cesareans is likely based on the belief that the quality of
obstetric care is strongly associated with the technology that
is used to perform cesarean deliveries. he rate is higher than would be expected for the level of risk, but it is consistent
with worldwide trends28.
he sample of preterm births in this study was small
because of the selection criteria, which required preterm infants to have no clinical or neurological complications. However, it was possible to perform a statistical analysis and construct percentile curves similar to those described
in a study by Fenton29. A comparison performed using
a visual analysis of the curves for HC in preterm infants
revealed that between the ages of 34-36 weeks gestation, HC is slightly higher in males. hese curves are similar to
those described by Fenton et al.29 and in the study
per-formed by the INTERGROWTH-21st Project20. However, in
our study, we observed no signiicant diferences between genders in preterm infants born between 34–35 weeks of age. he knowledge of these data contributes to the analysis
of HC in clinical practice of preterm infants. A larger
sam-ple size would more accurately reveal the true signiicance of our observations. hese data have not previously been
reported, and we have clinically veriied these data and cor
-roborated them using statistical analyses. Ulrich30 reported
that the association between HC and gender begins
dur-ing the 30th week of gestation and that this can partially be
explained as an efect of steroid hormones on brain struc
-tures in male fetuses. However, the author of that study did not specify whether the reported correlation was
sig-niicant. In addition, in a systematic review by Fenton and
Kim29 that included a meta-analysis and growth charts for
development in preterm infants, the authors did not
dis-cuss these diferences.
As shown in Figure 2, comparisons between percentile curves that were obtained using the LMS method have, in
general, provided close approximations of the percentiles
that are expected in a normal distribution. hese results indi
-cate that these curves are well adjusted to the experimental
data and that they can, therefore, be used to adjustment of population data.
Finally, the limitations of this study include its cross-sectional study method, as pointed out at the beginning of the discussion, and the restriction of our sample
popula-tion to preterm infants. We emphasize, however, that these
Figure 3. Intrauterine growth curves of head circumference by gestational age according to the public health system: general (A), males (B), and females (C).
34 35 36 37 38 39 40 41 42
Gestational Age, weeks
Centimeters
38.0
36.0
33.0
31.0 30.0 39.0
37.0
35.0
32.0 34.0
34 35 36 37 38 39 40 41 42
Gestational Age, weeks
Centimeters
38.0
36.0
33.0
31.0 30.0 39.0
37.0
35.0
32.0 34.0
34 35 36 37 38 39 40 41 42
Gestational Age, weeks
Centimeters
38.0
36.0
33.0
31.0 30.0 39.0
37.0
35.0
32.0 34.0
90th
50th 95th
75th
25th 10th
90th
50th 95th
75th
25th 10th
90th
50th 95th
75th
25th 10th
A
B
limitations do not discredit the current indings because we
were able to create curves and graphs that were then vali-dated in statistical analyses.
Revisiting newborn HC, we observed two indings for which there were no references in the literature: a) there was no signiicant diference between males and females in the gestational ages of 34-35 weeks and b) HC was
signiicantly diferent between newborns born via cesarean
delivery when compared with vaginal delivery. hese ind
-ings raise new questions and should be used as a reference for other studies. An important consequence of the present study is that our analyses allowed us to generate curves and statistically-validated graphs that can be used in neonatal clinical practice.
34 35 36 37 38 30 40 41 42
z-score
1
0.5
0
-0.5
-1
Gestational, weeks
34 35 36 37 38 30 40 41 42
z-score
1.2
0.4
0
-0.4
-1.2
Gestational, weeks
34 35 36 37 38 30 40 41 42
z-score
1
0.5
0
-0.5
-1
Gestational, weeks
25% 30%
20%
10%
0% 15%
5%
25th 75th 10th 50th 90th 75th
above 97th
below 3rd
25% 30%
20%
10%
0% 15%
5%
25th 75th 10th 50th 90th 75th
above 97th
below 3rd
25% 30%
20%
10%
0% 15%
5%
25th 75th 10th 50th 90th 75th
above 97th
below 3rd
A1 – Confidence intervals at 99,45% for the average z-score (using α adjusted to 0.0056 and 9 comparisons) by
gestational age of head circumference to validate the new curves for all newborns (N = 2847).
A2 – Comparison of the observed and expected percentiles for the validation of the new curves for all newborns.
B1 – Confidence intervals at 99.45% for the average z-score for gestational age to validate the new curves for the private health care system.
B2 – Comparison of the expected and observed percentiles for the validation of the new curves for the private health care system.
C1 – Confidence intervals at 99.45% for the average z-score for gestational age to validate the new curves for the public health care system.
C2 – Comparison of the expected and observed percentiles for the validation of the new curves for the public health care system.
Observed
Expected Observed
Expected Observed
Expected
0.8
-0.8
References
1. García-Alix A, Sáenz-de Pipaón M, Martínez M, Salas-Hernández S, Quero J. [Ability of neonatal head circumference to predict long-term neurodevelopmental outcome]. Rev Neurol. 2004;39(6):548-54. Spanish. 2. Dobbing J. The later growth of the brain and its vulnerability.
Pediatrics. 1974;53(1):2-6.
3. Davies DP. Size at birth and growth in the irst year of life of babies who are overweight and underweight at birth. Proc Nutr Soc. 1980,39(1):25-33. https://doi.org/10.1079/PNS19800005 4. Lunde A, Melve KK, Gjessing HK, Skjaerven R, Irgens LM. Genetic
and Genetic and environmental inluences on birth weight, birth length, head circumference, and gestational age by use of population-based parent-offspring data. Am J Epidemiol. 2007;165 (7):734-41. https://doi.org/10.1093/aje/kwk107
5. Lubchenco LO, Hansman C, Boyd E. Intrauterine growth in length and head circumference as estimated from live births at gestational ages from26 to 42 weeks. Pediatrics. 1966;37(3):403-8.
6. Oliveira HA, Paixão AC, Paixão MO, Barros VCF. [Anthropometric cranial measurements of normal newborn in Sergipe - Northeast of Brazil]. Arq Neuropsiquiatr. 2007;65(3B):896-9. Portuguese. https://doi.org/10.1590/S0004-282X2007000500034
7. Engle WA. Age terminology during the perinatal period. Pediatrics. 2004;114(5):1362-4. https://doi.org/10.1542/peds.2004-1915 8. Capurro H, Konichezky S, Fonseca D, Caldeyro-Barcia R. A simpliied
method for diagnosis of gestational age in the newborn infant. J Pediatr.1978;93(1):120-2. https://doi.org/10.1016/S0022-3476(78)80621-0 9. Development Core Team. R: a language and environment for
statistical computing .R Foundation for Statistical Computing; [cited 2012 Oct 8) Available from: https://www.r-project.org/ 10. Cole TJ, Green PJ. Smoothing reference centile curves: the LMS
method and penalized likelihood. Stat Med. 1992;11(10):1305-19. https://doi.org/10.1002/sim.4780111005
11. Cole TJ, Freeman JV, Preece MA. British 1990 growth reference centiles for weight, height, body mass index, and head circumference itted by maximum penalized likelihood. Stat Med. 1998;17(4):407-29. https://doi.org/10.1002/(SICI)1097-0258(19980228)17:4<407::AID-SIM742>3.0.CO;2-L
12. Pan H, Cole TJ. LMS chart maker: a program to construct growth references using the LMS method. London: Medical Research Council; 2006.
13. Macchiaverni LML, Barros AAF. Perímetro craniano: por que medir sempre. Medicina (Ribeirão Preto). 1998;31(4):595-609. http://dx.doi.org/10.11606/issn.2176-7262.v31i4p595-609 14. Gale CR, O’Callaghan FJ, Godfrey KM, Law CM, Martyn CN. Critical
periods of brain growth and cognitive function in children. Brain. 2004;127(2):321-9. https://doi.org/10.1093/brain/awh034 15. Olsen IE, Groveman SA, Lawson ML, Clark RH, Zemel BS. New
intrauterine growth curves based on United States data. Pediatrics. 2010;125(2):214-24. https://doi.org/10.1542/peds.2009-0913 16. Fok TF, So HK, Wong E, Ng PC, Chang A, Lau J et al. Updated
gestational age speciic birth weight, crown-heel length, and head circumference of Chinese newborns. Arch Dis Child Fetal Neonatal Ed. 2003;88(3):229-36. https://doi.org/10.1136/fn.88.3.F229
17. Margotto PR. [Intrauterine growth curves: study of 4413 single live births of normal pregnancies]. J Pediatr (Rio J). 1995;71( 1):11-21. Portuguese. https://doi.org/10.2223/JPED.696
18. Mota M, Melo A, Burak C, Daltro C, Rodrigues B, Lucena R. Anthropometric cranial measures of normal newborn. Arq Neuropsiquiatr. 2004;62(3A):626-9. https://doi.org/10.1590/S0004-282X2004000400011 19. Yudkin PL, Aboualfa M, Eyre JA, Redman CW, Wilkinson AR. New
birthweight and head circumference centiles for gestational ages 24 to 42 weeks. Early Hum Dev. 1987;15(1):45-52. https://doi.org/10.1016/0378-3782(87)90099-5
20. Villar J, Cheikh Imail L, Victora CG, Ohuma EO, Bertino E, Altman DG et. al. International standards for newborn weight, length, and head circumference by gestational age and sex: the Newborn Cross-Sectional Study of the INTERGROWTH-21st Project. Lancet. 2014;384(9946):857-68. https://doi.org/10.1016/S0140-6736(14)60932-6
21. Hackman DA, Farah MJ, Meaney MJ. Socioeconomic status and the brain: mechanistic insights from human and animal research. Nat Rev Neurosci. 2010;11(9):651-9. https://doi.org/10.1038/nrn2897 22. Britton JR, Britton HL, Jennet R, Gaines J, Daily WJ. Weight, length,
head, and chest circumference at birth in Phoenix, Arizona. J Reprod Med. 1993;38(3):215-22.
23. Kierans WJ, Kendall P, Foster LT, Liston RM, Tuk T. New birth body length and head circumference charts for the British Columbia population. BCMJ. 2007;49(2):72-7.
24. Sivan Y, Merlob P, Reisner SH. Head measurements in newborn infants. J Craniofac Genet Dev Biol. 1984;4(4):259-63. 25. Whitehouse AJO, Maybery MT, Hart R, Sloboda DM, Stanley FJ,
Newnham JP, et al. Free testosterone levels in umbilical-cord blood predict infant head circumference in females. Dev Med Child Neurol. 2010;52(3):e73-7. https://doi.org/10.1111/j.1469-8749.2009.03546.x 26. Gur RC, Turetsky BI, Matsui M, Yan M, Bilker W, Hughett P et al.
Sex differences in brain gray and white matter in healthy young adults: correlations with cognitive performance. J Neurosci. 1999;19(10):4065-72.
27. Lombardo MV, Ashwin E, Auyeung B, Chakrabarti B, Taylor K, Hackett G, et al. Fetal testosterone Influences sexually dimorphic gray matter in the human brain. J Neurosci 2012;32(2):674-80. https://doi.org/10.1523/JNEUROSCI.4389-11.2012 28. Mandarino NR, Chein MB, Monteiro Júnior F, Brito LM,
Lamy ZC, Nina VJ et al. [Aspects related to choice of type of delivery: a comparative study of two maternity hospitals in São Luís, State of Maranhão, Brazil]. Cad Saúde Pública. 2009;25(7):1587-96. Portuguese. https://doi.org/10.1590/S0102-311X2009000700017 29. Fenton TR, Kim H. A systematic review and meta-analysis to revise
the Fenton growth chart for preterm infants. BMC Pediatrics. 2013;13(1):59. https://doi.org/10.1186/1471-2431-13-59 30. Ulrich M. Fetal growth patterns in a population of Danish newborn