UNIVERSIDADE DE LISBOA FACULDADE DE CI ˆENCIAS DEPARTMENTO DE INFORM ´ATICA
EVALUATION OF WSN TECHNOLOGY FOR
DEPENDABLE MONITORING IN WATER
ENVIRONMENTS
Mestrado em Engenharia Inform´atica
Especializac¸˜ao em Arquitetura, Sistemas e Redes de Computadores
Carlos Alexandre Aleixo Nascimento
Dissertac¸˜ao orientada por:
Prof. Doutor Ant´onio Casimiro Ferreira da Costa
Prof. Doutor Pedro Miguel Fraz˜ao Fernandes Ferreira
Agradecimentos
Este trabalho foi apoiado pela Fundac¸˜ao para a Ciˆencia e a Tecnologia (FCT) atrav´es da unidade de investigac¸˜ao LASIGE (UID/CEC/00408/2019) e do projeto AQUAMON (PTDC/CCI-COM/30142/2017).
Resumo
H´a v´arios problemas que surgem quando se monitoriza uma ´area geogr´afica recor-rendo a uma rede de sensores sem fios sem fiabilidade para a leitura de dados e a disseminac¸˜ao dos mesmos. Estes problemas manifestam-se sob forma de qualidade da transmiss˜ao, medic¸˜oes com valores errados ou a alterac¸˜ao do valor inicial durante a transmiss˜ao ou at´e a omiss˜ao de um valor esperado, podendo comprometer o sistema. A motivac¸˜ao por detr´as da criac¸˜ao da metodologia proposta nesta tese ´e a construc¸˜ao e instalac¸˜ao de uma rede de sensores de fios para monitorizac¸˜ao aqu´atica. Como tal, tamb´em ´e necess´ario proceder `a escolha de uma tecnologia sem fios que consiga satisfazer os requisitos dessa mesma rede. Tal rede incorposa-se num projecto chamado Aquamon.
O Aquamon ´e um projecto que surge como iniciativa de reposta aos problemas an-teriormente mencionados no que toca `a monitorizac¸˜ao confi´avel usando redes sem fios. No contexto deste trabalho, o principal desafio ´e a escolha de uma tecnologia sem fios no meio aqu´atico. A imprevisibilidade da ondulac¸˜ao a somar ao movimento de mar´e ampli-ficam as faltas sentidas na comunicac¸˜ao dos dados. A rede que ser´a instalada situar-se-´a na ba´ıa do Seixal, na margem sul do rio Tejo. Os objectivos do projecto passam pela instalac¸˜ao de uma rede de sensores sem fios, a recolha de amostras da qualidade da ´agua e o estudo do caudal e restantes movimentos aqu´aticos causados pelas mar´es.
Quanto `as tecnologias sem fios usadas em redes de sensores sem fios, as limitac¸˜oes normalmente encontram-se na Qualidade de Servic¸o e na disponibilidade que fornecem. Estas limitac¸˜oes normalmente encorrem de v´arios requisitos aplicacionais e/ou funcionais que tˆem de ser satisfeitos para garantir a operacionalidade correcta da rede. Durante a es-colha da tecnologia sem fios a ser usada na rede ´e imperativo ter estes requisitos em conta. Este processo de escolha da tecnologia ´e normalmente feito de forma n˜ao met´odica, ma-nualmente e sem padr˜oes definidos. ´E, portanto, um processo feito de maneira ad-hoc, com base no conhecimento (ou nas preferˆencias) do designer da rede onde os pr´os e contras de cada tecnologia s˜ao comparados e revistos com os requisitos aplicacionais e funcionais da rede em mente. Mesmo em redes simples e de pequena escala h´a uma enorme sobreposic¸˜ao de requisitos, quer sejam funcionais ou n˜ao. A enorme complexi-dade que adv´em da conciliac¸˜ao entre requisitos, as diversas tecnologias sem fios e todas as poss´ıveis soluc¸˜oes resultantes da combinac¸˜ao dos dois primeiro factores faz com que a tarefa de encontrar uma soluc¸˜ao ´optima seja dif´ıcil, se n˜ao imposs´ıvel. Acrescenta-se
que nem sempre ´e f´acil perceber o que realmente constitui uma soluc¸˜ao ´optima. Todos estes problemas no processo de escolha de uma tecnologia sem fios at´e agora referidos serviram de motivac¸˜ao para esta tese.
Uma nova categoria de tecnologias sem fios foi criada, de nome LPWA (Low Power Wide Area) e nela se encontram notoriamente trˆes tecnologias: NB-IoT, Sigfox e Lo-RaWAN. Estas novas tecnologias foram criadas para serem usadas em aplicac¸˜oes IoT e portanto tomam relevˆancia no contexto deste trabalho. Visto que s˜ao trˆes tecnologias re-centes e o seus graus de maturidade s˜ao baixos, um dos objectivos da tese ´e o estudo destas trˆes tecnologias. Ser˜ao estudadas de forma te´orica, n˜ao havendo experimentac¸˜ao pr´actica com as trˆes tecnologias. As tecnologias ser˜ao estudadas em relac¸˜ao `a sua auto-nomia, custo (tanto operacional como de aquisic¸˜ao), arquitectura, cobertura geogr´afica e qualquer outra propriedade de relevo. N˜ao s´o ser´a feita uma comparac¸˜ao entre as trˆes mas tamb´em com uma tecnologia mais madura, o ZigBee.
O trabalho feito para concretizar o primeiro objectivo da tese, tal como a compre-ens˜ao dos problemas inerentes que advˆem da instalac¸˜ao de uma rede de sensores sem fios, servem como fundac¸˜ao para o objectivo final da tese. O segundo objectivo ´e con-seguir criar uma metodologia que contraria a subjectividade presente na escolha de uma soluc¸˜ao ´optima para a rede de sensores sem fios. Com isto quer-se a criac¸˜ao de um pro-cesso standard, automatizado que remove factores externos n˜ao t´ecnicos do propro-cesso de decis˜ao.
Antes de criar a metodologia estudou-se as tecnologias LPWA que poder˜ao ser alter-nativas a qualquer rede de sensores sem fios, no entanto, a metodologia tamb´em tem de ter em conta os requisitos da rede. ´E precisamente por isto que foi feito um levantamento dos requisitos mais frequentemente usados em redes de sensor sem fios e as suas respectivas definic¸˜oes. Depois de ter sido tomado conhecimento sobre os detalhes t´ecnicos das tec-nologias, os problemas inerentes a rede de sensores sem fios e os requisitos influenciam a rede pode-se comec¸ar a criar a metodologia.
A metodologia tem em conta os v´arios requisitos aplicacionais e funcionais, as ca-racter´ısticas t´ecnicas das v´arias tecnologias consideradas (NB-IoT, Sigfox, LoRaWAN e ZigBee) e retorna um espac¸o de soluc¸˜ao que melhor satisfaz todos os requisitos. N˜ao s´o oferece uma metodologia que atinge objectivamente o melhor conjunto de soluc¸˜oes ´optimas, como tamb´em foi pensada de maneira a automatizar todo o processo de escolha minimizando ao m´aximo o papel do designer da rede.
Uma das inovac¸˜oes desta metodologia ´e a utilizac¸˜ao de um grafo como representac¸˜ao da rede f´ısica. Os v´ertices representam n´os da rede e arestas a ligac¸˜ao f´ısica entre dois n´os. O designer da rede estabelece os requisitos para cada v´ertices. No entanto os requi-sitos das arestas s˜ao impostos pelos requirequi-sitos dos v´ertices. A metodologia est´a dividida em 4 passos: estabelecimento dos v´ertices, ligac¸˜ao dos v´ertices, sobreposic¸˜ao de grafos e finalmente a definic¸˜ao do espac¸o de soluc¸˜ao. Os trˆes primeiros passos servem para a
construc¸˜ao do grafo final que cont´em toda a informac¸˜ao acerca dos requisitos e tecnolo-gias consideradas. Esta informac¸˜ao ´e depois extra´ıda e ´e gerado um espac¸o de soluc¸˜ao. Este espac¸o ´e por norma constitu´ıdo por um n´umero massivo de soluc¸˜oes que cresce ex-ponencialmente com o aumento linear de n´os na rede. O designer da rede define crit´erios de avaliac¸˜ao, estes crit´erios d˜ao valor a cada uma das soluc¸˜oes. A definic¸˜ao destes crit´erio servem tamb´em para n˜ao s´o dar poder de decis˜ao ao designer da rede mas tamb´em para lhe ser poss´ıvel definir aspectos que s˜ao relevantes para aquele caso de uso em espec´ıfico. Nem todas as soluc¸˜oes s˜ao ´optimas, para filtrar o espac¸o de soluc¸˜ao e conseguir obter um sub-espac¸o de soluc¸˜oes ´optimas, as soluc¸˜oes s˜ao passadas por um algoritmo da Parede de Pareto. Ap´os esta filtragem, o designer da rede pode finalmente escolher a sua soluc¸˜ao.
Foram escolhidos dois parˆametros de avaliac¸˜ao da metodologia: efic´acia e perfor-mance. A eficacia deve-se `a capacidade da metodologia conseguir reduzir suficiente-mente o espac¸o de soluc¸˜ao de modo a que o designer da rede consiga analisar as soluc¸˜oes ´optimas e escolher uma. A performance est´a relacionada com o tempo em que a metodo-logia consegue produzir resultados.
Estes dois parˆametros foram avaliados de diferentes maneiras. Para ambos foram usados os mesmo casos de uso: 4 casos de uso gen´ericos e o caso de uso do Aquamon. Desta maneira conseguimos o contraste entre casos de uso gen´ericos e um caso de uso que ser´a realmente instalado no terreno de forma operacional. A percentagem de reduc¸˜ao do espac¸o de soluc¸˜ao gerado para o sub-espac¸o de soluc¸˜oes ´optimas (ap´os o algoritmo de Pareto) foi a medida usada para avaliar a efic´acia. Quanto `a performance, a ferramenta que implementa a metodologia executou dez vezes sobre cada caso de uso. A m´edia aritm´etica do tempo de execuc¸˜ao (em segundos) da ferramenta foi usado para medir a performance.
Finalmente s˜ao dadas listadas algumas sugest˜oes de melhoramento da metodologia como tamb´em algumas deficiˆencias da metodologia que poder˜ao motivar trabalho futuro.
Palavras-chave: lwpa, methodology, comparative study
Abstract
Few problems arise when trying to reliably monitor a surrounding environment by the use of sensors and a wireless network to disseminate the information gathered. In the context of an aquatic environment, the undulation and the low predictability of the surrounding environment could cause faults in the transmission of data. The initial moti-vation for the work developed in this thesis was the Aquamon project.
Aquamon is a project that has as objective the deployment of a dependable Wireless Sensor Network (WSN) for the purposes of water quality monitoring and the study of tidal movements. Therefore, Aquamon, like any other WSN will have to go through the process of choosing a technology that meets its application requirements as well as the requirements imposed by the deployment environment.
WSNs can have constraints when it comes to the Quality of Service and availabil-ity it can provide. These networks generally have a set requirements that need to be satisfied. Thus, there needs to be a selection of one (or multiple) wireless technologies that can satisfy said requirements. This selection process is usually done in a ad-hoc way, weighting the advantages and disadvantages of different possible solutions with respect to some requirements, often using empirical knowledge or simply dictated by the designer’s preference for some particular technology. When several functional and non-functional requirements have to be addressed, finding an optimal or close to optimal solution may become a hard problem. This thesis proposes a methodology for addressing this optimi-sation problem in an automated way. It considers various application requirements and the characteristics of the available technologies (including Sigfox, LoRa, NB-IoT, ZigBee and ZigBee Pro) and delivers the solution that better satisfies the requirements. It illus-trates how the methodology is applied to a specific use case of WSN-based environmental monitoring in the Seixal Bay.
Keywords: lwpa, methodology, comparative study
Contents
List of Figures xiii
List of Tables xv 1 Introduction 1 1.1 Motivation . . . 2 1.2 Objectives . . . 2 1.3 Structure . . . 3 2 Background work 5 2.1 State of the art in WSN deployment and LPWA studies . . . 5
2.2 LPWA Technologies . . . 6
2.2.1 NB-IoT . . . 7
2.2.2 Sigfox . . . 8
2.2.3 LoRaWAN . . . 10
2.3 ZigBee and ZigBee PRO . . . 12
2.4 Comparison between the different technologies . . . 13
2.5 Application requirements . . . 16
2.5.1 Explicit network requirements . . . 17
2.5.2 Implicit network requirements from application characteristics . . 18
2.5.3 Implicit network requirements from a management perspective . . 19
2.6 Summary . . . 20
3 Wireless Technology Selection Methodology 23 3.1 Problem Definition . . . 23
3.2 Methodology Overview . . . 24
3.3 The Methodology . . . 24
3.3.1 Basic concepts . . . 24
3.3.2 Establishing the vertices . . . 25
3.3.3 Linking the vertices . . . 25
3.3.4 Superposing graphs . . . 27
3.3.5 Definition of the solution set . . . 28 xi
3.4 Summary . . . 31
4 Implementation 33 4.1 Program Architecture and Data Structures . . . 33
4.2 Code . . . 36
4.3 Summary . . . 38
5 Evaluation 39 5.1 Evaluation Objectives . . . 39
5.2 Method of Evaluation . . . 39
5.3 Analysis of the results . . . 47
5.3.1 Effectiveness . . . 47 5.3.2 Performance . . . 51 5.4 Summary . . . 52 6 Open issues 57 7 Conclusion 59 Bibliography 63 xii
List of Figures
2.1 Overview of the Sigfox architecture.[1] . . . 9
2.2 Overview of LoRaWAN’s layers.[2] . . . 11
2.3 High level overview of the LoRaWAN architecture.[2] . . . 12
2.4 Coverage of the Sigfox network in Portugal (mainland). . . 16
3.1 Graph with annotations . . . 25
3.2 Demonstration of one iteration of Algorithm 1 for one vertex (line x-z). . 27
3.3 Visual showcase of the impact requirement inheritance has on the network. 27 3.4 Superposition of partial graphs. . . 28
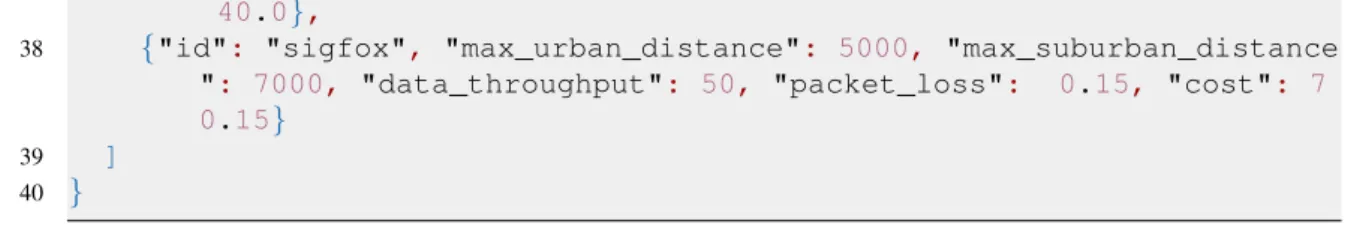
4.1 Runtime stages from the setup file input to the final scatter plots output. . 36
5.1 Map overview of the deployment area - Seixal Bay. . . 44
5.2 Establishing the vertices according to their physical layout on the map. . . 45
5.3 View of the 3D scatter plot over the x axis (Homogeneity). . . 48
5.4 Average hops in function of homogeneity. . . 49
5.5 Average hops in function of cost. . . 49
5.6 Cost in function of homogeneity. . . 50
5.7 Examples of graphs according to the criteria rating. . . 53
5.8 Examples of graphs according to the criteria rating. . . 54
5.9 Sub-optimal graph with rating (75, 176.5, 1.3). . . 55
5.10 Average execution time of each generic use case (in seconds). . . 55
List of Tables
2.1 Comparison between LPWAN technologies. . . 14
3.1 Annotation of the requirements in each vertex. . . 25
5.1 Annotation of the requirements in each vertex. . . 46
5.2 Runtimes of each execution for each use case (in seconds). . . 51
Chapter 1
Introduction
With the introduction of LPWA (Low Power Wide Area) technologies the available scope of wireless technologies for the deployment of WSN (Wireless Sensor Network) in-creased. There are now diverse technologies to choose from which differ at various technical levels. Where some technologies excel, others have limitations. This is be-cause different technologies were created to be used in different situations and to address different application requirements.
Therefore, there is no single technology that is appropriate to address the outstanding requirements of every possible use case. Moreover, selecting one or a set of technologies that will appropriately address the application requirements is a hard problem. This is not only because the amount of possible options tends to be large, namely when considering possible combinations of technologies to serve in different parts of a WSN, but also be-cause there are situations in which it is not obvious which solution is optimal, and finally because there are human aspects that often influence the selection process based only on empirical knowledge that is sometimes not substantiated. For instance, managerial deci-sions or personal bias can influence the selection process leading to either sub-optimal or downright wrong selection choices. In this thesis we propose a solution to address this problem. More precisely, we introduce a methodology to automate the process of select-ing one or multiple LPWA technologies while satisfyselect-ing a set of application requirements. By automating the process, we not only facilitate the selection process but also provide a way to reach optimal or close to optimal solutions, removing subjectivity, personal bias, and possible assessment mistakes from the technology selection process.
Our proposed methodology consists of four steps. They go from the gathering of information regarding the application requirements (e.g., concerning functional aspects like throughput or communication distance as well as non-functional aspects like cost or network homogeneity) to the provision of a set of possible solutions for the problem, in-cluding two steps whose purpose is to eliminate solutions that do not meet requirements. We argue that this solution hits the sweet spot in solving the problem of finding the right solutions for the network technologies to be used, which satisfy the application
Chapter 1. Introduction 2
ments and, whenever possible, still allow some degree of flexibility in the final choice.
1.1
Motivation
The initial motivation to start the working on the proposed methodology came from the need to design and choose a technology to be used in a WSN for the Aquamon project. The Aquamon project has as objective the deployment of a WSN that is reliable and satisfies real-time constraints. Thus, a study on the available wireless technologies is required. There are many wireless technologies suitable for WSNs, they differ in many technical aspects such maturity, energy consumption, data throughput, area coverage and perhaps most importantly, optimal use case. The first choice for the technology to be used in the deployment of Aquamon’s WSN was ZigBee. Although ZigBee is a mature technology, a new category of wireless technologies appeared. These technologies are denominated LPWA (Low Power Wide Area) and were designed for the deployment of large IoT applications.
These new technologies still suffer from some problems that stem from the lack of reliable delivery of the data, insufficient coverage and throughput, in some cases the lack of flexibility in the deployment of such networks. In addition, the necessity of balancing energy consumption with the amount of transmission time cannot be ignored. Conse-quently, a situation is created where the selection of the technology is in the hands of the network designer, making her responsibility to find the optimal solution (technology) that satisfies all the requirements. Reaching an optimal solution is not an easy task and there is no common practices that are employed. Moreover, it is not always clear what is the best definition of an optimal solution.
Not only there are technical aspects that constrain the choosing process, there is also the human factor. Human bias, lack of knowledge and managerial decisions remove ob-jectivity from the final solution. Unfortunately, there aren’t many answers to this problem. In essence, there is not a concrete pattern, methodology or automated process that is standard when it comes to picking a wireless technology for a WSN.
1.2
Objectives
The thesis has two main objectives. The first one is the study of the LPWA technologies such as NB-IoT, Sigfox and LoRaWAN and how they compare to not only each other but also ZigBee.
This background work, together with the understanding of the inherent problems of deploying WSNs, serves as foundation for the main objective of the thesis. The second objective is to bring forth a solution that aids in the process of choosing a technology (or more) to be used in a WSN. The objective is to provide a solution that establishes a
Chapter 1. Introduction 3
standard automated process which removes any external human biases and provides the most objective solution space according to the requirements of the WSN.
1.3
Structure
Firstly, in Section 2.1, an overview of the several related works that have been done in regards to the monitoring of water bodies and the deployment of WSN in different use cases. Following that, Section 2.2 gives an introduction and a detailed discussion on the LPWA technologies. Section 2.3 describes how ZigBee differs from LPWA technologies and provides a foundation to be used in Section 2.4 where LPWA technologies and ZigBee are compared. Since the scope of this work is the deployment of WSNs, Section 2.5 lists several requirements that are used to define any WSN.
Chapter 3.3 describes the solution found for the problem of choosing a wireless tech-nology in the deployment of a WSN. It starts by giving a problem definition followed by a methodology overview. Afterwards it focuses in explaining the methodology. Chapter 4 gives insight to the implementation of the tool and the various algorithms and procedures that constitute the methodology.
The evaluation of the methodology is done in Chapter 5. First it presents the evaluation objectives and how the evaluation will take place. The analysis of the results is done in Section 5.3.
Finally, Chapter 6 lists several suggestions to improve the methodology as well as relevant issues that be built upon in future work.
Each chapter concludes with a small summary of what was discussed which also serves as a segway for the next chapter.
Chapter 2
Background work
Firstly, a survey of the past and current work that is being done on the subject of deploy-ment of WSNs is shown in Section 2.1. The content of the featured works showcase the use of new LPWA technologies in several use cases, but also a demonstration of several methodologies that aid the process of the deployment of WSN.
This chapter contains a survey and a review of the most recent category in wireless technologies and which technologies are part of it. This paradigm of wireless technologies is called LPWA and its most notable technologies are NB-IoT, Sigfox and LoRaWAN. Not only introduces new concepts like LPWAs (Section 2.2) but also a more mature technol-ogy like ZigBee (Section 2.3). After a detailed review of both LPWA technologies and ZigBee, Section 2.4 compares the two on a technical scale with the aide of Table 2.1. Moreover, some of the comparison points present in the table are discussed, providing more insight and detailed information to complement what is presented on the table.
Section 2.5 lays forth relevant background knowledge to be applied in Chapter 3.3 in regards to wireless communication and application requirements.
2.1
State of the art in WSN deployment and LPWA
stud-ies
Recent work on real-time monitoring of water bodies has been able to not only show practical results of the use of LPWAs and ZigBee but also to help general population and authorities. LoRa was used in India where a system was deployed to monitor water quality and to alert the authorities in real-time whenever the water quality dropped below a certain level. They improved water quality, established alert systems to help the population and farmers.[3]
In Malaysia, ZigBee was used to monitor water quality. A monitoring software with GUI was developed to be able to interact with the base station. Thanks to the reliability of the ZigBee communication, it was deemed a satisfactory monitor system.[4]
Not only there is practical work but theoretical as well. The interoperability between 5
Chapter 2. Background work 6
systems is compromised by the lack of standards and proper models. To tackle this issue, in Spain, a detailed architecture and modelling system were created to help define the integration of IoT concepts in water monitoring systems. A simple water management system was made to show off the model in practice.[5]
Mac et al[6] identify two different application use cases and a taxonomy is established for the network requirements. Some of these requirements were also considered in the methodology presented in this thesis.
D´ıaz and coworkers [7] describe a seven step methodology that goes from require-ment gathering to deployrequire-ment and maintenance of a WSN for agricultural applications. While the methodology includes several steps, similarly to the methodology presented in this thesis, these steps correspond to the life cycle of a WSN application and not specif-ically to the process of selecting an appropriate solution for the adopted technologies. Furthermore, the thesis is focused on a specific application area.
In [8] the authors try to solve the problem of selecting the best technology for a set of requirements in a WSN, presenting a two step methodology. Firstly, the available technologies are reduced to only those that satisfy the gathered requirements. Then, the result obtained in the first step is further refined by taking into account cost requirements. This work considers two use cases to practically demonstrate the methodology and how it helped to solve the deployment of two very different WSNs: one to monitor containers in a port and the other to manage parking lots. The methodology introduced in this thesis is more elaborate in the intermediate steps to prune inappropriate solutions.
2.2
LPWA Technologies
With the increased demand of connected devices to the Internet or to each other forming huge networks performing several tasks such as smart agriculture, smart metering, smart grids, smart city, the monitoring of environments a new problem arose: the lack of a technology (or a bundle of them) that could answer the needs that these applications demand. The technology needed to satisfy the requirements imposed by these use cases is one that allows for the possibility to employ an ubiquitous, scalable long range wireless network, reliable, with good quality of service. The throughput stops being a priority being replace by an efficient way of managing energy.[9]
Some technologies exist that answer to some of the above-mentioned requirements, some more than others. 4G/LTE are a group of technologies that seem to be able to be used for IoT applications, unfortunately they lack in several points that are deal breakers. They were planned for applications that require large amounts of data for long periods of time with little latency, this is not ideal to IoT applications where the pattern of communication is normally defined by sporadic exchanges of small amounts of data and latency is not a priority[10, 9]. The use of great amounts of energy (in the context of IoT) is also
Chapter 2. Background work 7
a concern. This becomes a nuisance as it makes the upkeep of the devices extremely difficult, specially in rural areas. In contrast, LPWAs can have a battery life in the order of a decade[11].
Since the most suitable use cases for LPWA technologies require a large, scalable, energy efficient network, the cost of each device should be affordable in large quantities. Under the LPWA umbrella three technologies take the spotlight: NB-IoT, Sigfox and LoRaWAN. Even though they are contained in the same category of wireless technologies, they still differ between each other and offer solutions to different use cases. More de-tailed information on these technologies will be given from Section 2.2.1 to Section 2.2.3.
2.2.1
NB-IoT
Narrowband IoT is a standard defined by 3GPP on Release 13 which runs on top of current GSM/LTE networks. It uses a low frequency licensed spectrum in the 700MHz-900MHz range. The reason as to why it was implemented was to create an alternative technology that had be thought out from the ground up to serve IoT applications, satisfying their requirements that GSM/LTE networks could not.
Its communication protocol is similar to that of LTE, in fact, NB-IoT is LTE with some tweaks (restricting some parts and extending others) to better mould it to what the necessities of IoT applications[10].
One of the first production test deployments of a NB-IoT is being done in Belgium[9]. Technical Details
Thanks to the nature of these low frequencies that IoT uses to transmit its data, NB-IoT gains in terms range of coverage and indoor and deep-indoor penetration, technolo-gies with higher frequencies such as WiFi have difficulties in both these capabilities.
NB-IoT uses a licensed spectrum[12]. The fact that the frequencies are licensed, frees them from the noise that is common in unlicensed frequencies, this improves greatly the quality of service[12].
There are three ways to deploy NB-IoT[10, 13]
• In-band operation: uses one or more resource blocks from the LTE carrier, this means that the base station is allocating resource both for LTE and NB-IoT. This sharing of resources does not impact the performance of either.
• Guard band operation: uses resource blocks from the LTE carrier that aren’t being used for guard band. As a result the transmission power is greater since it shares the same amplifier power as the LTE channel.
• Stand alone operation: uses an isolated spectrum. The base station allocates all its resources to NB-IoT which results in a wider coverage. In the future this will
Chapter 2. Background work 8
overtake GSM carriers.
NB-IoT’s communication is synchronous which has an effect on it is battery life as it can not indefinitely sleep, on the other hand, it provides lower latency. Long duration communications are difficult because there is not an indication of signal deterioration.To mitigate this terminal devices adjust themselves to three coverage levels: 144dB, 154dB and 164dB. Bigger the dB, bigger the area covered.
Architecture
The architecture is divided in three main components. Firstly we have the NB-IoT mod-ules that are coupled with IoT devices, these then connect to the base stations which then redirect the data to the cloud where they can be analysed and processed as seen fit.
Due to the fact that NB-IoT is a standard close to LTE and utilises the same infrastruc-ture (base stations for example) it is then only natural that GSM,4G/LTE providers are the ones that will supply NB-IoT. Little work is necessary for a base station to be compliant with NB-IoT, it only needs an antenna capable of transmitting the required frequencies and in some cases a small firmware update.[13, 14, 10] It’s up to the providers to manage the infrastructure.
Cost
NB-IoT modules are cheap. Another argument supporting why existent GSM providers will be the ones to provide NB-IoT is that the cost to transmit in licensed spectrum is vastly too great for someone that hasn’t an infrastructure yet.
2.2.2
Sigfox
Sigfox is a proprietary technology created by a private company. Provides long range coverage and a small energetic footprint. Unlike NB-IoT it transmits over an unlicensed spectrum (868MHz in Europe), which makes Sigfox comply with duty cycle[15], there-fore it is subject to noise and interference from other devices that may be transmitting and the restriction of time it may transmit.
Normally Sigfox partners with another company to manage the infrastructure. The client is only responsible for the terminal Sigfox modules, the base stations and the Sigfox Cloud are closed to them. This gives the client peace of mind and decoupling from the management of such big infrastructures but puts them in the hands of the Sigfox which may experience temporary hiccups in availability, for example, leaving the client unable to receive their data[16].
Chapter 2. Background work 9
Technical Details
Although bidirectional communication is supported, the number of Downlink messages is restricted to subscription plans. Messages are 12 bytes long and the maximum of allowed messages is 140 a day, this number goes down depending on the subscription plan[15, 1]. To ensure reliability Sigfox uses a process called Random Access where 3 messages are sent in 3 different time periods which then are received by the Sigfox base stations, no acknowledgement is made by the base stations[1], this saves battery.
Architecture
Sigfox’s infrastructure is closed, the client only has access to terminal devices, applica-tions must use the Sigfox Cloud API to retrieve the data and to communicate with said terminal devices[10].
Its architecture is divided in three parts, in all of them the communication protocols are closed and the client has no power over it. Even so, the client can choose to use it is cryptographic algorithms instead of the default closed Sigfox cryptography[17]. Terminal devices connect to Sigfox Base Stations which before sending them to the Sigfox Cloud perform several operations on the data like deletion of redundant messages for example. To retrieve the data from the Sigfox Cloud the client needs to use the Sigfox API.
Chapter 2. Background work 10
Cost
As referred already, the number of messages transmitted per day depends on the sub-scription plan chosen by the client. Different plans offer different message thresholds for Uplink and Downlink alike. On the other hand the client does not need to worry about the management of such big infrastructures.
Another thing that can not be neglected is the restrictive nature of the Sigfox API which makes the developing of an application using Sigfox very strict and not easily portable to any other technology. The Sigfox modules are cheap.
2.2.3
LoRaWAN
LoRaWAN is a LPWA communication standard which is maintained by LoRa Alliance, an open and non-profit association. It’s backed by big industry names like Orange, Cisco, IBM, etc and already has large deployed networks in several countries, The Netherlands is one example. For this reason, it can be said that LoRaWAN has a maturity level higher than that of NB-IoT.
Like Sigfox, LoRa transmits over an unlicensed frequency therefore it is susceptible to the same shortfalls as Sigfox when it comes to the interference of other devices and the need to comply with the duty cycle[18]. Differently though, LoRaWAN as it is an open protocol (except the physical layer) it has no maximum number of message exchanges. Technical Details
As before-mentioned the access to the medium layer is proprietary and closed but the rest of the protocol is open[2]. The LoRa gateway receives the data from the terminals via radio and converts them to IP packets which are then forwarded so the central server. The second part of the communication can be by Ethernet, 3G, WiFi for example, the reverse is done when it is a downlink communication[2, 16, 15].
LoRa modules are divided in three classes:[2, 18]
• Class A - Less Energy, Bidirectional: It’s the default class. The communication is started at the terminal device and it is asynchronous. Thanks to that the device can sleep, saving energy. Despite this, the communication can still be bidirectional as there is a window where the gateway can answer after receiving a message.
• Class B - Bidirectional with deterministic downlink latency: In addiction to the downlink transmission windows, the communication is synchronous. There are predefined temporal instances where a heartbeat is sent which allows downlink transmissions deterministically at the expense of slight more energy consumption. • Class C - Less latency, bidirectional: Provides reduced latency by maintaining the
Chapter 2. Background work 11 Customer Application LoRaWAN™ Master HAL SPI PHY Packet Forward Backhaul IP Stack HAL SPI/USB PHY LoRa® FSK Customer Server Logic LoRaWAN™ Master Encrypted Ethernet, 3G, WiFi Backhaul IP Stack Encrypted
Figure 2.2: Overview of LoRaWAN’s layers.[2]
with very low latency at the expense of a bigger energy consumption. Terminal devices can change between Class A and Class B as convenient.
Packet payload vary from 19 to 250 bytes with 12 bytes of overhead. LoRa’s coverage is conditioned by the link budget, as in, playing with several variables such as bandwidth, coding scheme, transmission power and carrier frequency we can change the effective range of the device[2].
Gateways establish individual data rates for each terminal device, compromising range for transmission time. Different data rates do not interfere with each other, that way gateways can manage and balance used energy with transmission capabilities[2].
Scalability in the IoT context is a valid concern. The way that LoRa addresses this is in complement to the adaptive data rate, LoRa gateways have a multi-channel transceiver that permits the reception of several messages at the same time even with if they come in different data rates. The gateway also treats each device efficiently, it increased the data rate of closer devices to free up space for distant devices to also transmit[2].
Architecture
In contrast with both technologies already introduced, LoRa does not have a provider, it is the client’s job to design, implement and deploy their LoRaWAN infrastructure. In more detail, the way gateways talk to the central server or cloud service, the deployment of said server and the client application that retrieves the data are responsibility of the client.
LoRaWAN is divided in four parts: the terminal devices, the gateways, the central server and the client application. The LoRa modules on the terminal devices connect to
Chapter 2. Background work 12
the one or several gateways that then forward the data to the central server/cloud[2]. Gate-ways do not communicate among each other but multi-hop of end devices is possible[19]. A terminal node serves as relay for another one, this relay is used to further the coverage of the network which would not have been possible otherwise since the terminal device would be out of the gateway’s range. LoRa also supports broadcast messages.
AES Secured Payload
TCP/IP SSL LoRaWAN™
LoRa® RF LoRaWAN™ TCP/IP SSL Secure Payload
Application Server Concentrator/Gateway Network Server
End Nodes
3G/Ethernet Backhaul
Figure 2.3: High level overview of the LoRaWAN architecture.[2]
Cost
LoRa modules are cheap and gateways are found at an accessible price. The real cost is the process of designing, implementing and deploying a network, adding to that we then have to account for the management and upkeep of the infrastructure. In a way, this unrivalled freedom and flexibility that LoRa provides can be seen as a double edged sword.
2.3
ZigBee and ZigBee PRO
LPWAs do not necessarily replace existing technologies. There are applications where the use of Bluetooth seems more plausible than LoRaWAN for example, in the same train of thought, ZigBee continues to have a niche group of use cases that makes it more apt than any other LPWA technology. Although this might be true for most cases, special applications that now use ZigBee might change to LPWAs, this is because at the time no other alternative existed which forced the use of ZigBee, even if not optimal.
Chapter 2. Background work 13
The biggest advantage ZigBee has over LPWAs is that even though LPWAs are equipped with several different deployment methods, ZigBee allows for point to point communica-tion where there is not a need for a central point in the network. This mesh like topology is not possible in LPWAs which invalidates them from application that require the use of such topology and the benefits that comes with it.
In terms of coverage ZigBee can not compete with the great distances LPWA cover, on the other hand, it can reach farther than WiFi and Bluetooth. On that note, ZigBee does not offer the same energy efficiency as LPWAs, but once again, excels against PAN and WAN technologies. Regarding data throughput, ZigBee surpasses both Sigfox and LoRa rivalling NB-IoT. ZigBee is also a largely more mature and tested technology comparing to LPWAs.
Two use cases where ZigBee is used are the following:
Smart parking In this use case we talk how ZigBee was used on a smart parking ap-plication. It is to be considered that at that time no LPWA existed, but even if there were, they would not have been used since this use case used multihop mesh topology. A re-peater was put in place every 5-10 nodes and a gateway every 100-150 parking nodes. The gateways used a 3G modem or an Ethernet cable as a way to connect to the Internet[20].
Smart home We saw that one of the factors in favour of ZigBee comparing to any other LPWA techonology is that it is possible to deploy a mesh topology network, despite this, a star topology was used[21].
This was smart home application therefore we are to expect lots of devices through-out the home/building communicating via ZigBee and some complementary RFID. The latency and data rates are important in this context as it is crucial for the usability of the application without frustrating the people that inhabit the room/building. These latency and throughput requirements and also the constant need to send and receive data would in-validate Sigfox and LoRa. NB-IoT would also be undesirable since its architecture would over-complicate the application; data would be sent to the base station and then accessed through the cloud.
2.4
Comparison between the different technologies
After a brief introduction to these three LPWA technologies, a comparison between them will take place regarding some aspects that are relevant to IoT applications.
Table 2.1 gives an overview of the three technologies, then, a more detailed explana-tion will follow.
Chapter 2. Background work 14
Table 2.1: Comparison between LPWAN technologies.
NB-IoT LoRaWAN Sigfox ZigBee ZigBee PRO
Frequency 700-900 MHz 868 MHz 868 MHz 2.4 GHz 915 MHz 868 MHz[22] 2.4 GHz 915 MHz 868 MHz[23] Licensed Yes No No No No Data rate 190-250 kbps[11] 250bps-50 kbps[2] <100-600 bps[1] 250 kbps 250 kbps (at 2.4 GHz) 10 kbps (at 915 MHz) 100 kbps (at 868 MHz)[23] Payload 1600 bytes[24] 19-250 bytes
12 bytes overhead[2] 12 bytes[1]
100 bytes (no security)
82 bytes (with security)[22] variable: 1 octet with payload size[23] Topology Star Star Star Star/Mesh/Tree[22] Star/Mesh/Tree[23]
Coverage 1-8km (urban) 25km (suburban)[11] <35km[12] 2-5km (urban) 15km (suburban)[11] <15km[12] 3-10km (urban) 30-50km (suburban)[11] <15km[12] 100 m average: <300 m (line of sight) 75-100 m (indoor) <1km for sub GHz channels[23] Battery life 10 years[10] >10 years[11] 8-10 years[11] -
-Base cost - <30e 70e(w/ 1 year subscription) <30e <45e
Subscription cost Yes No Yes No No
Architecture
The three technologies are similar in terms of architecture. Neither of them offer a point to point communication, all the data is converged to a central point on the network, the cloud. In retrospect, there are three parts of the architecture that are common: the terminal devices, the cloud and the client application. Noting this, these will be the subjects of our comparison.
Out of the three the one that offers more liberty in deployment in LoRaWAN, not only because it permits having several gateways but also because multi-hop can also be achieved. The LoRa standard does not establish directives on how to process data on the cloud which grants more flexibility in deployment.
In contrast, Sigfox is the one that has the most closed environment. The client does not have any power where their data is stored and how it is sent. To retrieve its data, the client need to use the Sigfox API to interact with the Sigfox Cloud. Not only this but we are in the hand of Sigfox, if for whatever reason some part of the Sigfox infrastructure loses temporary availability there will not the data being transmitted and/or being retrieved.
When NB-IoT is compared with LoRaWAN, one of the conclusions is that NB-IoT is the one that grants a better Quality of Service. This is due to the transmission over licensed frequencies and a provider maintaining the infrastructure. As LoRaWAN varies synchrony model from NB-IoT (meaning it is asynchronous) and uses unlicensed frequen-cies, it is recommended that LoRaWAN be used in applications where quality of service, latency, data integrity and data throughput are not a big factor. If they are, NB-IoT should be the technology chosen.[12]
Throughput
Data throughput is not a priority for LPWAs hence the low data rates that all of them have. As can be seen from Table 2.1, NB-IoT provides the most data rate of the three. Moreover, as it uses a licensed spectrum, it is not restricted by duty cycle meaning it can transmit at any time.
Chapter 2. Background work 15
The other two technologies are bound to the unlicensed spectrum. Per Table 2.1, Lo-RaWAN has a huge discrepancy in data rate values, this is due to its channel disposition. LoRaWAN has ten channels, eight of them have speeds varying from 250bps to 5.5kbps, one has the speed of 11kbps and the last of 50kbps[2]. The disposition of these channels changes with the geographic region, the values presented are the European Union norm.
Sigfox markets its platform saying we can transmit 36 seconds of each hour due to the duty cycle. Subscription plans also limit the number of messages per day and conse-quently the quantity of data that is transmitted.
As is with NB-IoT, LoRa does not limit the number of messages to be sent having only to oblige to the duty cycle. Different classes of LoRa modules influence the quantity of data transmitted between the module and the gateway. As an example, a device could be running in Class A and change to Class C to be able to more quickly receive a Downlink firmware update[2].
Coverage
The way these three technologies provide coverage for their network varies from each other.
In NB-IoT’s case since that it is a LTE version, where currently exists 3G/4G/LTE coverage there should also be NB-IoT coverage in the future. For the base station to support NB-IoT it only needs the installation of an antenna capable of transmitting on the desired frequencies (700 to 900MHz), in some cases, a small firmware update might be needed. So there is high hopes that NB-IoT gains global coverage.
In regards to LoRa it is up to the client to deploy the gateways in the areas he sees fit since it is the gateways that provide the coverage. This has an advantage over both Sigfox and NB-IoT in that the client is not limited to the only areas of coverage a third party deems relevant, leaving other areas with poor to none coverage.
Sigfox outsources the management of it is infrastructure to a partner, and so, the areas that will have coverage are responsibility of that partner which might cause limitations to the client. Figure 2.4 shows the current coverage of the Sigfox network in Portugal (mainland).
Cost
The cost for the terminal modules is similar in all three technologies. The real cost, technically speaking, varies with each technology.
Since Sigfox is a closed and proprietary platform, applications are bound to the Sigfox API raising the cost of migration to another platform. We can not dismiss the subscription plans which have to be bought to access the Sigfox platform, different plans allow and limit the client to a certain number of messages per day, Uplink and Downlink alike.
Chapter 2. Background work 16
Figure 2.4: Coverage of the Sigfox network in Portugal (mainland).
If Sigfox’s cost is due to its closed nature, LoRa’s cost is precisely due to the opposite. As it was said already, the prices of the modules are low however the cost of operating a LoRa network is in the planning, implementing and managing all of its infrastructure. On a small scale this is achievable and sometimes wins over other technologies but as the network expands it rapidly becomes unfeasible without a great personal investment.
2.5
Application requirements
This section lists several application requirements and their definitions. These require-ments were deemed the most relevant out of many more. The list of requirerequire-ments was divided into two groups: the explicit requirements and the implicit requirements wherein there is a subgroup of requirements which come from a managerial stand point.
The reason for the separation of requirements in two is that some requirements differ in how they are defined. Explicit requirements, as the name entails, need to be specified by the network designer. They are attributes given to the network and not something inherent to it. Latency, data throughput, minimum packet loss are requirements that need to be specified and cannot be deduced by the network designer. Same goes for every requirements in this category.
In contrast, implicit requirements can be inferred from the network. They characterise the network by defining how big the network is, how many nodes, what the surrounding environment of the nodes is.
Chapter 2. Background work 17
2.5.1
Explicit network requirements
The identified requirements featured in this section are availability, latency, packet loss and data throughput.
Availability
The network is composed by several types of components like end-nodes, gateways and central servers, all of which may fail in ways that compromise the ability to communi-cate. Availability requirements express the need for the network to be operational with some probability. Availability is expressed by the ratio of uptime with the total time of operation.
Latency
Communication latency refers to the time needed for a message to be sent from a source to a destination, usually expressed in time units (e.g., milliseconds). Defining the syn-chrony model for the application is the first important step. Applications can either be synchronous or asynchronous. The synchronous model can have real-time constraints which are classified differently: hard and soft. The guarantees provided by real-time sys-tems are known deadlines (timely delivery of events and timely response to events) that need to be respected.
For hard real-time applications, latency is bounded and must be strictly satisfied. However, in soft real-time applications, latency bounds can be exceeded and still have the network in operation.
In an asynchronous system, latency is not bounded. Packet loss
Packet loss may occur due to several reasons, like interference or fading. It has a negative impact on the performance of applications and is defined as a rate between lost packets and total packets sent. Packet loss manifests itself by the loss or re-transmission of data.
These events can be due to a faulty link corrupting or losing packets. Packet loss has negative impacts on the performance of the system. Packet lost becomes more relevant as the requirements for Quality of Service grow more strict. For use cases that require reli-able data transmission, packet loss rate or packet loss mitigations (like error corrections or redundant bytes) are important to be known.
Data Throughput
Data throughput characterises the amount of data that can be, or must be, transferred within a certain time frame, hence being usually expressed as a rate of bits per second (bps). The channel data rate, which is the maximum amount of data that a channel can
Chapter 2. Background work 18
transfer per unit of time, must be larger than the data throughput required by the applica-tion.
2.5.2
Implicit network requirements from application
characteris-tics
In this section the requirements that are defined are size, autonomy, mobility, the geo-graphical scale and the network scalability.
Size
The application size, measured in terms of the number of sensor nodes and sensor data produced by each node, implicitly imposes requirements on the network technology to be used. Based on the application size it may be possible to determine throughput require-ments for the network.
Autonomy
Autonomous or unattended operation of sensor nodes impose constraints on energy con-sumption. Therefore, WSN applications involving autonomous operation impose an im-plicit requirement of energy-efficient networking to maximise the lifetime of energy sources.
Autonomy is coupled to the network usage. It only applies to certain devices in the network. Gateways or coordinator nodes are typically required to be provide continuous service and therefore they are likely externally powered. In terms of end-nodes, autonomy is coupled with the use of the network. These nodes are normally powered by batteries meaning they require an efficiency management of their energy.
Mobility
Some applications require network devices to physically move during operation. This translates to a constant mutation in the network topology and to autonomy requirements, which impose constraints to the networking technologies that may be used. As a result, it might not be possible to ensure at deployment time that all nodes remain within a certain distance of other nodes. Thus, upper bounds for distance must be considered when selecting and configuring a network. Mobility also brings forth the problem of dynamic routing which adds further constraints.
Mobility can be classed in two ways: short range and long range. Long range is defined when the host of the device travels long distances that span outside the cut off distance. This cut off distance is associated with the technology’s gateway transmission coverage which then would mean a transfer in the gateway responsible for the transmis-sion. Since this process is not trivial it needs to be taken into account.
Chapter 2. Background work 19
The speed at which the device moves is not negligible, specially if the use case requires frequent low latency communication.
Geographical scale
WSN applications need to cover a physical area, which may be significantly wide. Know-ing the span of the WSN is fundamental for choosKnow-ing a technology that can provide the required coverage. Depending on the technology, coverage can be solved by using multi-hop or large distance single-multi-hop transmission.
Surrounding environment
Characterises the physical environment surrounding the nodes on the network. It has an effect in the transmission of data. Buildings, interference from other transmitting devices and trees, among many other natural obstacles, influence the reliability of the transmis-sion and hence impose additional requirements on transmistransmis-sion power and transmistransmis-sion distance.
Network scalability
With the rapid growth of inter-connectivity and ubiquitous systems, applications need to have scalability into account.
Scalability requirements of a WSN application express the needs for seamless addition of new nodes without affecting the network operation. If scalability is needed, then this might affect the decision on the technology to be selected.
2.5.3
Implicit network requirements from a management
perspec-tive
Still under the implicit requirements group, there is a subgroup of requirements that differ in the way they are defined. These are requirements defined not by the network designer to answer to technical or deployment (environment) constraints, but by the point of view of a project manager. Homogeneity and cost constitute this subgroup.
Normally cost and homogeneity are viewed as a global metric and not so much with the granularity of point to point communication, hence why cost and homogeneity belong in this group. In terms of cost, when establishing a financial budget for the deployment of a network, what is considered is the overall cost of the network and not each communica-tion hop.
Homogeneity
Homogeneity of a network has impacts on its cost and on interoperability. The inter-operability provided by an homogeneous network allows for simpler maintenance and
Chapter 2. Background work 20
management of the infrastructure. Another positive aspect is that personnel only needs to master that specific technology. Naturally, homogeneity imposes constraints on the technology selection.
Unfortunately homogeneity is sometimes hard to achieve. To overcome this, under-standing what parts of the network are more critical and making that part as homogeneous as possible could help reduce the complexity of the overall network. It could be argued that the level of homogeneity desired is proportional to the complexity of the network. Cost
Many factors can influence cost when choosing a wireless technology for a WSN. The hardware, building and maintaining the infrastructure, training of personnel and service subscription fees, all weight on the final decision. Depending on the context, cost can either be seen as a one-time expenditure or continuous over time.
2.6
Summary
The first section of the chapter dove into the state of the art of Wireless Sensor Networks and the current studies being done on LPWAs, the new category of wireless technolo-gies. It was learned that there are indeed work being done in trying to understand how to design and deploy a WSN network in a more objective and cost efficient way. Despite its novelty, LPWAs are the centre of a large volume of work and studies. They have as objective characterise LPWAs and how their practical use and performance fare against its theoretical models by the use of use case implementations.
Afterwards, LPWA technologies (NB-IoT, Sigfox and LoRaWAN) are introduced and explained in detail. Although they differ in various technical parameters, three common aspects between the three technologies were identified: they are comprised by end-nodes, these end-nodes communicate with a gateway, the gateway communicates with the net-work server (cloud).
Given that LPWAs are considered the main solutions for wireless communication in IoT for the future, it was necessary to know which technologies were there before. A quick overview of ZigBee was given and it was understood that perhaps there are still use cases where ZigBee wins over LPWAs. In the comparison between LPWAs and ZigBee, the difference between the two was noticeable. ZigBee provides larger throughput, less autonomy and coverage and more flexibility in deployment, in contrast, LPWAs have as priority long battery life and large geographical coverage for any deployment environ-ment. Therefore, they have serious limitations in data throughput.
Shifting the focus from the wireless technologies used in a WSN towards the general view of the entire network, the most used requirements that characterise a network are listed. The requirements were divided in two groups, explicit and implicit requirements.
Chapter 2. Background work 21
This distinction stems from the way the requirements are defined. Explicit requirements are specified to the network and implicit requirements are inherent to it. This final section also helps to put in perspective the methodology presented in the next chapter.
Chapter 3
Wireless Technology Selection
Methodology
This chapter will explain the methodology that was created to answer to the problems expressed in Chapter 1. It gives a complete understanding of the methodology.
The structure of this chapter is as follows: Section 3.1 gives the problem definition. Afterwards, Section 3.2 presents an overview of the methodology followed by Section 3.3 which describes the methodology in detail.
3.1
Problem Definition
The problems that the methodology tries to address are:
• The selection a wireless technology for a WSN that can address every application and functional requirement.
• The selection of a wireless technology in every use case. • Remove non-technical influences from the choosing process.
• No standard or automated way of choosing a wireless technology for a WsN. A methodology that could solve all there problems would be ideal but extremely com-plex. In the hopes of simplifying some of the identified problems a few assumption were made before devising the methodology:
• The approximate position where individual devices should be deployed is known. • The technologies to be considered as possible alternatives is limited to those
intro-duced in Section 2.2.
• There is at least one central point in the network (gateway) that is the destination of the data flow. Mesh like topologies are not considered. Mobile devices will also not be considered.
Chapter 3. Wireless Technology Selection Methodology 24
• The methodology may not provide a single final solution, it presents a solution space ranked by the criteria given.
• The methodology is agnostic to the application layer.
3.2
Methodology Overview
The proposed methodology is meant to be used from the application requirements defini-tion up to the deployment phase. The methodology is automated but leaves some leeway for the network designer to choose his preferred solution. The result of the methodology is a solution space where a solution can be chosen from.
3.3
The Methodology
This Section describes the methodology and the steps and procedures that constitute it. It is divided in Sections that define four distinct steps: establishing the vertices, linking the vertices, superposing partial graphs and defining the solution space.
Firstly, in Section 3.3.1, a few basic concepts regarding the methodology are intro-duced. There on, a detailed description of each step is given.
Throughout the Section there will be a recurring example which exemplifies visually the various processes described.
3.3.1
Basic concepts
The methodology utilises a graph to convey the physical network topology. A graph is used because it is the most straightforward way of representing a network.
Taking advantage of using a graph as a way to represent the network, it is possible to the utilise its edges and vertices as holders of requirements that correspond to its physical counterparts.
A vertex in the graph represents an individual node on the network and contains the pertinent information about the requirements imposed by that node. Implicit requirements are stored in the vertices.
Edges, on the other hand, represent the physical links between nodes in the network. They contain the explicit requirements that characterise the communication between those two points on the network as well as the difficulties/obstacles (transmission environment) to data transmission.
The first three steps can be viewed as a graph construction process in which the output is used in the definition of the solution space. After the explanation of these first three steps, Section 3.3.5 takes the raw information produced by the final graph and moulds it in a way that can be easily manipulated to create the solution space.
Chapter 3. Wireless Technology Selection Methodology 25
3.3.2
Establishing the vertices
The first step in building the graph is to add the vertices that represent each physical point on the network. The first set of requirements that are analysed are implicit requirements. These requirements give a superficial, non-technical and general understanding of the network. Translating this to the graph would mean annotating the vertex with information such as: the amount of data sent and received by the node, its surrounding environment, the level of autonomy needed and its purpose in the network (gateway, end node, relay node).
Although this information is still not enough to rule out candidate technologies, it provides a solid foundation to build the remaining graph. Depending on the information given, it could also already hint possible solutions.
The first occurrence of the example is demonstrated in Figure 3.1. Applying the first step of the methodology discussed in this section we end up the following:
S B
A C
Figure 3.1: Graph with annotations
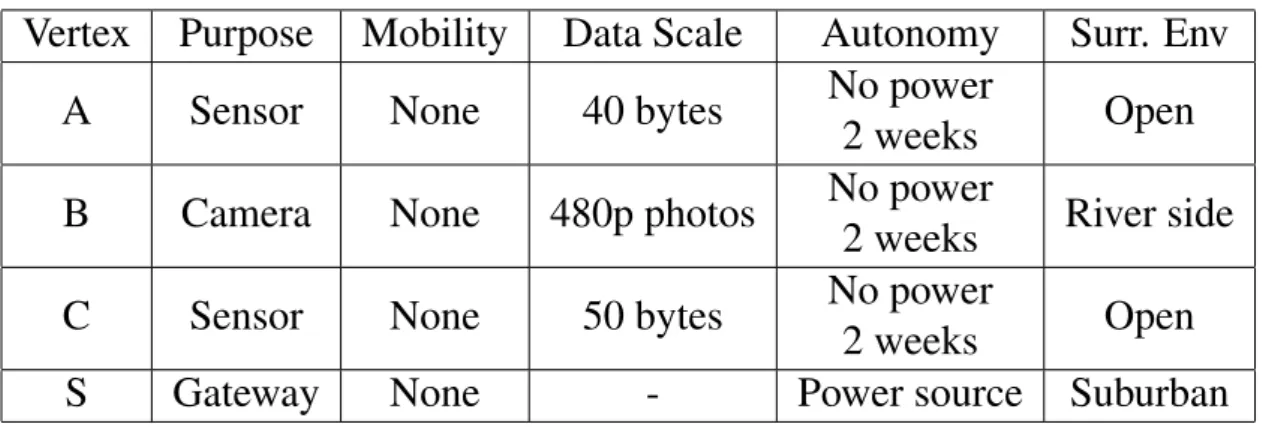
Table 3.1: Annotation of the requirements in each vertex.
Vertex
Purpose
Mobility
Data Scale
Autonomy
Surr. Env
A
Sensor
None
40 bytes
No power
2 weeks
Open
B
Camera
None
480p photos
No power
2 weeks
River side
C
Sensor
None
50 bytes
No power
2 weeks
Open
S
Gateway
None
-
Power source
Suburban
3.3.3
Linking the vertices
The second step consists in establishing edges by connecting the vertices until a sink is reached. The edges need to be annotated with the information regarding the commu-nication between the two vertices that it connects. The edge requirements are imposed
Chapter 3. Wireless Technology Selection Methodology 26
by the vertices’ requirements. Edges hold the maximum expected latency, the minimum throughput required, the maximum accepted packet loss, the physical distance of the link and if there is a line of sight (obstacles).
This process to connect the vertices is described in Algorithm 1: Algorithm 1 Linking Vertices
1: let adjacency list
2: let edge map
3: let paths ← {}
4: procedure LINKVERTICES(array of vertices, adjacency list, paths, edge map)
5: for starting vertex in array of vertices do
6: let starting vertex adj list ← GetAdjacencyListByVertex( starting vertex, adjacency list)
7: let curr path ← {}
8: LinkVerticesAux(starting vertex adj list, curr path, paths, adjacency list, edge map)
9: procedure LINKVERTICESAUX(starting vertex adj list, curr path, paths, adjacency list, edge map)
10: let i ← 0
11: for vertex in starting vertex adj list do
12: let already processed ← CheckEdgeProcessedState( starting vertex adj list[i], vertex, curr path)
13: if already processed then
14: continue
15: let edge ← GetEdgeByVertices(starting vertex adj list[i], vertex)
16: AnnotateEdgeWithRequirments(edge, curr path)
17: let was pruned ← PruneEdge(edge)
18: if was pruned then
19: continue 20: curr path.Append(edge) 21: if vertex.IsGateway() then 22: paths.Append(curr path) 23: return 24: else
25: let starting vertex adj list ← GetAdjacencyListByVertex(vertex, adjacency list)
26: LinkVerticesAux(vertex, curr path, paths, adjacency list)
27: i + +
By holding the information related to the explicit requirements in each edge it is possi-ble to achieve finer granularity, allowing decision making for each particular edge. There-fore, the two nodes that are connected and their respective requirements become more relevant than if we did not have this detailed view of the network.
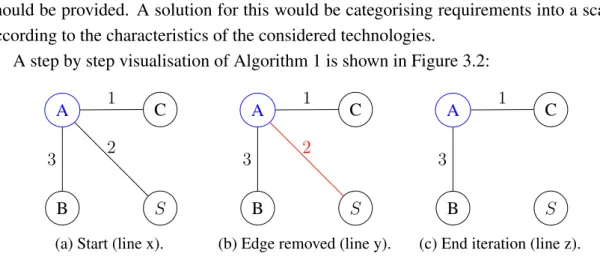
It is important that the information on the vertices and edges be detailed and concrete. If detailed information cannot be given, then at least an estimation of the requirements
Chapter 3. Wireless Technology Selection Methodology 27
should be provided. A solution for this would be categorising requirements into a scale, according to the characteristics of the considered technologies.
A step by step visualisation of Algorithm 1 is shown in Figure 3.2:
S B
A 1 C
2 3
(a) Start (line x).
S B
A 1 C
2
3
(b) Edge removed (line y).
S B
A 1 C
3
(c) End iteration (line z).
Figure 3.2: Demonstration of one iteration of Algorithm 1 for one vertex (line x-z). Not only does this approach allows for micro decision making between two nodes, but it also brings forth the notion of inherited requirements. Inherited requirements shine light on a problem that might go unnoticed and cause problems to the WSN if not caught at this early stage. Figure 3.3 demonstrates the problem encountered when ignoring inheritance.
S B A C 1 2 3
(a) Without requirement inheritance.
S B A C 1 2 3
(b) With requirement inheritance.
Figure 3.3: Visual showcase of the impact requirement inheritance has on the network. Let us consider four vertices: A, B, C and S, and three edges: edge 1 (connecting A to B) and edge 2 (connecting B to S) and edge 3 (connecting C to S). In the case that vertex A requires the transmission of large amounts of data, edge 1 would have to have the requirements necessary to reliably transmit that data. In turn, if both vertices B and C don’t require to transmit as much data, edge 2 and 3 would have weaker requirements than edge 1. Thus, in this case, edge 2 would become a performance bottleneck as well as a link that would weaken the network’s operability in relation to the desired Quality of Service. This is represented in Figure 3.3(a) by colouring edge 2 in red. On the other hand, in Figure 3.3(b), if the requirements present in edge 1 are passed down to edge 2, edge 2 will no longer pose constraints in the operability of the system.
3.3.4
Superposing graphs
The result of the process described in Section 3.3.3 is a set of partial graphs that can either have the same or different paths to the sink.
Chapter 3. Wireless Technology Selection Methodology 28
In the step described in this section, the graphs are superposed into a single layer, thereby creating a single graph.
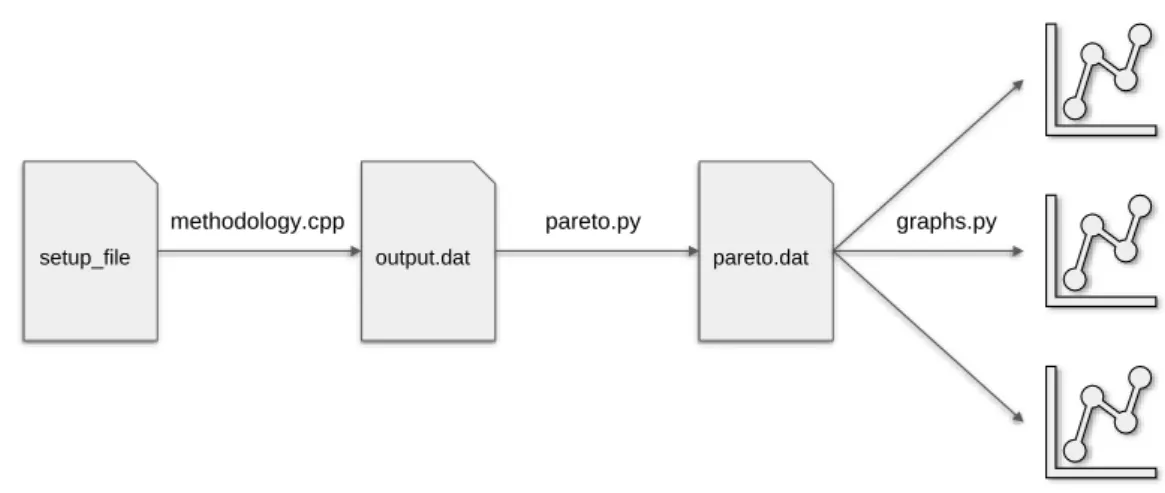
Finally, Figure 3.4 shows a typical graph that has undertaken the building process up until this point. It is the final graph that will be used in Section 3.3.5.
S B A 1 C 2 3 1 1 2
Figure 3.4: Superposition of partial graphs.
3.3.5
Definition of the solution set
After having arrived at the final graph, this section explains the second phase of the methodology. It defines a process to interpret any received graph built using the steps described in Section 3.3.2 to Section 3.3.4 and how to reliably generate a solution space. This stage is composed of two parts: extracting the information from the graph and taking that information and plotting the final solution space to a scatter plot.
Any edge of the superposed graph can have more than one set of requirements depend-ing on the path previous taken. Simultaneously, for each edge there is also at least one or more technologies available. This poses two questions: (1) which set of requirements do we choose to cover? and (2) which technology do we choose for each edge?
These questions are not directly answered but are dependent on the final solution chosen. Before choosing a solution, it is necessary to extract the information stored in the graph and use it to establish the solution space. The first part in the definition of the solution space is as follows:
1. Pick a vertex not previously chosen;
2. Pick an outwards edge from the previously chosen vertex;
3. Of the available set of requirements, pick one not previously picked; 4. Of the available set of technologies, pick one not previously picked;
![Figure 2.1: Overview of the Sigfox architecture.[1]](https://thumb-eu.123doks.com/thumbv2/123dok_br/19220789.962627/25.892.136.762.678.1040/figure-overview-of-the-sigfox-architecture.webp)
![Figure 2.2: Overview of LoRaWAN’s layers.[2]](https://thumb-eu.123doks.com/thumbv2/123dok_br/19220789.962627/27.892.129.768.99.472/figure-overview-of-lorawan-s-layers.webp)
![Figure 2.3: High level overview of the LoRaWAN architecture.[2]](https://thumb-eu.123doks.com/thumbv2/123dok_br/19220789.962627/28.892.160.682.308.576/figure-high-level-overview-lorawan-architecture.webp)