A
SSESSMENT OF
H
EALTH
P
ERCEPTION
P
REDICTORS
:
A
N
A
PPLICATION OF
G
ROSSMAN
’
S
M
ODEL TO THE
P
ORTUGUESE
P
OPULATION
by
ANTÓNIO MIGUEL TEIXEIRA MARQUES PINTO
M
ASTERT
HESIS INH
EALTHC
AREE
CONOMICS ANDM
ANAGEMENTADVISER:
Á
LVAROF
ERNANDOS
ANTOSA
LMEIDA, Ph.D.
ASSESSMENT OF HEALTH PERCEPTION PREDICTORS:AN APPLICATION OF GROSSMAN’S MODEL TO THE PORTUGUESE POPULATION
B
RIEF
B
IOGRAPHICAL
I
NFORMATION
The candidate graduated in Medicine (MD, Integrated Master of Medicine) in the Faculty of Medicine of the University of Porto (FMUP) in July 2012. During the course he was selected among many candidates to attended two extracurricular Professional Exchange Programs from IFMSA (International Federation of Medical Students’ Association) during the months of August of 2010 and 2011, respectively at the Neurosurgery Department of Faculty Hospital Academy Ladislava Dérera in Bratislava (Slovakia) and at the General Surgery Department of Vilnius University Hospital Santariškių Klinikos in Vilnius (Lithuania).
In September 2012, the candidate entered the Master of Health Care Economics and Management in the School of Economics and Management of the University of Porto (FEP).
He started his medical residency in Hospital São João in 2013.
In that same year, he was elected President of Portuguese Young Doctors’ Association (AJOMED – Associação dos Jovens Médicos) and Vice-President of EEHYC (European Environment and Health Youth Coalition).
António Marques Pinto is also General Council Member of the Portuguese Medical Mutuality Union (União Médica Mutualista) and Member of the Commission for Ecology and Health Promotion of SRNOM (North Regional Section of Portuguese Medical Association – Ordem dos Médicos).
The author also owns two post-graduate courses, one in Travel Medicine and Mobile Populations and other in Geriatrics.
ASSESSMENT OF HEALTH PERCEPTION PREDICTORS:AN APPLICATION OF GROSSMAN’S MODEL TO THE PORTUGUESE POPULATION
A
CKNOWLEDGMENTS
I would like to express my special appreciation and thanks to my advisor Professor Doutor Álvaro Santos Almeida, who has been a tremendous mentor and great inspiration for me. I want to thank him for encouraging my research and for allowing me to grow academically. His wise guidance and advice on my investigation as well as on my career have been priceless.
I am also grateful to Professor Doutor Henrique Barros for his good comments and suggestions as well as providing data, information and assistance.
ASSESSMENT OF HEALTH PERCEPTION PREDICTORS:AN APPLICATION OF GROSSMAN’S MODEL TO THE PORTUGUESE POPULATION
ASSESSMENT OF HEALTH PERCEPTION PREDICTORS:AN APPLICATION OF GROSSMAN’S MODEL TO THE PORTUGUESE POPULATION
A
BSTRACT
Although Portugal has faced large gains in terms of health during the last half century, due to the presence of diminishing marginal returns the health production is reaching a situation in which is necessary to expend a considerable amount of resources to obtain small increments in terms of health, from a population perspective. The purpose of this study is to estimate a health production function for adult Portuguese population, evidencing the impact of biological, socioeconomic and medical care factors on the health status. Using data collected from the EPIPorto project, a population-based study in progress for about 15 years, consisting in a cohort of adults living in a large urban center in the north-west of Portugal, we try to determine the most efficient way of allocating limited resources for improving the overall health status. As indicator of health output, we use self-reported general health, more specifically, the variable GHP (General Health Perceptions) derived from the SF-36, a multi-purpose, short-form health survey designed for health policy evaluations, clinical practice and research. Our results indicate some statistically significant variables as significant estimators of health perception, with particular emphasis on age and daily sleeping hours whose increase is associated with lower health perception. We also found significant correlations between health perception and the individuals’ occupation, marital status, alcohol intake, physical activity and the type of medical facility they usually attended. These findings provide a more refined picture which allows a better understanding of the factors that affect the health condition of Portuguese individuals, representing a possible starting point in developing worthwhile health policies, directed toward improving the health status. Moreover, future research on the topic should review the particularities of this specific population.
K
EYWORDS
:
Grossman’s model, Health Production, Health Status, Human capital
JEL
C
LASSIFICATION
:
ASSESSMENT OF HEALTH PERCEPTION PREDICTORS:AN APPLICATION OF GROSSMAN’S MODEL TO THE PORTUGUESE POPULATION
R
ESUMO
Embora em Portugal se tenham verificado grandes ganhos em termos de saúde durante o último meio século, devido à presença de rendimentos marginais decrescentes a produção de saúde está a atingir uma situação em que é necessário gastar uma quantidade considerável de recursos para obter pequenos incrementos em termos de saúde, numa perspectiva populacional. O objetivo deste estudo é estimar uma função de produção de saúde para população adulta Portuguesa, evidenciando o impacto dos fatores biológicos, socioeconómicos e de cuidados médicos sobre o estado de saúde. Usando dados coletados do projeto EPIPorto, um estudo de base populacional em curso há cerca de 15 anos, que consiste numa coorte de adultos que vivem num grande centro urbano do noroeste de Portugal, tentamos determinar a forma mais eficiente de alocar recursos limitados para a melhoria do estado geral de saúde. Como proxy do estado de saúde, usamos a saúde geral auto-reportada, mais especificamente, a variável GHP (Percepções sobre a Saúde Geral) derivada do SF-36, um breve questionário de saúde multi-propósito, concebido para avaliações de políticas de saúde, prática clínica e investigação. Os nossos resultados indicam algumas variáveis como estimadores significativos de percepção de saúde, com especial ênfase para a idade e horas de sono diárias cujo aumento está associado a uma menor percepção de saúde. Foram também obtidas correlações significativas entre a percepção de saúde e a ocupação dos indivíduos, estado civil, consumo de álcool, atividade física e infraestrura de cuidados de saúde a que recorrem. Estes achados fornecem uma imagem mais refinada que permite uma melhor compreensão dos fatores que afetam o estado de saúde de indivíduos portugueses, representando um possível ponto de partida para o desenvolvimento de políticas de saúde compensatórias, direccionadas para a melhoria do estado de saúde. Investigação futura sobre o tema deve analisar as particularidades desta população específica.
P
ALAVRAS
-C
HAVE
:
Estado de Saúde, Capital Humano, Modelo de Grossman, Produção de Saúde
C
LASSIFICAÇÃO
JEL:
ASSESSMENT OF HEALTH PERCEPTION PREDICTORS:AN APPLICATION OF GROSSMAN’S MODEL TO THE PORTUGUESE POPULATION
T
ABLE OF
C
ONTENTS
Brief Biographical Information ... II Acknowledgments ... III Abstract ... V Keywords ... V JEL Classification ... V Resumo... VI Palavras-Chave ... VI Classificação JEL ... VI Table of Contents ... VII Index of Equations ... IX Index of Figures ... X Index of Tables ... XI Acronyms and Abbreviations ... XII
1. Introduction ... 1
2. Literature review ... 4
2.1 Introduction ... 4
2.2 Human Capital and Grossman’s Model ... 8
2.3 Estimation Methodology ... 18
2.4 Empirical Evidence on the Production of Health in USA and Europe... 20
2.5 Portuguese Scenario ... 27
3. Methodology ... 32
3.1 Research Question ... 32
3.2 Variables and the Data ... 33
3.3 Estimation Method ... 41
3.4 Statistical Analysis ... 44
4. Results ... 45
4.1 Sample Characteristics ... 45
4.2 Evolution of the Sample ... 51
4.3 Multiple Linear Regression Analysis ... 54
4.3.1 GHP Predictors of the 1st Evaluation ... 54
4.3.2 GHP Predictors of the 2nd Evaluation ... 57
ASSESSMENT OF HEALTH PERCEPTION PREDICTORS:AN APPLICATION OF GROSSMAN’S MODEL TO THE PORTUGUESE POPULATION
4.4 Discussion ... 61
5. Summary, Conclusion and Future Perspectives ... 74
6. Bibliography ... 76
7. Annexes ... 94
A. 36-Item Short Form Health Survey ... 94
B. Descriptive Statistics SPSS Output ... 100
C. Inferential statistics: Student´s t-Distribution SPSS Output... 107
C1. Completed years of Schooling Correlations and Test ... 107
C2. Working Hours Correlations and Test ... 107
C3. Alcohol Intake Amount Correlations and Test ... 108
C4. Cigarette consumption Correlations and Test ... 108
C5. Sleeping hours Correlations and Test... 109
C6. Total Physical Activity Correlations and Test ... 109
C7. Heath Perception Correlations and Test ... 110
D. Inferential statistics: Multiple Linear Regression SPSS Output ... 111
D1. Regression for Full sample from the 1st Eval. (Dep. Var. - GHP) ... 111
D2. Regression for < 36 years sample, from the 1st Eval. (Dep. Var. - GHP) ... 117
D3. Regression for 36 - 55 years sample, from the 1st Eval. (Dep. Var. - GHP) ... 122
D4. Regression for > 55 years sample, from the 1st Eval. (Dep. Var. - GHP) ... 127
D5. Regression for Full sample from the 2nd Eval. (Dep. Var. - GHP) ... 130
D6. Regression for 36 - 55 years sample, from the 2nd Eval. (Dep. Var. – GHP) .... 133
D7. Regression for > 55 years sample, from the 2nd Eval. (Dep. Var. - GHP) ... 141
D8. Regression for Full sample from the1st Eval. (Dep. Var. - s) ... 144
D9. Regression for < 36 years sample, from the 1st Eval. (Dep. Var. - s) ... 150
D10. Regression for 36 - 55 years sample, from the 1st Eval. (Dep. Var. - s) ... 155
D11. Regression for > 55 years sample, from the 1st Eval. (Dep. Var. - s) ... 161
D12. Regression for Full sample from the 2nd Eval. (Dep. Var. - s) ... 168
D13. Regression for 36 - 55 years sample, from the 2nd Eval. (Dep. Var. – s) ... 171
D14. Regression for > 55 years sample, from the 2nd Eval. (Dep. Var. - s) ... 174
D15. Regression for Full sample for the Difference between Eval. (GHPδ) ... 177
ASSESSMENT OF HEALTH PERCEPTION PREDICTORS:AN APPLICATION OF GROSSMAN’S MODEL TO THE PORTUGUESE POPULATION
I
NDEX OF
E
QUATIONS
(2. 1) ... 11 (2. 2) ... 12 (2. 3) ... 12 (2. 4) ... 13 (2. 5) ... 13 (2. 6) ... 13 (2. 7) ... 18 (2. 8) ... 18 (2. 9) ... 18 (2. 10) ... 19 (3. 1) ... 36 (3. 2) ... 41 (3. 3) ... 41 (3. 4) ... 41 (3. 5) ... 41 (3. 6) ... 42 (3. 7) ... 42 (3. 8) ... 43 (3. 9) ... 43ASSESSMENT OF HEALTH PERCEPTION PREDICTORS:AN APPLICATION OF GROSSMAN’S MODEL TO THE PORTUGUESE POPULATION
I
NDEX OF
F
IGURES
Figure 1 – Total Utility Curve for Health. ... 12
Figure 2 – Demand for Health Capital. ... 14
Figure 3 – Effect of Technological Change on Total Product Curve for Medical Care. ... 24
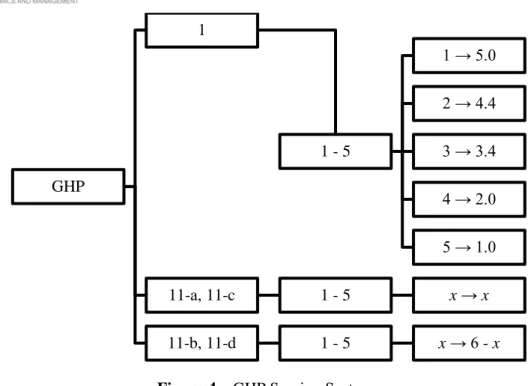
Figure 4 – GHP Scoring System. ... 36
Figure 5 – Sample Distribution by Gender. ... 45
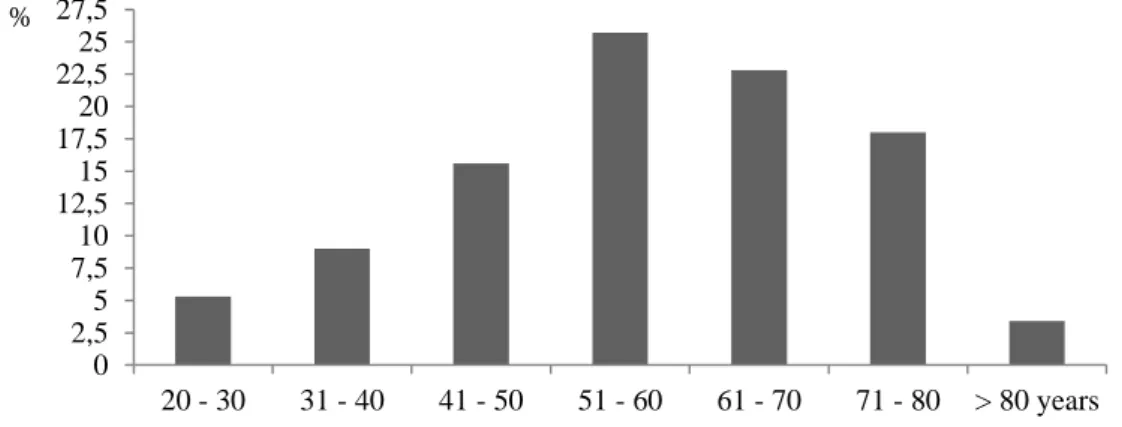
Figure 6 – Sample Distribution by Age Groups. ... 45
Figure 7 – Sample Distribution by Marital Status... 46
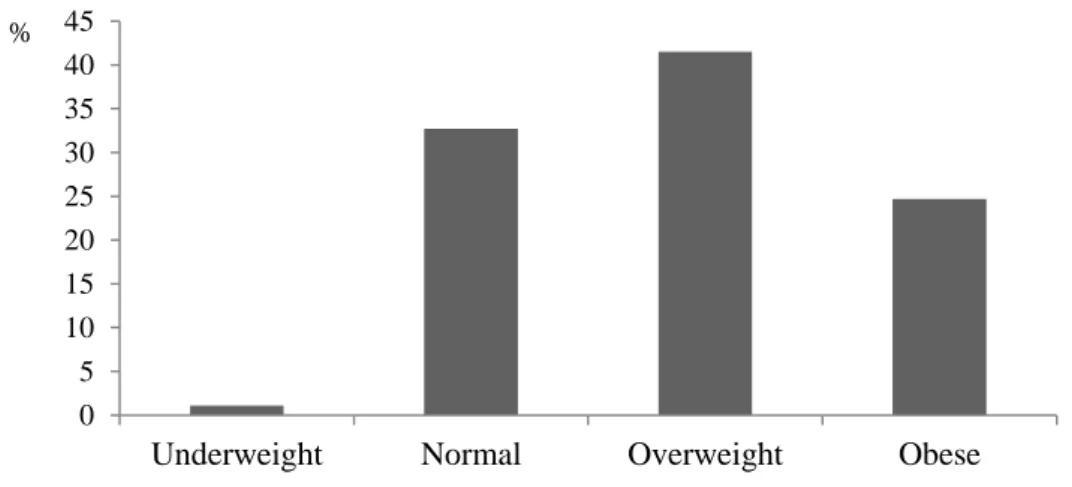
Figure 8 – Sample Distribution by BMI. ... 47
ASSESSMENT OF HEALTH PERCEPTION PREDICTORS:AN APPLICATION OF GROSSMAN’S MODEL TO THE PORTUGUESE POPULATION
I
NDEX OF
T
ABLES
Table 1 – Summary description of the predictors ... 39
Table 2 – Schooling ... 46
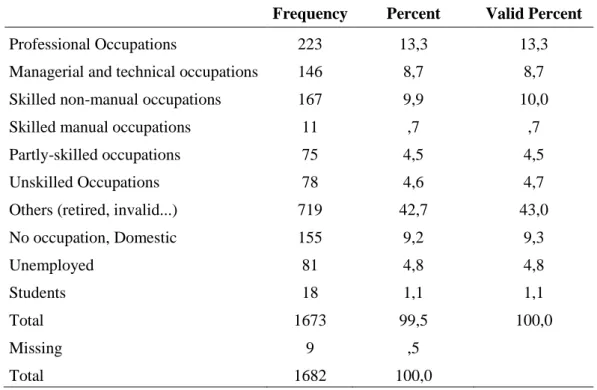
Table 3 – Occupation ... 46
Table 4 – Weekly Working Hours ... 47
Table 5 – Physical activity at work ... 47
Table 6 – Housework ... 48
Table 7 – Physical Activity ... 48
Table 8 – Alcohol Consumption ... 48
Table 9 – Alcohol Intake Amount ... 49
Table 10 – Smoking Habits ... 49
Table 11 – Cigarette Consumption ... 49
Table 12 – Sleeping ... 49
Table 13 – Illness requiring regular medical care ... 50
Table 14 – Medical Facilities Usually Attended ... 50
Table 15 – Health Perception ... 50
Table 16 – Significance of Differences: Education ... 51
Table 17 – Significance of Differences: Working Hours ... 51
Table 18 – Significance of Differences: Alcohol ... 52
Table 19 – Significance of Differences: Smoking ... 52
Table 20 – Significance of Differences: Sleeping ... 52
Table 21 – Significance of Differences: Physical Activity ... 53
Table 22 – Significance of Differences: Health ... 53
Table 23 – Stepwise Regression for Full sample from the1st Evaluation ... 54
Table 24 – Stepwise Regression for < 36 years sample, from the1st Evaluation ... 55
Table 25 – Stepwise Regression for 36 - 55 years sample, from the 1st Evaluation ... 56
Table 26 – Stepwise Regression for > 55 years sample, from the 1st Evaluation ... 57
Table 27 – Stepwise Regression for Full sample from the 2nd Evaluation ... 58
Table 28 – Stepwise Regression for 36 - 55 years sample, from the 2nd Evaluation ... 59
Table 29 – Stepwise Regression for > 55 years sample, from the 2nd Evaluation ... 60
ASSESSMENT OF HEALTH PERCEPTION PREDICTORS:AN APPLICATION OF GROSSMAN’S MODEL TO THE PORTUGUESE POPULATION
A
CRONYMS AND
A
BBREVIATIONS
ACSS Healthcare System Central Administration, “Administração Central do Sistema de Saúde” BMI Body Mass Index
CSDH Commission on Social Determinants of Health DEA Data Development Analysis
DEPS Department of Studies and Planning in Health EAP European Action Plan
EPHOs Essential Public Health Operations
EPEPP Profile of the Aging of the Portuguese Population,
“Estudo do Perfil de Envelhecimento da População Portuguesa” FMO Financial Mechanism Office
GHP General Health Perceptions GIS Geographic Information System HRQL Health Related Quality of Life INE National Institute of Statistics INS National Health Survey,
“Inquérito Nacional de Saúde”
INSA National Institute of Health Dr. Ricardo Jorge “Instituto Nacional de Saúde Dr. Ricardo Jorge” LBS Basic Law on Health,
“Lei de Bases da Saúde”
MBHC Marginal Benefits of Health Capital MCHC Marginal Cost of Health Capital MET Metabolic Equivalent
MLRM Multiple Linear Regression Model MOS Medical Outcomes Study
NCHS National Center for Health Statistics
OECD Organization for Economic Cooperation and Development SF-36 36-Item Short Form Health Survey
SNS National Health Service “Serviço Nacional de Saúde”
SPSS Statistical Package for the Social Sciences TPC Total Product Curve
USA United States of America VIF Variance Inflation Factor WHO World Health Organization
ASSESSMENT OF HEALTH PERCEPTION PREDICTORS:AN APPLICATION OF GROSSMAN’S MODEL TO THE PORTUGUESE POPULATION
1. I
NTRODUCTION
Over time there has been an effort to identify causes of health phenomena’s, following mainly two lines: one of them concerns the way of thinking and the fundamentals required to infer causality (way of conceptualizing causes), the other have to do with the type of evidence from the "reality" that is used as one of the formal foundations of the causal judgment. Although their different nature justifies their separate mention, these two aspects have evolved in parallel with an intricate dynamic. In this sense, health economists have long been interested in the impact of a several amount of factors on health outcomes. Health determinants are diverse in nature and can be categorized in many different ways. A relatively large number of studies have examined the marginal contribution of selected environmental, socioeconomic, behavioural, and medical inputs on various measures of health outcomes using the individual as the unit of analysis.1 To investigate these relationships, empirical studies have adopted a health production function analytical framework, where health is viewed as an output that is produced by a set of inputs. The major advantages of estimating an aggregate health production function is that estimates of the over-all effect of medical care utilization on the health status of the population can be obtained. This information can help policy makers and practitioners in their search for cost effective mechanisms for providing health services and the reallocation of health resources in such a way that the gains from health spending could be optimized.
In line with this, using the words spoken in Beijing (China) by Dr. Margaret Chan, the Director-General of World Health Organization (WHO), during the launch of the World Health Report 2013: Research for universal health coverage, although “…health depends on having access to medical services and a means of paying for these services, it is also strongly shaped by a wide range of social and environmental determinants”, and so, “the research agenda for universal coverage, especially with preventive services, must address these determinants as well.” The WHO head calls for “closer collaboration between researchers and policy-makers, who tend to work in
1 For instance, Kirch (2008) suggests 4 categories: demographic and social (cultural, political, gender,
socio-economic factors and community capacity), physical environment (living and working), individual dimensions (genetic legacy and behaviors) and access to healthcare.
ASSESSMENT OF HEALTH PERCEPTION PREDICTORS:AN APPLICATION OF GROSSMAN’S MODEL TO THE PORTUGUESE POPULATION
parallel, with too little understanding of each other’s priorities and methods”, because “…while some research has broad application, many problems need “local solutions investigated through local research”. Therefore, it is our intent with this study, to answer this appeal by exploring the situation for Portugal.
Over the last years, Portuguese health indicators improved a lot. For example, Portugal has been classified as one of the top five countries in the world that have made remarkable progress in reducing mortality rates.2 Better access to an expanding health care network, thanks to continued political commitment, and economic growth, made it possible to invest large amounts in the health care sector.3 The enhancement of Portuguese population health status can be partly explained by increases in human, material and financial resources devoted to health care (more recently due to the evolution of the primary and long-term care networks, additionally to the recent enforcement of the National Health Plan), as well as to a general improvement in socioeconomic conditions.4 Anyway, despite the overall improvement in living standards and the enlargement and enrichment of the health concept inherent to the paradigm of an informed society, deep knowledge gaps still exist with regard to the health status of the population.
This work aims to estimate a health production function for Portuguese population on the ground of Grossman’s theoretical model. The model treats biological, socioeconomic, and medical care factors as inputs of the production system. Several modifications are made to generalize and improve the analysis, specifically the incorporation of additional health related factors. From the health production perspective, it attempts to quantify the effect of individual health input consumption on a health measure, in this case health perception. Moreover, this paper will bring up evidence on the combined impact of health and several policies.
2
The others are Chile, Malaysia, Thailand and Oman (WHO and ACS, 2008).
3 There are inequalities among regions and between social classes. These disparities are evident in the
variation of some health indicators.
4 In Europe and USA (United States of America), life expectancy at birth increased almost 50 years
between XVIII and first half of XX centuries, more than 90 % of this improvement occurred before the discovery of the first antibiotic (1928), which leads to the conclusion that it is not only the technological or pharmaceutical advances but also health policies and social conditions that make a difference to greater survival in the world (Marques-Pinto, 2013).
ASSESSMENT OF HEALTH PERCEPTION PREDICTORS:AN APPLICATION OF GROSSMAN’S MODEL TO THE PORTUGUESE POPULATION
In that sense we will use information based on the data collected from the EPIPorto project, which is a Portuguese population-based study in progress for about 15 years, consisting in a cohort of adults living in a large urban center in the north-west of the country.
The thesis is organized as follows. In section 2 the problem is contextualised by presenting a literature review of the subject updating the earlier research on this matter. Section 3 describes data and the econometric methodology to be followed in the estimation process. Section 4 presents the results of the descriptive analysis and of the econometric model, and is dedicated to the interpretation of the main findings and limitations of the study. In section 5, a summary and the main conclusions of the thesis are presented as well as future perspectives.
ASSESSMENT OF HEALTH PERCEPTION PREDICTORS:AN APPLICATION OF GROSSMAN’S MODEL TO THE PORTUGUESE POPULATION
2. L
ITERATURE REVIEW
2.1 I
NTRODUCTIONThe most widespread definition of "Health" will certainly be found in the preamble of the WHO Constitution in 19485: "a state of complete physical, mental and social well-being and not merely the absence of disease or disability." Besides this definition being useful as a broad working model it has frequently been criticised as utopian (Seedhouse, 2001). Health has legal, social and economic implications of the states of health and disease. In this sense, health is a resource for performance and a dimension of quality of life. In turn, the quality of life is a holistic concept that brings together all the resources (social, individual and physical) that the individual requires for the achievement of his goals and aspirations and to meet his needs at different levels.6
Nevertheless, according to the CSDH (Commission on Social Determinants of Health) most health research (funding) remains overwhelmingly biomedically focused, whereas the largest health improvements arguably come from improvements in the social determinants of health.7 Understanding health and the effectiveness of interventions requires a rich evidence base that includes both qualitative and quantitative data which needs to be judged on fitness for purpose rather than on the basis of strict traditional hierarchies of evidence (CSDH, 2008).
The occidental concept of disease and the English language include three terms, disease, illness, sickness, and three different realities interact with each other: the biophysical, psychological and social reality. These realities are expressed through different dimensions, ie "having a disease", "feeling sick" and "behave like sick", respectively. Illness and sickness, unlike disease, are not necessarily detected by biochemical indicators, and that is why some investigators view health and ill heath as a
5 Preamble to the Constitution of the WHO as adopted by the International Health Conference, New
York, 19-22 June 1946; signed on 22 July 1946 by the representatives of 61 States (Official Records of the World Health Organization, no. 2, p. 100) and entered into force on 7 April 1948 (Grad, 2002).
6
For a more comprehensive and critical overview of relevant sociological and psychological perspectives on health, and therefore increase awareness of the richness of approaches to research on health and disease please check the work published by Jones (1994), Cockerham (1995) and Stoebe (2000).
ASSESSMENT OF HEALTH PERCEPTION PREDICTORS:AN APPLICATION OF GROSSMAN’S MODEL TO THE PORTUGUESE POPULATION
continuum along which individuals progress and regress (Ogden, 1996). Moreover, since the concept of "Disease" is culturally built, it is based on values that differ widely between individuals, which partly explain the difficulty of communication among interlocutors who often have not the same cultural background, conceptions, ethnotheories on health, practices and behaviours.8 There are many examples from qualitative interview and quantitative survey research in economics, anthropology, psychology and sociology that illustrate cultural variations in relation to definitions and perceptions of, and actions towards, health and illness (Wolff and Langley, 1977; Zola, 1966). Therefore, a number of contextual factors such as the demographic situation and economic and social development affect the health of individuals and consequently the demand and supply for health (Ramos, 2004).
Theoretical perspectives have had a clear influence on the development of measurement strategies in relation to health status, HRQL (Health Related Quality of Life) and socio-demographic characteristics scales (de Bruin et al., 2000). Much of the research in this field has been quantitative, and based on structured survey techniques. However, it shows a great deal of inconsistency between different health behaviours and between attitudes and behaviour (Bowling, 2009).
Models of behaviour and behaviour change, in relation to literature on production of health, also need consideration. The most relevant ones are those which not only focus on intention and motivations to behave, self-efficacy, perceived control, and the timeliness of cues to the behaviour, but include de individual’s level of information, perceived skills for the behaviour, positive affect towards it, consistency of the behaviour with self-image, and environment and societal barriers, including the role of social support and pressure (Elder et al., 1999).
The famous article "Uncertainty and the welfare economics of medical care”, published by Kenneth Arrow in 1963 in the American Economic Review, conceptualizes for the first time, the distinct nature of the health sector. From that moment researchers started applying economics to issues, problems and phenomenas of
8 Concerning sociological research on health, sociologists are divided into those who focus on developing
a theoretical, academic discipline, and those who focus on applied research and analysis aiming to contribute to contemporary issues on health. See Straus (1957) and Jefferys (1996).
ASSESSMENT OF HEALTH PERCEPTION PREDICTORS:AN APPLICATION OF GROSSMAN’S MODEL TO THE PORTUGUESE POPULATION
health. Currently there are several models that adopt a multifactor and interactive approach to health and disease.
Economic models of behaviour and econometric techniques are used to explain changes (or their absence) in the behaviour of different groups. Through these models, health economics plays an important role in refining policies of health promotion and improve the targeting to certain groups of individuals. According to Newhouse (1998), economic research on health behaviours has increased considerably in the last couple of decades. In fact, 50 % of USA health economists surveyed in 2005 reported studying “the behaviour of individuals” (Morrisey and Cawley, 2008).
For a health economist, the individual is the obvious unit of study when they intend to analyse decisions concerning the individual’s health and health-related behaviours, which is consistent with the individualist paradigm usually applied to economic theory. Although health-related behaviours do not fully explain the amount of health produced, is certainly true that the individual faces a wide range of possibilities that influence his health (Bolin, 2011).
In addition to the influence that the individual has over his own health, health is also given by:
a) Individual’s genetics;
b) Decisions made by others, over which the individual may or may not have influence;
c) Other variables entirely exogenous (for example, the environment in which the individual belongs).
Economics generally assumes that people are rational and forward looking. Activities that have long-term consequences are typically considered as investments. Therefore, improvements in health may increase the output not only through labour productivity, but also through the accumulation of capital.9
9 A fully specified model of economic growth would be multidimensional, showing not only how inputs
and technology affect output, but also how the growth rates of inputs and their productivity are themselves determined (Bloom, Canning, Sevilla, 2004).
ASSESSMENT OF HEALTH PERCEPTION PREDICTORS:AN APPLICATION OF GROSSMAN’S MODEL TO THE PORTUGUESE POPULATION
The economic-theoretical framework for the reflection about human capital investment activities includes a wide range of behaviours. In this sense, the theory of human capital is an essential starting point.
ASSESSMENT OF HEALTH PERCEPTION PREDICTORS:AN APPLICATION OF GROSSMAN’S MODEL TO THE PORTUGUESE POPULATION
2.2 H
UMANC
APITAL ANDG
ROSSMAN’
SM
ODELSeveral theoretical models try to explain the demand for health, highlighting mainly the behavioural model of Andersen (1968) and the economic models of Grossman (1972) and Zweifel (1981). More targeted to the individual's behaviour, the Andersen model seeks to explain the reasons behind the use of health services, while the models of Grossman, based on traditional consumer theory, and Zweifel, based on principal-agent theory, look at demand for health. In fact, one of the most important aspects introduced by the economic analysis was the distinction between “demand for health” and “demand for health care” by each individual.
When it was published in 1972 in the Journal of Political Economy, Michael Grossman’s Model was a huge breakthrough in the field of health economics. The "demand for health" does not fall directly on the traditional theory of demand, where each consumer has a utility or preference function that allows him to choose between different combinations of goods and services in the market in order to maximize that function, since by searching those services the individual does not seek the service itself, but better health. The “demand for health” approach made by Grossman relies heavily on the theory of Human Capital that emerged in the late 50s, early 60s of the twentieth century, through works carried out mainly by a group of neo-classical economists from the Chicago school, including, among others, Edward Denison, Jacob Mincer, Milton Friedman, Theodore Schultz and Gary Becker. The latter published in 1964, "Human Capital: A Theoretical and Empirical Analysis, with special reference to Education", a reference work in studies about investments in employee training where the discussion is expanded with the development of the analysis on the family economy using the human capital theory as the basis of the research program (Becker, 1964).
Just after presenting the concept, studies on human capital spread rapidly, which reflected in an extraordinary impact on economic literature and educational policy action which led to its incorporation in educational expansion programs in the 60s, carried out in most OECD (Organization for Economic Cooperation and Development) countries (Cohen and Soto, 2007).
ASSESSMENT OF HEALTH PERCEPTION PREDICTORS:AN APPLICATION OF GROSSMAN’S MODEL TO THE PORTUGUESE POPULATION
According to the Human Capital Theory, increases in personal stock of knowledge or human capital, increase the individuals productivity in the market sector of the economy, where he produces monetary gains, and "non-market" sector, where the individual produces goods entering in its utility function. In this line, the theory rests on two assumptions: 1st - The human capital is something produced, ie, something that is the product of deliberate investment decisions in education or training; 2nd - The individuals are holders of certain personal characteristics (some of them partly innate as intellectual skills, and others that are acquired throughout life, such as formal and informal education, training and experience), which contribute to increase their productivity. Thus, we can define the Human Capital as the set of skills and knowledge of individuals that together with other personal characteristics and effort, increases the possibilities of producing personal, social and economic well-being. This definition encompasses the level of schooling and training (level of formal and informal education), investments in health as well as the existence of a set of infrastructure for education, training and research.
Although there were already references to the health-capital as a component of the stock of human capital, Grossman was the first to build a model of demand solely for health with the justification that the health-capital doesn´t exert a direct relationship with the wages, but the difference compared to other elements of human capital is in the fact that the stock of health determines the total amount of time that the individual can use to produce gains of capital and goods.10 Thus, the innovative elements introduced by Grossman which still linger today, were, first, treating health as a stock, analogous to the stock of human capital, secondly, to consider health as a joint production process requiring either the individuals contribution (particularly through the use of time), either the consumption of appropriate goods and services, called healthcare. In this line, the individual inherits an initial stock of health capital that depreciates over time, but can be increased with acts of investment, that can be all types of health-promoting behaviours (consumption of health care, healthy eating, etc.) or decreased through unhealthy behaviours, which leads the rate of depreciation to defer from person to person.
10 Although Mushkin (1962) did not present a formal model of health behaviour, he was the first to
describe health as an economic good, considering health a human capital stock yielding both investment and consumption benefits (Amaya M. I., 2000).
ASSESSMENT OF HEALTH PERCEPTION PREDICTORS:AN APPLICATION OF GROSSMAN’S MODEL TO THE PORTUGUESE POPULATION
Thereby, the model advocates health as a consumption good (goes directly into individuals the preference function) and investment (Wagstaff, 1986).
It is necessary to take into consideration that one of the essential production factors is the time dedicated by the individual to the production of health. Healthcare constitutes also as a productive factor, since it is acquired with the purpose of producing health.11 People produce health by combining market goods and services with time, consistent with Becker’s model of household production (Becker, 1976).
Individuals allocate time and money to maximize the present discounted value of lifetime utility. Indirectly, length of life is a choice in the original model which contains no uncertainty, generating some criticism among some of the health economists’ community (Cropper M.L., 1977). In fact, Grossman’s model neglects the uncertainty by defining the depreciation rate deterministically, in which no stochastic shock can affect the health of the individual, and therefore each one exerts complete control over his own health (Cawley and Ruhm, 2011). In agreement with this, individuals just allocate time and money to maximize the present discounted value of lifetime utility.12
Brian Greene once said that “Exploring the unknown requires tolerating uncertainty”. In economics particularly, health economic decision models are subject to considerable uncertainty which is rarely accounted formally (Jackson et al., 2009). In fact, few papers introduced uncertainty into the Grossman’s model in spite of its importance. Although, for example, Dardanoni and Wagstaff (1987), Selden (1993), or Chang (1996) introduced uncertainty into the Grossman’s model, their studies treated only one or two period model. Avoiding technical-modeling difficulties, Liljas (1998) was perhaps the first to assume that the health stock at each point in time is given as the
11 However, we should not rule out the possibility that poor health status might be created by additional
medical services. Iatrogenesis is an adverse condition induced in a patient through the effects of treatment by a health professional. It can arise in many ways: through clinical errors of diagnosis or treatment, through medical negligence, through environmental effects as in nosocomial infection, through the careless or deliberate flouting of best practice guidelines. To address these unsatisfactory situations many countries have conducted several reforms in iatrogenic death investigations during the last years (Leflar, 2009).
12 The time of death results from conscious decisions regarding health investments made with full
knowledge of their implications for longevity. However, at high ages, the depreciation rate of health capital may become so large that the individual is unable to afford sufficient flows to stay alive. The general biological deterioration is reflected by the significant increase of the incidence of various diseases at 65 and by the general deterioration of physical robustness during old age, which leads to a retrenchment of the of socioeconomic factors impact on health and mortality (Kiuila and Mieszkowski, 2007).
ASSESSMENT OF HEALTH PERCEPTION PREDICTORS:AN APPLICATION OF GROSSMAN’S MODEL TO THE PORTUGUESE POPULATION
realization from a probability distribution, deviating from the fundamental notion of the demand for health model illness perception in which changes in health are realized through gross investments and depreciation. Consequently, by assuming that health-related uncertainty operates directly on the health stock13, it was possible to avoid the difficulty that would be faced if Grossman’s notion of uncertainty was followed instead (Bolin, 2011; Liljas, 1998; Tabata and Ohkusa, 2000).
The original demand-for-health model comprises two types of human capital: health (H) and educational (E), being health determined within the model (endogenous) whereas education stock is taken as given (exogenous).14 The concept of utility (U) is also very important to fully understand the model, as it is essential to all economic theories which are built on individual choices.15 Therefore, the utility function of an individual should be defined by Eq. (2. 1):
( ) (2. 1)
represents the stock of health in period . corresponds to the service flow per unit of stock. In this sequence, ℎ = gives the total consumption of health services while is the consumption of other goods. 0 corresponds to the stock of
health in the initial period (value that is provided). The stock of health in the remaining periods, life extension and the planned date ( ), are endogenous.
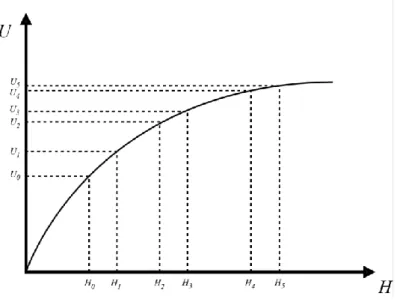
The isolated relation between an individual’s stock of health and utility is captured in Figure 1, where the health capital, H, is measured on the horizontal axis and the level of utility, U, is represented on the vertical axis.16 The positive gradient of the curve indicates that an increase in individual’s stock of health directly enhances total utility. The shape of the curve is particularly important because it illustrates the
13 Unescorted by taking the way through net investments.
14 Educational capital has 2 important properties: it increases market productivity and consequently, it
determines the individual’s efficiency in combining time and goods in order to produce health investments.
15 In consumer theory, the utility function represents the individual’s preference order of each conceivable
amount of the good. When there are two or more goods from which the individual derives utility, the utility function is assumed to provide a measure of the extent to which the individual is willing to substitute one good for the other (Bolin, 2011).
16 For simplification, the intermediate step between the health stock, the services it provides, and the
utility received from these services are ignored and it is assumed that the stock of health directly yields utility.
ASSESSMENT OF HEALTH PERCEPTION PREDICTORS:AN APPLICATION OF GROSSMAN’S MODEL TO THE PORTUGUESE POPULATION
fundamental economic principle of the law of diminishing marginal utility.17 An increase in health from H0 to H1 causes utility to increase from U0 to U1, while an equal
increase in health from H2 to H3 generates a much smaller increase in utility, from U2 to
U3, and even smaller (U4 to U5) from H4 to H5, which means that individuals value a
marginal improvement in health more when they show a lower level of health.18
Figure 1 – Total Utility Curve for Health.
On that account, the cost function associated with the production of health investments may be (Eq. (2. 2):
( ( ) ) ( ( ) ) (2. 2)
Where w is the wage rate and is the vector of prices of market goods used in health production, and is the one-unit cost of producing I. Consumers produce gross investment in health and other goods in the utility function according to the Eq. (2. 3) and Eq. (2. 4):
( ) (2. 3)
17
Utility increases at a decreasing rate with respect to health which means that each successive incremental improvement in health generates smaller additions to total utility.
18
It is possible that two or more subjects receive a different amount of utility from the same stock of health as the law of diminishing marginal utility only requires that the addition to total utility diminishes with successive rises in health for a given subject.
ASSESSMENT OF HEALTH PERCEPTION PREDICTORS:AN APPLICATION OF GROSSMAN’S MODEL TO THE PORTUGUESE POPULATION
( ) (2. 4)
expresses the gross investment in health. represents the goods purchased in the market that contribute to that investment. Similarly, is the entry of goods that contribute to the production of . and , correspond to inputs of time. constitutes the stock of knowledge of the consumer. Therefore, as detailed in Eq. (2. 5), the net investment in the stock of health will be equal to the gross investment minus the depreciation:
(2. 5)
corresponds to the depreciation rate (exogenous) over the periods and
depends on the age. In order to reduce the degree of complexity, we achieve the optimality condition regarding the demand for health capital in the Eq. (2. 6):19
( ) ( ) ( ( ) ( ) ) ( ) (2. 6)
In the formulation above, is the marginal life-cycle utility of wealth at the outset (t=0). The left-hand side constitutes the MBHC (Marginal Benefits of Health Capital), which equals the discounted marginal consumption utility of health capital, and the monetary value of one additional unit of health capital. The right-hand side constitutes the marginal cost of an additional unit of health capital: the term r reflects the opportunity cost of investing in health rather than in the capital market; the depreciation term reflects the depreciation of each unit of health capital by a certain amount at each point in time; the last term reflects the variation over time of the one-unit cost of producing gross investments in health (Bolin, 2011).
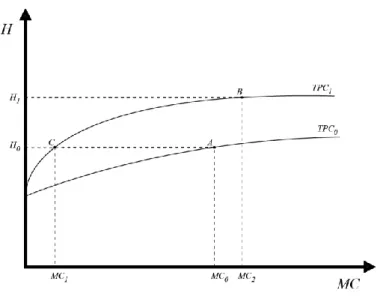
The MBHC are demonstrated in Figure 2, which illustrates the individual’s demand or marginal benefits (and costs) of health capital as given by Eq. (2. 6). The
19 The condition was derived by, first, formulating the Hamiltonian function for the individual’s
optimization problem ( ∫ ( ) ) and then applied the maximum principle (Bolin, 2011; Chiang, 2000).
ASSESSMENT OF HEALTH PERCEPTION PREDICTORS:AN APPLICATION OF GROSSMAN’S MODEL TO THE PORTUGUESE POPULATION
downward sloping curve illustrates the MBHC, and the horizontal line corresponds to the MCHC (Marginal Cost of Health Capital), which is infinitely elastic since the marginal cost of health capital is independent of the stock.
Figure 2 – Demand for Health Capital.
The most important predictions that can be derived from the demand-for-health model concern the individual’s age, education and wage and the price of medical care. Basically, under normal conditions, age is positively correlated with expenditures on health care but negatively correlated with health capital, education is negatively correlated with expenditures on health care but positively correlated with health capital, the individual’s wage rate is positively correlated both with the demand for health and with the demand for health care, and the price of medical care is negatively related with the use of medical care and health status (Sloan and Hsieh, 2012).
Detailing a bit those predictions, age decreases the demand for health implying a reduced demand for gross health investments, at the same time that the depreciation rate increases. Grossman (2000) has shown that the joint effect of these two forces led to an increase demand for gross health investments with age under plausible conditions. This suggests, for example, that the elderly demand more medical care than the young, as it is frequently noted to be the case (Folland et al., 2012).
Concerning the stock of educational capital, education improves household production efficiency and makes each unit of own time used in household production
ASSESSMENT OF HEALTH PERCEPTION PREDICTORS:AN APPLICATION OF GROSSMAN’S MODEL TO THE PORTUGUESE POPULATION
more expensive (efficiency and time-price effects respectively) both increasing the demand for health. (Bolin, 2011) However, although the strong positive relation between education and good health, demonstrating a causal effect empirically has shown to be particularly difficult (Cawley and Ruhm, 2011).
Regarding the complex effect of wage on health, Deaton (2002) refers to it as the “income gradient” empathizing the gradual relationship between both. Anyway, in the demand for health, there are also two opposite effects: although income increases the value of available healthy time strengthening the incentives for being healthy, it makes more expensive the own time used for producing gross investments in health due to the increase of the marginal cost of health capital (Bolin, 2011). Once again Grossman (2000) showed an increase demand for health when combining those opposite forces, as long as the investments were not produced solely by own time. Nevertheless, according to Santerre and Neun (2013), the last years have been object of extensive research on this matter which led to classify the several hypotheses presented by, into four broad categories: the absolute income hypothesis, the relative income or deprivation hypothesis, the relative position hypothesis and the income inequality hypothesis.20
The political relevance of Grossman’s model is increasing since it is the only model about individual behaviour in health that has strong foundations in economic theory. The model has been employed widely to explore a variety of phenomena related to health, inequality in health, medical care, the relationship between health and socioeconomic status, occupational choice, and many other subjects (Galama and Kapteyn, 2011).
Not always the empirical evidence have corroborated the testable implications of the theoretical predictions, which led to a significant criticism (Morris et al., 2007).
Besides the already mentioned simplistic deterministic nature21, the model has also been criticised for allowing complete health repair (Case A., Deaton A., 2005), for not determining length of life and for its formulation in which medical investment in
20
Detailed explanation of the different categories can be found in the paper published in 2004 by Lynch et al.: “Is Income Inequality a Determinant of Population Health? Part 1. A Systematic Review”.
21 Laporte and Furguson (2007) incorporated uncertainty in the health production model by applying
ASSESSMENT OF HEALTH PERCEPTION PREDICTORS:AN APPLICATION OF GROSSMAN’S MODEL TO THE PORTUGUESE POPULATION
health has constant returns which is argued to lead to an unrealistic “bangbang” solution (Ehrlich and Chuma, 1990).
Zweifel et al. (2009) also argue that some of the implications of the Grossman’s model are “not consistent with available empirical evidence”, mainly because permanent health status and demand for medical services are negatively rather than positively related, and so, is not possibly to affirm that expenditure on medical services constitutes a demand derived from an underlying demand for health. In that same paper the authors suggest future possible research in the area of corrective action of individuals.22
Nevertheless, that criticism has led to theoretical and empirical extensions of the model, which to a large extent address the issues identified.23 Those related empirical works were often inspired more by the intuition of Grossman’s model than strict adherence to its theoretical features.
More recent studies have shown great support of the model, mostly because the information collected comes mainly from longitudinal studies with a variety of health outputs and inputs, instead of the past when the information focused mainly on cross-sectional studies. Furthermore, improvements in data extraction during the last decades made possiblbe the application of the model under different empirical approaches.
Laporte (2014) in his latest paper argues that the criticisms made by Galama et al. (2012), Galama and Kapteyn (2011) and Zweifel (2012, 2013) don’t constitute a significant arraignment of the Grossman’s model of investment in health theoretical structure, and that most of the criticisms made by other health economists “seem to come down to having looked at an intrinsically model through static eyes”. Although emphasizing that there is still space for extensions of the model in various directions, Laporte affirms that before moving on to more complicated models, first it would be important to understand the depths of the dynamics present in the simple model. In fact, the dynamic characteristics of the model have not been fully applied in many relevant areas of health policy, which leaves open potential breakthroughs in health production
22
The prediction is that the longer the string of healthy days, the lower will be the preventive effort (ceteris paribus).
23 For an extensive review please check the work published by Michael Grossman in 2000 and the work
ASSESSMENT OF HEALTH PERCEPTION PREDICTORS:AN APPLICATION OF GROSSMAN’S MODEL TO THE PORTUGUESE POPULATION
field. Grossman (2000) himself states the message that “a very different theoretical paradigm is required to understand the determinants of health outcomes”.
As a final remark, it is necessary to take into account that as Sloan and Hsieh (2012) state, “models are judged by the accuracy of the predictions they offer rather than on how plausible the assumptions appear to be”, and for example the assumption of rational behaviour in Grossman’s Model may be valid in some contexts and not in others. Despite the limitations aforementioned, theoretical extensions and competing economic models are still relatively few (Galama et al., 2012). The explanation why Michael Grossman’s Model has remained the same since its beginning with many economists emphasizing that it is as relevant today as it was 40 years ago is due to the fact that it still provides a logically consistent framework that explains observed differences in health, investments in health including medical care and consumption, and evaluates public and private policies to affect these outcomes (Kaestner, 2013). Nevertheless yet there are some improvements needed in order to refine the model. One of them definitely concerns the necessity to point out the important distinction between ex ante and ex post investments in health, which is not developed in the model (Zweifel, 2012), allowing for substitution possibilities between ex ante and ex post investments in health that likely occur. In line with this, suggestions for worthwhile future research go around the substitutability phenomena of an individual’s own preventive effort by medical care.24 Kaestner denotes that the furtherance of a “more productive way to move the health economics field forward” needs to integrate an health production function with that distinction (or related specifications), into the models of health and longevity developed by Murphy and Topel (2006) and Becker (2007), without highlight changes in consumer preferences.
24
There is little empirical evidence on these relationships (Zweifel and Manning, 2000). On one hand more preventive effort in the healthy state leads to a longer expectation on the duration of the healthy state during which no health care services are required, but on the other more medical care restores good health quicker, resulting in a longer string of healthy days.
ASSESSMENT OF HEALTH PERCEPTION PREDICTORS:AN APPLICATION OF GROSSMAN’S MODEL TO THE PORTUGUESE POPULATION
2.3 E
STIMATIONM
ETHODOLOGYThe importance of specifying health production functions is due to the necessity of allocating limited resources among alternative health inputs consequently producing the largest possible increase in health status (Wibowo and Tisdell, 1992). Production functions have been estimated for a wide variety of outcomes including for example self-rated health, mortality, obesity and weight gain (Vaidya, 2013).
Although Grossman’s theoretical model was designed for analysis of health production at micro level the aim of this study is to analyse the production system at macro level. Consequently, in order not to lose the theoretical ground when switching from micro to macro analysis, the elements of the vector of individual inputs to the health production function (Eq. (2. 7) are represented by per capita variables and regrouped into sub-sectoral vectors of economic, social, and environmental factors as:
( ) (2. 7)
where E is a vector of per capita economic variables, S is a vector of per capita social variables, and En is a vector of per capita environmental factors. In its scalar form de equation can be rewritten as Eq. (2. 8):
ℎ ( ) (2. 8)
where h is individual’s health status proxied by the self-reported health status, ( ) ; ( ) ; ( ) , and a, b, and c are number of variables in each sub-group, respectively. Using calculus, can be transformed to its explicit form and given as Eq. (2. 9):
(2. 9)
where , are elasticities and estimates the initial stock of health.25
25 Although being out of the scope of this work, discussions about various aspects of production
ASSESSMENT OF HEALTH PERCEPTION PREDICTORS:AN APPLICATION OF GROSSMAN’S MODEL TO THE PORTUGUESE POPULATION
In line with this (for elucidation purposes) if for example we take the logarithm of the previous equation, a loglinear Cobb-Douglas production function (Eq. (2. 10) of the study can be written as:
ℎ ∑ ( ) ∑ ( ) ∑ ( ) (2. 10)
where ; ℎ ; and and is the disturbance term. Other example is Kenkel (1995) health estimation as a function of several lifestyle factors including smoking, drinking, eating breakfast and stress, with separate reduced form equations for each of five health outcomes that include both subjective and objective (self-reported) health measures, using an ordered probit model.
It is possible to find in the literature several possible health production functions forms, such as linear, quadratic, log-linear, reciprocal log-linear, loglinear Cobb-Douglas, double log, etc.
Anyway regardless of the method chosen, the identification of inputs and outputs and specification of the linkage between them provides the basis for estimating costs and benefits of those variables.
ASSESSMENT OF HEALTH PERCEPTION PREDICTORS:AN APPLICATION OF GROSSMAN’S MODEL TO THE PORTUGUESE POPULATION
2.4 E
MPIRICALE
VIDENCE ON THEP
RODUCTION OFH
EALTH INUSA
ANDE
UROPEAccording to the WHO 2009 report, “Global health risks: mortality and burden of disease attributable to selected major risks”, socioeconomic factors, environmental and community conditions, and individual behaviour lead to a complex chain of events over time, arguing that the modification of these background by influencing multiple proximal causes is likely to have amplifying effects and so, the potential to yield funda-mental and sustained improvements to health. In line with this, results of several epidemiological works led to a growing apprehension about the strong relationship between health and “life styles”.26
Concerning empirical research, according to Jones and Rice (2005), health economics has been at the forefront of developing analytical tools able to measure and explain health production and inequalities. The equilibrium equation derived under the assumption of a linear health production process has been the basis for most of the empirical tests of the health production literature (e.g., Grossman, 1972b; Wagstaff, 1986).
Anyway, although the production of health has been the focus of numerous empirical studies which adopted a health production function analytical framework focusing the marginal contribution of selected economic, social, environmental, and medical inputs on various measures of health outcomes, until the XXI century only a few studies tried to estimate an aggregate, multifactor health production function for the USA (Thornton, 2002).
In fact, compared to other fields of empirical research in economics, there is low amount of works focused on testing the predictions of the demand-for-health model, mainly due to the fact that the empirical testing needs to employ longitudinal and suitable data that has not been available for many decades (Bolin, 2011).
Poças and Soukiazis (2010) claim that the numerous studies that concentrate their analysis on the determinants of health generally emphasize, beyond
ASSESSMENT OF HEALTH PERCEPTION PREDICTORS:AN APPLICATION OF GROSSMAN’S MODEL TO THE PORTUGUESE POPULATION
economic factors, the health care resources and lifestyles role, as well as some biomedical factors, the last ones in a microeconomic perspective. Nevertheless, the same authors argue that there is not much diversity concerning the methodology used in the economic literature of this topic and most of those studies follow the DEA (Data Development Analysis), a non-parametric method of estimation or the production function approach.
Since Grossman’s Model publication, several authors have estimated reduced form models, which regardless using a large variety of methodologies and data from diverse institutional and cultural environments, are broadly in agreement with one another and in line with the predictions of the model (Galama et al., 2012).
Notwithstanding the fact that the decision making process at the health level often occurs within the family, previous formulations of the Grossman’s Model only consider the individual in isolation.27 In this sense, the model has been extended in order to take into account the fact that most people lead their lives within a family, and although the structure of a family may change over the lifecycle, the fact remains that other individuals with whom a person lives influence behaviour (Bolin et al., 2002). Approaching the empirical relationship between economic status and health in the family context is important as there are multiple interactions within a family (which can be usefully analysed in unitary, collective or institutional settings) that may significantly affect the relationship between economic status and health (Tipper, 2010).28 The advantage of considering various approaches is that empirical analysis of family economic behaviour indicates the existence of substantial heterogeneity across families.29 In fact, some economists have already suggested that no single economic
27 Jus in the past decade Jacobson (2000) introduced the corresponding combined production possibility
frontier, using a framework in which family members have common preferences. The most meaningful apprehension provided was that not only individual’s income can be used in the production of health, but rather that the family’s joint resources are important (Bolin et al., 2002; Jacobson, 2000).
28 Although the health production function relates intra-household resource allocations to health, there are
reasons to suspect that being part of a family confers benefits to health in addition to those working through the function, mainly because many factors might be unobservable and, therefore, unaccounted for in empirical analyses of the determinants of health which in part explains why the adoption of a particular framework might depend on the issues the empirical researcher wants to investigate (Tipper, 2010).
29 For example, the income-pooling hypothesis implies that only total income needs to be considered and
so, the effect of income on health does not depend on who provided the income or how it was earned. Contemporaneously, economists have questioned the existence of a unitary set of preferences for the household and have specified models allowing the individuals within the household to have different preferences over how to allocate the time and money available to them (Browning and Bonke, 2009).The
ASSESSMENT OF HEALTH PERCEPTION PREDICTORS:AN APPLICATION OF GROSSMAN’S MODEL TO THE PORTUGUESE POPULATION
model of the household is applicable to all family situations (Munro et al., 2006), which leaves a great potential for further theoretical work and empirical refinements.
Generally speaking, empirical evidence shows that health crops up to increase with income, education and sports activity and decrease with age, the price of medical care (treatments, procedures, and devices that may be used to prevent, diagnose, and treat health problems), physically and mentally demanding work environments, manual labor, psychological stress, overweight, smoking and heavy alcohol consumption.30 Females have worse health than males, and singles have worse health than married individuals (Galama et al., 2012).
More recent empirical investigations have been trying to find unobserved variables that might affect health status and explain the impact of interwoven causes in the health production function. As example, Balia and Jones (2008) in their paper “Mortality, lifestyle and socio-economic status”, estimated the determinants of health status by relating premature mortality to a set of observable and unobservable factors, focusing on unobservable individual heterogeneity.
Many variables have shown to have a powerful association with health status, but proving its causality has been issue of disagreement between many dedicated health economists.
Baltagi et al. (2012), studied the spatio-temporal variations in health productivity in the OECD countries, over the last three decades, by estimating a production function where life expectancy depends on health and social spending, lifestyle, and medical innovation. Although their results must be interpreted with care (due to the complexity of the phenomenon, data limitations and limited set of variables) they found that health spending does have a significant but mild effect on health outcomes, even after controlling for medical innovation.
As we already mentioned in the subchapter 2.2, the relationship between health and educational capital is particularly important since this two human capital
widespread rejection of income pooling in the empirical literature has been influential in weakening the case for the unitary model evidence therefore suggesting that the source of income is likely to be important for health status. (Lundberg and Pollak, 2008; Rode, 2011).
ASSESSMENT OF HEALTH PERCEPTION PREDICTORS:AN APPLICATION OF GROSSMAN’S MODEL TO THE PORTUGUESE POPULATION
components are the most important target for public policy initiatives in the area of individual welfare, and in line with this, a major focus of discussion is education, particularly schooling. Even Albert Einstein himself once said that “The only thing that interferes with my learning is my education.” Grossman (2000) claims that empirical literature “underscores the potential payoffs” of interactions between schooling and health, by improving health by enhancing allocative or productive efficiency. There is a positive strong correlation between the number of years of formal schooling completed and good health, independently of the chosen indicator of health31 or unit of observation32 (Bolin, 2011). Many empirical works reinforce this conclusion33, some of them even distinguishing direct from indirect effects on health such as Häkkinen et al. (2006) who estimated in their analysis a productive and an allocative effect of education respectively. Even though, not all the evidence goes in that direction. Analytical solutions for the Grossman’s model are usually based on two sub-models: the pure investment model (health does not provide utility) and the pure consumption model (health does not provide a production benefit). In his work, Galama (2012) argues that besides in the pure investment model, higher education leads to a higher demand for medical goods and services, in the pure consumption model, the sign is ambiguous and depends on the relative efficiency gains from education for consumption and health investment. This contrasts with the usual prediction of the Grossman’s model that education unambiguously reduces this demand.
As already mentioned in this chapter, it would be expected too a positive relation between health care resources and health status if increasing resources implies an improvement in the level and/or quality of health services supplied to the population, but the empirical evidence that emerges from the studies that have been carried out so far in this area is rather weak and conflicting. In fact, many regional studies carried out within different countries do not lead to a consensus. For example, in several studies examining cross-regional differences of mortality and morbidity in the U.S.A, the impact of health care is usually shown to be slight or even negative (Bolin, 2011; Or, 2000). One reason for these conflicting results might be related with the difficulty in
31
Either physiological indicators or self-assessed health, morbidity or mortality rates.
32 Individuals or groups.
33 Several empirical confirmations can be found consulting for example the works of Lleras-Muney