UNIVERSITY OF BARCELONA
EVALUATION OF THE CYTOTOXICITY OF TRANSITION METAL COMPLEXES: DNA CLEAVAGE OF COPPER COMPLEXES IN CELLS
Antoine Karengera
Erasmus Mundus Master in Chemical Innovation and Regulation
Work supervised by
Prof. Patrick Gamez and Prof. Isabel Cavaco
UNIVERSITY OF BARCELONA
EVALUATION OF THE CYTOTOXICITY OF TRANSITION METAL COMPLEXES: DNA CLEAVAGE OF COPPER COMPLEXES IN CELLS
Antoine Karengera
Erasmus Mundus Master in Chemical Innovation and Regulation
Work supervised by
Prof. Patrick Gamez and Prof. Isabel Cavaco
i
Evaluation of the cytotoxicity of transition metal complexes: DNA cleavage of copper complexes in cells
Declaration of Authorship
I hereby declare that I am the author of this work, which is original and unpublished. Authors and works consulted are properly cited in the text and listed in the list of references included.
Antoine KARENGERA
Copyright: Antoine KARENGERA The University of Barcelona and University of Algarve
are entitled without time or geographical boundaries, to file and publicize this work through printing copies on paper or digital form, or by any other medium, to promote it in scientific archives and to allow its copy and distribution for educational or researches purposes, non commercial, as long as credit is given to the author and publisher.
ii
DEDICATION This work is dedicated to my beloved wife Marie Chantal UMUTONI
iii ACKNOWLEDGEMENTS
It is with immense and special gratitude that I acknowledge the support and help of my advisors Prof. Dr. Patrick Gamez and Prof. Dr. Isabel Cavaco for their excellent supervision and knowledge during my thesis work.
Immeasurable appreciation and deepest gratitude are extended to the following persons who in one way or another have contributed in making this study possible:
ChIR program coordination and European Commission, for selecting my candidacy and allowing me to attend this master’s program.
Dr. Nataliya Butenko, for her time and effort in guiding me throughout my stay especially her trainings in the Agarose Gel Electrophoresis, bacterial cell culture, and plasmid DNA purification.
Dr. Vera Ribeiro, for her help in bacterial cell culture, pDNA purification, and for the opportunity to work in her laboratory.
Research group Bio-Inorganic Chemistry (QBI) at University of Barcelona, for welcoming and accepting me into this group, and for the invaluable support that I received from the group members.
International Mobility of Office at University of Algarve, for their support and help in my integration into academic environment and in Portuguese society.
My wife and my family, for their encouragement, being around, and trusting my vision plans.
Professors and fellow ChIR students, for their kindness and friendly opinions during all classes and my academic stay.
Portuguese and Spanish people, for their hospitality and willingness to help foreigners.
iv ABSTRACT
Transition metal complexes, particularly copper(II) compounds have received an increasing attention for cytotoxic effect. Copper compounds coordinated to various types of ligands exhibit considerable nuclease activity that is mostly measured by using the Agarose Gel Electrophoresis (AGE) of pDNA digested by the compounds of interest. In attempt to gain more insight into the cytotoxicity of transition metal complexes, namely their binding and cleavage capacity towards DNA, copper(II) compound [Cu(L)Cl](CH3OH) was prepared using a Schiff base ligand, 2-(pyridin-2-yl)hydrazono)methyl)phenol. The latter has been synthesized by condensation reaction between 2-hydrazinopuridine and salicylaldehyde and characterized by x-ray crystallography, mass spectrometry (MS), NMR and IR spectroscopy. [Cu(L)Cl](CH3OH) DNA binding properties were examined by spectrophotometric DNA titration (UV-visible spectroscopy) and EtBr displacement assay (fluorescence spectroscopy) using ct-DNA. The nuclease activity was evaluated by conversion of the Sc DNA into Nck and Lin forms using the AGE of pBR322 and pA1 DNA.
A new method for evaluating the extent of DNA cleavage within living cells has been developed. The method was studied on Mach1 E. coli bacteria cells using vanadyl acetylacetonate, VIVO(acac)2, and copper(II) complex, [Cu(L)Cl](CH3OH). This new technique consists of bacterial cells culture, exposure of bacterial cells to concerned compounds, pDNA purification, and the AGE of pDNA extracted from exposed cells. DNA binding results show that the complex interacts with ct-DNA. The calculated values of intrinsic binding (Kb) and Stern-Volmer quenching (Ksv) constants were of 5.98 x 10⁴ M-1 and 399.9 M-1, respectively. In contrary to pRB322 DNA, [Cu(L)Cl](CH3OH cleaves pA1 pDNA cleavage in presence of mercaptopropionic acid (MPA). Furthermore, VIVO(acac)2 DNA cleavage inside living cells was observed by using the new developed procedure.
Keywords: Copper(II) complexes, DNA cleavage, cytotoxicity, agarose gel electrophoresis, living cells, method development.
v TABLE OF CONTENTS
ACKNOWLEDGEMENTS ... iii
ABSTRACT ...iv
LIST OF TABLES ... viii
LIST OF FIGURES... viii
LIST OF ABBREVIATIONS AND ACRONYMS ...xi
I. INTRODUCTION ... 1
I.1. Objectives ... 1
I.2. Evaluation of DNA cleavage ... 1
I.2.1. Methods and limitations ... 2
I.2.2. Assessment in cells ... 3
I.3. Biochemistry of Copper ... 4
I.3.1. Overview of copper ... 4
I.3.2. Copper in human health and diseases ... 4
I.3.3. Copper(II) complexes as potential therapeutic agents ... 6
I.3.4. Biological activity of Cu(II) complexes with Schiff base ligands ... 7
I.4. Analytical techniques ... 8
I.4.1. Principles of Agarose Gel Electrophoresis (AGE) ... 8
I.4.2. Fluorescence spectroscopy ... 9
I.4.3. Ultraviolet Visible (UV-vis) Spectroscopy ... 11
I.4.4. Nuclear magnetic resonance spectroscopy (NMR) ... 12
I.4.5. Electrospray ionization mass spectrometry (ESI-MS; positive mode) ... 12
I.4.6. X-ray crystallography ... 13
I.4.7. Infrared spectroscopy (IR) ... 14
I.5. Cells culture techniques ... 15
II. EXPERIMENTAL PART ... 17
II.1. Methodology ... 17
II.2. Synthesis and characterization ... 17
II.2.1.Materials ... 17
vi
II.2.3. Synthesis and characterization of ligand (LH)... 18
II.2.4. Synthesis and characterization of complex [Cu(L)Cl](CH3OH) ... 18
II.2.5. X-Ray crystallography of complex [Cu(L)Cl](CH3OH) ... 19
II.2.6. Stability test of [Cu(L)Cl](CH3OH) ... 19
II.3. DNA binding studies... 20
II.3.1. UV-visible spectroscopy... 20
II.3.2. Fluorescence spectroscopy ... 20
II.4. Cell culture ... 21
II.4.1. Preparation of Luria-Bertani (LB) medium ... 21
II.4.2. Growing bacteria in a culture ... 21
II.4.3. Treatment of E. coli bacteria by [Cu(L)Cl](CH3OH) and VO(acaca)2 ... 21
II.5. DNA purification ... 23
II.6. Agarose Gel Electrophoresis (AGE)... 24
II.6.1. AGE at University of Barcelona ... 24
II.6.2. AGE at University of Algarve ... 26
III. RESULTS AND DISCUSSION... 29
III.1. Synthesis and characterisation ... 29
III.1.1. Ligand synthesis and structure ... 29
III.1.2. Complex synthesis and structure ... 29
III.1.3. Stability test of [Cu(L)Cl](CH3OH) ... 32
III.2. DNA-binding studies ... 34
III.2.1. UV-visible (UV-vis) pectroscopy ... 34
III.2.2. Fluorescence spectroscopy ... 37
III.3. DNA-cleavage investigation ... 39
III.4. Evaluation of plasmid DNA cleavage in living cells ... 42
III.4.1. Bacterial culture of E. coli cells ... 42
III.4.2. Treatment of Mach1 E. coli cells by [Cu(L)Cl](CH3OH) and VIVO(acac)2 ... 43
III.4.3. Extraction of plasmid DNA (pDNA) from bacterial cells ... 46
III.4.4. Agarose Gel Electrophoresis (AGE) ... 47
IV. CONCLUSION ... 50
vii
A. Images of gels: Plasmid DNA cleavage activity of complex [Cu(L)Cl](CH3OH) ... 52 B. Images of gels: Evaluation Of plasmid DNA cleavage within living cells ... 56 C. Stability test of [Cu(L)Cl](CH3OH)... 60 BIBRIOGRAPHY ... 61
viii LIST OF TABLES
Chapter II
Table II.1 composition of sample culture after loading compounds ... 22
Chapter III Table III.1. Crystal data and structure refinement details for [Cu(L)Cl](CH3OH). ... 31
Table III.2. Selected interatomic distances (Å) of [Cu(L)Cl](CH3OH) and complex [Cu(L1)Cl](CH3OH) ... 31
Table III.3. Selected interatomic angles (º) for [Cu(L)Cl](CH3OH) and related complex [Cu(L1)Cl](CH3OH) ... 31
Table III.4. pDNA concentration (μg DNA/mL) of samples calculated from their absorbance at 260 nm measured after DNA isolation ... 46
LIST OF FIGURES Chapter I Figure I.1. Comet assay micrographs ... 3
Figure I.2. Pathway of copper in the body ... 5
Figure I.3. Principles of gel electrophoresis... 8
Figure I.4. Jabronski diagram representing electronic transitions ... 9
Figure I.5. The basic components of mass spectrometer ... 13
Figure I.6. Stretching and bending vibration ... 14
Figure I.7. Basic elements of a Spectrometer ... 15
Figure I.8. E. coli growth curve with its phases ... 16
Chapter II Figure II.1. Synthesis of 2-(pyridin-2-yl)hydrazono)methyl)phenol (LH) ... 18
Chapter III Figure III.1. Representation of 2-(pyridine-2-yl)hydrazono)methyl)phenol (LH) and 2- tertbutyl-6-(pyridine-2 ylhydrazonomethyl)phenol (LH1). ... 29
Figure III.2. Representation of molecular structure of coordination compound [Cu(L)Cl](CH3OH) ... 30
Figure III.3. Plot of normalized absorption spectra of [Cu(L)Cl](CH3OH) solution measured in 0.5% DMSO at different duration after the preparation. ... 32
ix
Figure III.4. Plot of normalized absorption spectra of [Cu(L)Cl](CH3OH) solution measured in 100% DMSO at different duration after the preparation ... 33 Figure III.5. Plot of [DNA]/(ea-ef) vs. [DNA] for the titration of ct-DNA with complex
[Cu(L)Cl]CH3OH ... 35
Figure III.6. Absorption spectra of 25 μM [Cu(L)Cl](CH3OH) in 1mM cacodylate/20 mM NaCl
(pH 7.19) in presence and in absence of increasing amount of ct-DNA ... 36 Figure III.7. Emission spectra of the DNA-EtBr complex (25 µM and 25.36 mM), Iext = 514 nm,
Iem = 610 nm upon increase of [Cu(L)Cl](CH3OH) (0-100 μM). ... 37
Figure III.8. Stern-Volmer fluorescence plot of I0/I vs. [complex] for the titration of DNA-EtBr with
complex at λext = 514 nm and λem = 610 nm... 38
Figure III.9. Cleavage of pBR322 DNA by increasing concentrations of [Cu(L)Cl](CH3OH), 5-200
µM, without reducing agent (lanes 2-6) and in the presence of 100 mM ascorbic acid (lanes 8-13) incubated for 24 h at 37oC and electrophoresed in 1.5 hour at 1.5 V/cm ... 39 Figure III.10. Cleavage of pA1 DNA by [Cu(L)Cl](CH3OH) in increasing complex concentrations 25-400 µM in 10 mM MOPS buffer (lanes 4-8) and in 10 mM phosphate buffer,PO4-, (lanes 10-14) ... 40 Figure III.11. Quantification (in %) of bands from the pA1 DNA cleavage by [Cu(L)Cl](CH3OH)
under MOPS buffer at different concentration of complex ... 41 Figure III.12. Quantification (in %) of AGE bands from the pA1 DNA cleavage by
[Cu(L)Cl](CH3OH) under phosphate buffer at different concentration of complex ... 41 Figure III.13. Bacterial cells growth curve of Mach1 - T1 E. coli compared to standard
cloning strains (this figure was adapted from Invitrogen life technologies) [104] ... 43 Figure III.14. Plot of absorbance at 600 nm (OD600) vs. sampling time (h) for the microbial
culture of Mach1 E. coli cells treated by 200 μM [Cu(L)Cl](CH3OH) and 25 – 200 μM of
VO(acac)2. ... 44 Figure III.15. Spectroscopic absorbance of exposure samples (treated culture) measured after 0, 2, 4, and 8 hours of incubation at 600 nm (OD600) by spectrophotometer... 45
Figure III.16. pDNA concentrations measured in samples by absorbance spectroscopy ... 47 Figure III.17. AGE of pDNA purified from E. coli bacterial cells which were treated by 200 μM [Cu(L)Cl](CH3OH) ... 48
Figure III.18. AGE of pDNA purified from E. coli bacterial cells treated by VO(acac)2 at different
concentrations (50-200 μM) ... 49
LIST OF FIGURES IN ANNEX
A. Images of gels: PDNA cleavage activity of complex [Cu(L)Cl](CH3OH) Figure A1. DNA cleavage activity of 50 µM [Cu(L)Cl](CH3OH) in 10% DMSO in 10 mM PBS
and 10 mM MOPS buffers (pH 7.1) in the presence of activating agents: 200 μM oxone (Ox) and 200 μM MPA. ...52 Figure A2. DNA cleavage activity of 50 µM [Cu(L)Cl](CH3OH) in H2O (narrowly soluble in
water), in 10 mM PBS and 10 mM MOPS buffers (pH 7.1) in the presence of activating agents: 200 μM oxone (Ox) and 200 μM MPA. ...52
x
Figure A3. DNA cleavage activity of increasing concentration (50, 100 and 200 µM) of [Cu(L)Cl](CH3OH) in 10% DMSO at in 10 mM PBS and 10 mM MOPS buffer (pH 7.1) in the
presence of activating agent: 200 μM oxone (Ox) and 200 μM MPA. ...53 Figure A4. DNA cleavage activity of 100 and 200 µM [Cu(L)Cl](CH3OH) in H2O, narrowly
soluble in water, (lanes 3-7) and in 0.5% DMSO (lanes 8-12) in 10 mM PO4 buffer (pH 7.39) in the presence of activating agents: 200 μM oxone (Ox) and 200 μM MPA. ...53 Figure A5. DNA cleavage activity of [Cu(L)Cl](CH3OH) 200 µM in 1% DMSO (lanes 6-8) and 100 µM in 0.5% DMSO (lanes 9-11) in 10 mM MOPS buffer (pH 7.1) in presence of activating agents: 200 μM oxone (Ox) and 200 μM MPA. ...54 Figure A6. DNA cleavage activity of increasing concentrations (25-400 µM) of
[Cu(L)Cl](CH3OH) in 0.5 % in 10 mM MOPS buffer (pH 7.1) and 10 mM PO4 buffer (7.39) , in
the presence of activating agent MPA (200 μM). ...54 Figure A7. DNA cleavage activity of increasing concentration (100-1000 µM) of
[Cu(L)Cl](CH3OH) diluted in 0.5 % DMSO in 10 mM MOPS buffer (pH 7.1) in the presence of
activating agent MPA (200 μM). ...55
B. Images of gels: Evaluation Of pDNA cleavage within living cells
Figure B1. DNA cleavage activity of VO(oda)(phen) (10, 50, 100 μM) and VOSO4 (100 μM)
within living cells (Mach1 E. coli bacteria) ... 56 Figure B2. DNA cleavage activity of VO(oda)(phen) (10, 25, 50 μM) and VOSO4 (100 μM) within living cells (Mach1 E. coli bacteria). ... 56 Figure B3. DNA cleavage activity of VO(oda)(phen) (10, 25, 50, and 100 μM), VOSO4 (100 μM), and VO(acac)2 (100 μM) within living cells (Mach1 E. coli bacteria). ... 57 Figure B4. (Replicate of Fig B3) DNA cleavage activity of VO(oda)(phen) (10, 25, 50, and 100 μM), VOSO4 (100 μM), and VO(acac)2 (100 μM) within living cells. Electrophoresis samples of
DNA were used immediately without further dilution in Millipore water. ... 57 Figure B5. AGE of pDNA purified from E. coli bacterial cells which were treated by 200 μM [Cu(L)Cl](CH3OH) in absence (lanes 2-5) and presence (lanes 6-9) of 200 μM MPA as an activating agent. ... 58 Figure B6. Effect of different dilutions DMSO (0.5 and 50 %) on pDNA within E. coli bacterial cells ... 58 Figure B7. AGE of pDNA purified from E. coli bacterial cells which were treated by increasing concentrations (25, 50, 100, and 200 μM) of VO(acac)2. ... 59
C. Stability test of [Cu(L)Cl](CH3OH)
Figure C1. Plot of absorption spectra of [Cu(L)Cl](CH3OH) solution measured in 0.5% DMSO at different duration after the preparation. ... 60 Figure C2. Plot of normalized absorption spectra of [Cu(L)Cl](CH3OH) solution measured in 100% DMSO at different duration after the preparation. ... 60
xi LIST OF ABBREVIATIONS AND ACRONYMS DNA deoxyribonucleic acid
pDNA plasmid DNA ct-DNA calf thymus DNA RNA ribonucleic acid
AGE agarose gel electrophoresis AFM atomic force microscopy CD circular dichroism
UV ultra violet
REDOX reduction – oxydation ROS reactive oxygen species
LH ligand “2-(pyridin-2-yl)hydrazono)methyl)phenol” LH1 2- tertbutyl-6-(pyridine-2-ylhydrazonomethyl)phenol Pyrimol 4-methyl-2N-(2-pyridyl methyl)amino-phenol) NSAID nonsteroidal anti-inflammatory drugs
MRSA nethicillin resistant staphylococcus aureus EDTA ethylenediaminetetraacetic acid
EtBr ethidium bromide
NMR nuclear magnetic resonance
ESI-MS electrospray ionization mass spectrometry MS mass spectrometry
IR infra red
E. coli Escherichia coli
A260 absorbance at wavelength of 260 nm A280 absorbance at wavelength of 280 nm
xii LB Luria-Bertani
OD optical density
OD600 optical density at wavelength of 600 nm acac acetylacetone
MPA 3-mercaptopropionic acid TAE tris-acetate–EDTA
TBE tris-borate and 1 mM EDTA
MOPS 3-(N-morpholino)propanesulfonic acid Nck open circular form of plasmid DNA Sc supercoiled form of plasmid DNA Lin linear form of plasmid DNA MLCT metal-to-ligand charge transfer DAPI 4',6-diamidino-2-phenylindole KSV Stern-Volmer constant
Kb intrinsic binding constant UV-vis ultraviolet-visible
1 I. INTRODUCTION
I.1. Objectives
Cytotoxicity of transition metal coordination compounds has been widely studied previously [1,2,3]. In most cases DNA cleavage activity of metal complexes is directly correlated to their cytotoxicity properties with, sometimes, anti-tumour potential [4,5]. Agarose gel electrophoresis (AGE) remains the most commonly used technique for characterization of the interactions (e.g., cleavage) between chemicals, such as metal complexes, and DNA [6].
Plasmid DNA (pDNA) is mostly employed in AGE experiments. pDNA, isolated from bacteria cells, is digested with the concerned compound. DNA cleavage is then checked by monitoring the conversion of supecoiled (Sc) DNA to nicked (Nck) and linear (Lin) DNA. However, little is known in regard to the detection of the DNA damage by metal coordination compounds inside living cells. Therefore, this study was designed to address this point. The overall aim of this work has been to evaluate the DNA cleavage activity of copper-based complexes within living cells.
To achieve this general aim, three specific objectives were established: 1. To synthesize potential copper therapeutic complexes
2. To evaluate their DNA cleavage efficiency, and
3. To develop a method of evaluating the extent of DNA cleavage inside living cells. I.2. Evaluation of DNA cleavage
DNA damage can take place in both eukaryotic and prokaryotic cells. The causes of DNA degradation vary from natural basis such as apoptosis [7,8] to cleavage induced by genotoxic or cytotoxic agents including some metal complexes [1,9]. Techniques have been developed to detect breakage events in DNA strands. Some methods assess DNA degradation inside cells [10] while others analyse cleavage for isolated or extracellular DNA (e.g., pA1 DNA, pRB322 DNA) from cells [11,12].
Assessment of DNA cleavage conducted on purified DNA from cells can be carried out by different analytical methodologies such as agarose or polyacrylamide gel
2
electrophoresis, atomic force microscopy (AFM), UV-Visible (UV-vis), fluorescence, and CD spectroscopy. So far, there are not many techniques to detect DNA cleavage within living cells. Comet assay is the most used for studying DNA degradation in bacterial or tumor cells [13]. However, each of these techniques may present some drawbacks that may hamper their effectiveness.
I.2.1. Methods and limitations
The agarose (or polyacrylamide) gel electrophoresis is the most common employed technique in evaluation of DNA cleavage studies. This analytical method is widely used in analysis of DNA-chemicals interactions because of its safety, simplicity and low cost. It does not require sophisticated materials and equipments to perform. Furthermore, gel electrophoresis provides detailed results which are easy to interpret [14]. AGE provides advantages of having the unaltered nucleic acid during size separation process and sample recovery for ultimate studies. Limitations of this technique are related to the risks of unpredictable migration of DNA cleavage fragments that could complicate interpretations [15].
AFM is a method also employed in characterization of DNA interactions with chemical compounds [16]. AFM imaging is carried out in air and aqueous solution without staining, shadowing or labelling. In contrast to electrophoresis, AFM identifies shorter DNA fragments produced by cleaving chemicals. Moreover, it gives information about DNA structure modifications with good resolution and accuracy. The use of AFM may be limited by generation of artefacts which do not reflect the sample in reality [17]. DNA cleavage activity of metal complexes can be predicted indirectly through binding properties. Techniques such as UV-vis, fluorescence or circular dichroism (CD) spectroscopy are commonly employed to study the interactions with DNA [18,19]. However, these techniques do not allow detecting the cleavage itself in DNA strands. Even if spectroscopic procedures provide crucial information, they require complementary studies to confirm the DNA strand breakage.
3 I.2.2. Assessment in cells
Techniques have emerged for evaluating the occurrence of DNA breakage in cells. Those methodologies are well developed in cancer researches where they are frequently referred to as in situ methods [8]. Immunological or cytometric procedures have been reported to be effective for detection of DNA damages in humans. A concrete instance is the use of antibodies against carcinogen-DNA adducts to assess DNA damages in cells exposed to carcinogenic chemicals as well as UV light or oxidizing agents [20]. Other examples are cytometric methodologies detecting DNA damage induced by genotoxic agents or DNA fragmentation happening during apoptosis in individual cell [21]. The latter methods are capable of estimating the extent of the DNA damage and relating it to cell cycle phase and induction of apoptosis. So far DNA cleavage in microorganism cells is rarely assessed. Few techniques are available to detect the DNA breakage in bacteria. Comet assay is one of the most employed to study DNA strand breakage in eukaryotic cells [22] as well as in bacteria (e.g., Escherichia coli) [23,24]. This procedure is applied in testing new chemicals genotoxicity, identification of environmental genotoxins, human epidemiology researches, or studies in DNA damage and repair. Comet assay also known as single-cell gel electrophoresis technique operates by removal of all single-cellular content except the DNA. Broken DNA strands are then released from supercoiling and pulled out in form of tail by electrophoresis at high pH (figure I.1). The extent of this tail is stained with a fluorescent dye and analysed by fluorescence microscopy [25].
Figure I.1. Comet assay micrographs of (a) undamaged cells, and (b) cells with DNA damaged. DNA
4 I.3. Biochemistry of Copper
I.3.1. Overview of copper
Copper (Cu) is a transition metal element found in fourth period on the table of elements with atomic number and atomic weight of 29 and 63.546, respectively. Cu has two stable isotopes, 63Cu and 65Cu with corresponding natural abundances of 69.2 and 30%. It can exist in three oxidation states which include essentially Cu(0), Cu(I), and Cu(II). The capability of releasing or absorbing an electron provides copper with the important role in oxidation-reduction (REDOX) reactions and free radicals scavenging events [27].
Copper is an essential nutrients which is involved in many functions of plants, animals and humans. In organism, under the oxidizing conditions of extracellular environment, copper exists as Cu2+ while inside the cell it likely exists in the reduced form (Cu+) oxidation state [28]. Imbalance of this element in organism can lead to life threatening conditions [29].
I.3.2. Copper in human health and diseases
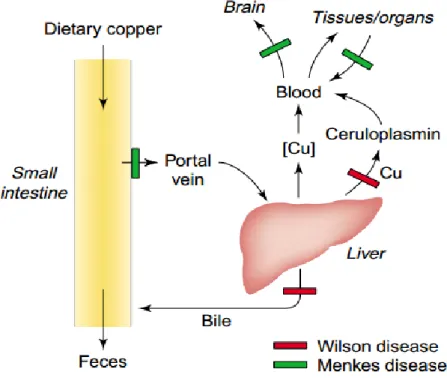
Copper (Cu) has been known since 1930s as an essential trace element in mammalian nutrition. Biological Cu content may vary from parts per billion (ppb) to parts per million (ppm) with adult body containing about 80 mg absorbed from diet (figure I.2). Absorbed Cu is bound to amino acids or small peptides. In systemic circulation 95% of plasma Cu is transported by copper-transporting protein known as ceruloplasmin. The remaining quantity is bound to albumin or amino acids [30,31].
5
Figure I.2. Pathway of copper in the body - The blocks in Menkes and Wilson diseases (Mercer, J.F.B.
TRENDS, 2001)
Copper (Cu) plays fundamental role in the biological activity of cuproenzymes. Cu is involved in composition of macromolecules structure by coordination chemistry. Among important physiological Cu-based enzymes include ceruloplasmin, cytochrome C oxidase, dopamine β-monoxygenase, lysyl oxidase, peptidylglycine α-amidating monooxygenase, superoxide dismutase, or tyrosinase. These proteins are essentials in fetal/infant development and growth, brain development and function, immunity, bone strength, cholesterol and glucose metabolism, myocardial contractility, maintenance of hair and skin, and the formation of pigments [30-32].
Essentiality of Cu in human organism does not exclude some unwanted activities that may arise from imbalance or malfunction. When it is attached to histidine, cysteine, and methionine moieties Cu binding can lead to inactivation of many proteins. Reactive oxygen species (ROS) such as superoxide and hydroxyl radicals, produced by Cu mediated Fenton-like chemistry, may cause damaging consequences if they are not detoxified efficiently [33,34]. The following equations show the example of Fenton-like equation mediated by Cu compounds:
6
LCu(II) + H2O2 → LCu(I) + ●OOH + H+ Equation (1) LCu(I) + H2O2 → LCu(II) + ●OH + H- Equation (2) Where L = organic ligand
Fortunately the organism is protected by some molecules ensuring the maintenance of copper homeostasis. This is the role of macromolecules such as copper-transporting P-type ATPases (ATP7A; MNK), Menkes and Wilson proteins, and copper chaperones. Cu imbalance has been associated to some known conditions including Menkes disease (i.e., copper deficiency disorder) and Wilson disease (i.e., copper toxicosis condition). Nutritional copper deficiency may also lead to a decrease of systemic Cu carrier protein, ceruloplasmin, which can result in anemia [35,36].
I.3.3. Copper(II) complexes as potential therapeutic agents
It has been proved that chemical-metal redox system generates ROS which can cause DNA breakage. Cu-mediated oxidation also results in ROS formation with DNA damaging effect [37,38]. A number of Cu(II) coordination compounds demonstrate DNA cleavage activity depending on the nature of ligand. Actually an appropriate ligand (L) would allow not only a reduction of LCu(II) but also an oxidation of LCu(I) [33,39]. Some compounds need the activating agents to initiate DNA cleavage activity while others do not. A cytotoxic complex, [CuII(pyrimol)Cl] (i.e., Hpyramol = 4-methyl-2N-(2-pyridyl methyl)amino-phenol), was reported to have the DNA cleavage activity without intervention of an activating agent DNA [40].
Oxidative properties of Cu(II) coordination compounds has evolved very interesting applications. Rosa F. Brissos and colleagues have reviewed potential uses of Cu(II) complexes in oxidative catalysis, cancer chemotherapy, and Alzheimer’s disease [41]. In another study Cu(II)-based coordination with NSAIDs showed that they are much more effective with less side effect (e.g., gastric upset) compared to their parent anti-inflammatory agents [42]. Other report claims that coordination chemistry of Cu(II) could be a remedy to antibiotic resistant species such as methicillin resistant staphylococcus aureus (MRSA) [43]. Furthermore, Cu(II) complexes showed properties of antiviral [44] and enzyme inhibitors [45].
7
Promising Cu(II) complexes are already in different phases of clinical trials. Kubiak, K. et al. reported a significant increase activity of antioxidant enzymes (i.e., catalase and superoxide dismutase) in patients with colorectal cancer treated by pyrazoles based Cu(II) coordination compounds [46]. University of Utah has already completed Phase I study of co-administration of disulfilam with copper gluconate for the treatment of refractory malignancies that have metastasized to the liver. In other clinical study Copper-L-histidine has been tested in phase II clinical trial for the treatment of Menkes disease [47].
I.3.4. Biological activity of Cu(II) complexes with Schiff base ligands
Schiff bases, named after German-Italian chemist Hugo Joseph Schiff (1834-1915), are also known as imines or azomethines. They have a general formula of R3R2C=NR1 where R2 and R3 represent alkyl, aryl, heteroaryl, hydrogen whereas R1 can be an alkyl, aryl, heteroaryl, hydrogen or metallo (usually Si, AL, B, Sn) [48]. Uncomplexed imines have a wide range of biological activity with potential applications in treatment of diseases such as malaria, bacterial, fungal or viral infections [49].
Complexes between Schiff bases and Cu(II) are attracting many scientists due to their therapeutic potential. Hydrazine derivatives and their corresponding Cu(II) coordination compounds have been studied by Rosa F. Brissos and colleagues [50]. Their findings showed that some of these ligands and their complexes were very cytotoxic to several cancer cell lines as it was evidenced by IC50 values. Bernadette S. Creaven et al. investigated Cu(II) complexes of quinolinone-derived Schiff ligands in-vitro using human hepatic carcinoma cell line and microorganisms. These compounds showed anti-tumor and antimicrobial activities against the fungus, Candida albicans, Gram-positive and Gram-negative bacteria [51]. Another study conducted by Yan Xiao and co-workers, Glutamine Schiff base Cu complex demonstrated a selective inhibition of proteasomal chymotrypsin-like activity (i.e., a valid antitumor approach) and cell death in breast cancer cells [52].
8 I.4. Analytical techniques
I.4.1. Principles of Agarose Gel Electrophoresis (AGE)
Gel electrophoresis is a simple and a powerful technique used to separate macromolecules (e.g., nucleic acids, nucleotides, amino acids, proteins, peptides) on the basis of size, electrical charge and other physical properties. The molecules in electrophoresis move across a span of gel under the influence of voltage applied to the electrodes (cathode and anode) at the extremes of the gel (figure I.3). AGE has been used for decades in a variety of studies such as drug-resistance, plasmid propagation, and genetic analysis of plasmid [53,54]. Nowadays, different biochemical laboratories use extensively this technique for characterizing pDNA cleavage activity of chemical compounds (e.g., transition metal coordination compounds).
Figure I.3. Principles of gel electrophoresis
AGE is basically composed of an agarose gel, electrophoretic buffer (e.g., Tris-acetate-ethylenediaminetetraacetic acid (EDTA), Tris-borate-EDTA, or Tris-phosphate-EDTA) at approximately 50 mM and pH 7.5 – 78, macromolecular samples (e.g., DNA, protein, etc), a dye or DNA stain (e.g., ethidium bromide (EtBr), SYBR green, etc), and a loading buffer commonly made of xylene, cyanol and bromophenol [15].
Agarose, a purified seaweed polysaccharide polymer without charges, is the most commonly used in gel electrophoresis. It is not soluble in cold water but becomes completely soluble in boiling water. Agarose is not a toxic substance, and hence safe to manipulate. Moreover, with AGE procedure there is possibility of recovering unaltered nucleic acid sample for ultimate studies [15,55].
9
Agarose gel is prepared by suspension of dry agarose powder in aqueous buffer. The mixture is boiled until a clear solution is obtained after melting the agarose. This solution is poured onto a gel-tray and allowed to cool down to room temperature in order to have a rigid gel. The obtained agarose gel contains large pores size where molecules can pass across during electrophoresis [56].
I.4.2. Fluorescence spectroscopy
At room temperature, most substances molecules are at their lowest vibration level of the ground state. When they absorb energy, some molecules will move electrons from ground state (S0) to an excited state (Sn). Relaxation from excited state to grounds will be accompanied by an emission of photos. This emission process is called luminescence and can be divided into fluorescence or phosphorescence (figure I.4). Fluorescence spectroscopy is an analytical procedure which basically measures the emitted light (photos) by a sample of substance after being excited.
10
Fluorescence occurs when an emission is a result of an electron relaxation from excited singlet state to ground state. This means that the excited electron has opposite spin to the second electron in the ground-state orbital. Therefore, relaxation of excited electron back to the ground state orbital will be allowed. Phosphorescence results from triplet excited states where the electron in excited orbital has the same spin orientation as the electron in the ground state. Electron relaxation requires that spin orientation changes, otherwise the return of excited electron to the ground state is forbidden. The magnitude of emissive rates of fluorescence is faster than that of phosphorescence, 108 s-1 and 103 to 100 s-1, respectively [57,58].
Fluorescence intensity may be decreased in a process known as quenching. Quenching may occur due to the collision by other molecules (i.e., quenchers) added in the fluorescence system. Quenchers can also decrease the fluorescence by formation of non-fluorescent complex with fluorophore (i.e., fluorescent chemical compound) [58]. The dynamic quenching is concentration-dependent as it is described in the Stern-Volmer equation:
IoI = 1 + Ksv [Q] Equation (3)
In the above expression I0 and I are, respectively, the fluorescence intensities in the absence and presence of a quencher. Plotting I0/I as a function of [Q] yields a linear plot with a slope equal to Stern-Volmer quenching (KSV).
Fluorescence spectroscopy technique is commonly employed in DNA interaction studies. EtBr has been widely used as a model in fluorescence spectrocopy procedures. By interacting with DNA, the fluorescence of EtBr intensifies significantly [59]. The displacement of EtBr by quencher substances, such as metal complexes, decreases the fluorescence intensity and this can be quantified by applying the Stern-Volumer equation [57]. Therefore, fluorescence-based EtBr displacement assay helps to study the potential interactions between DNA and chemical compounds.
11
I.4.3. Ultraviolet Visible (UV-vis) Spectroscopy
Organic chemical molecules with conjugated systems (i.e. alternating single and double bonds) absorb light in the ultraviolet (150–400 nm) or in the visible region (400–800 nm) of the electromagnetic radiation [60]. When an electromagnetic radiation passes across a sample of this substance, the intensity of radiation is decreased. The measurement of the energy decrease is known as absorbance. The absorbed energy is associated to the electrons excitation process from ground (i.e., lower energy level) to excited (i.e., higher energy level) state [61].
The absorbance of a solute in solution is concentration dependant. A spectroscopic evaluation of absorbance provides qualitative and quantitative information on substance [62]. According to Beer-Lambert law, the absorbance, A, is a linear function of the molar concentration, c, of the substance:
A = ε x l x c Equation (4)
Where ε represents the molar absorption coefficient (M-1
cm-1) and l is the cell path length (cm).
UV-Vis absorption spectroscopy is used to measure DNA interactions with chemical compounds. Assessment of these interactions can be carried out by recording the absorption spectra in free and bound states. Comparison of absorption spectrum of free to bound compound provides information for predicting any potential interactions with DNA [18]. This information is mathematically estimated by calculating intrinsic binding constant (Kb) using the following equation:
[DNA ] εa−εf = [DNA ] εo−εf + 1 Kb (εo−εf) Equation (5)
Where [DNA] is the concentration of DNA in base pairs, εa corresponds to extinction coefficient observed at the given DNA concentration, εf is the extinction coefficient of the free complex in solution (Abs/[Complex]), and ε0 is the extinction coefficients of complex when it is fully bound to DNA. The plot of [DNA]/(εa - εf) versus [DNA] gives a slope corresponding to 1/((εa - εf) and y-intercept equal to 1/Kb (εa - εf) , respectively. Therefore, the constant Kb is the ratio of the slope to intercept.
12
I.4.4. Nuclear magnetic resonance spectroscopy (NMR)
In NMR process, molecules, atoms, electrons, or nuclei are excited from the lower energy to upper levels. The energy change ΔE associated with a given transition is related to the frequency ν of the radiation by ΔE = γhH where H represents applied magnetic field, h Plank’s constant, and proportionality constant γ which is typical of each variety of nucleus. The nuclear resonance is observed when the frequency ν =
γH/2π. Depending on molecular environments, same kind of nuclei may absorb
different energy. The differences in absorption-line positions are called chemical shifts, δ. The magnitude of these differences is always determined taking into account a standard such as tetramethylsilane [63].
NMR spectroscopy provides information about the specific nuclear isotope, structure around nucleus and motional dynamics of the matter containing the nuclei. Information collected from each magnetic nucleus reports on itself and on its neighborhoods (e.g., connectivity information). NMR is essentially useful in determination of structures of organic molecules, organometallic complexes, proteins, and nucleic acid oligomers [64].
I.4.5. Electrospray ionization mass spectrometry (ESI-MS; positive mode) Mass spectrometry (MS) is a technique used in analytical chemistry to determine a molecular mass, structures, or isotopic abundance of substance. MS is based on ions formation from either organic or inorganic compounds. These ions are then separated by their mass-to-charge ratio (m/z) which helps to detect them qualitatively and quantitatively by respective m/z and abundance. The analyte is thermally ionized by electric fields or impacting energetic electron, ions, or photons. Ionization of molecule (M) can be achieved by removal or addition of an electron to give species, respectively, M•+ and M•- (equation 6).The mass of these species is practically identical to that of original molecule since an electronic mass is very small [65,66].
M + e− → M•+ + 2e− Equation (6)
All molecules in sample should be ionized before being analyzed in a spectrometer. These ions should be also in gas phase prior to their introduction into the vacuum of a mass spectrometer. Gaseous or heat-volatile substances are simply handled while heat
13
labile compounds may decompose upon heating. Therefore, soft ionization technique such as electrospray Ionization (ESI) is used to produce gas phase ions of thermally labile molecules without fragmentation [67].
A mass spectrometer is composed of three basic components including ion source, mass analyzer, and detector (figure I.5). Sample is firstly ionized in an ionization source of spectrometer. Then sample ions are separated in the mass analyzer based on m/z ratio. In the second analyzer some ions are fragmented and the fragments are analyzed. The abundance of emerging ions from the last analyzer is measured. These ions are converted into electric signals by a detector. Finally these signals are transmitted to computer where they can be read and interpreted [68].
Figure I.5.The basic components of mass spectrometer
I.4.6. X-ray crystallography
X-ray crystallography is used to determine the structure of a crystalline solid in three-dimensional space. X-ray wavelength which is on order of 1 angstrom (Å) is employed in this technique. In crystal lattice the atoms are arranged in regular and periodic manner. The interatomic distance is on order of 1 Å which is a magnitude of x-ray electromagnetic radiation. When an X-ray beam is passed through the crystal, a diffracted light provides an equivalent pattern which reflects the structure of crystal. This pattern is then mapped onto electronic density map. Analysis of the map provides the exact arrangement of atoms in the crystals.
14
Instrument for X-ray chromatography is typically made of a source which shoots x-rays at single crystal, a device to select and restrict the wavelengths, a holder for the sample, a detector collecting the diffraction patterns, a signal converter, and readout. In order to determine the molecular structure by x-ray chromatography, single crystal of substance is required. In organometallic chemistry a reaction is conducted in solvent under heating so that a product is obtained in solution. Crystals grow as long as solution is cooling down while the solvent slowly evaporates [69,70].
I.4.7. Infrared spectroscopy (IR)
Infrared (IR) spectral region extends from the red end of visible spectrum to the microwave region with wavenumbers ranging from around 14.000 to 20 cm-1, or wavelength from 0.7 to 500 μm. IR region is divided into near (NIR), middle (IR or mid-IR) and far (Fmid-IR) sub-regions. Analytical applications by IR in chemistry are essentially carried out in the middle region, 4000 to 500 cm-1 or 2.5 to 20 μm [71].
Depending on applied energy all molecules in a matter perform movement of translation from place to place, rotation in space, and vibration. IR spectroscopic studies of substances are based on vibration motion which involves either a change in bond angle (bending) or bond length (stretching) (figure I.6) [72].
Figure I.6.Stretching and bending vibration
When an IR radiation from a continuous source passes through the sample compartement of the spectrometer (figure I.7) some photos are absorbed and do not reach the detector. IR spectrum displays these missing photos (i.e., absorptions) as series of well-defined, characteristic, and reproducible absorptions bands. The non absorbed photons are then transmitted to the detector unaltered. IR spectrum is displayed by a detector as a percent transmittance (%T) on the Y-axis, and IR frequency in terms of wavenumber (cm-1) on the X-axis [71].
15
Figure I.7.Basic elements of a Spectrometer
Each chemical compound has its unique infrared spectrum. Some laboratories and research centers have established libraries of reference spectra [73,74]. In principle one could match the obtained spectrum of an unknown compound with the library and find the identity of that chemical compound. A correlation table gathering stretching motions of bonds can be also used when it is a new compound or in case of absence of spectrum in database.
I.5. Cells culture techniques
Cells are the basis of all living things from unicellular (e.g., bacteria) to multicellular organisms (e.g., animals and plants). Animal and plant cells have some common structures such as nucleus, cytoplasm, cell membrane, mitochondria and ribosomes. Protective cell wall is common for both plant and bacterial cells. However, the bacterial cell wall is more flexible than that found in plant cells [75].
Bacteria are procaryotic cell which simply means unorganized Nucleus. They do have DNA located in an area known as nucleoid [76,77]. In microbes genetic information is carried in chomosomal DNA whereas other extra information is located in a pDNA. The plasmid plays a central role in protecting bacterial cells in distress situation such as resistances on antibiotics [78] and heavy metals [79].
Under favorable conditions cells grow in terms of development and reproduction. This implies the increase in cytoplasmic constituents and cell populations. Cells can be grown in order to have a larger number which is needed for biochemical studies [80]. Microbial cell culture is one of research tools in molecular biology for various purposes. The culture should fulfil maximum preriquisites allowing cells to grow. These conditions
16
include nutritional components of the culture medium, correct pH and temperature [81]. Bacteriologists extensively use a medium known as Luria-Bertani (LB) broth which provide advantages of fast growth and good growth yields for many species [82].
It is important to mention that the growth of bacterial culture is composed of consecutive phases which are accompanied by variation of growth rate [83]. Escherichia coli (E. coli) growth curve presents four major phases including lag phase, log or exponential growth phase, stationary phase (or saturation phase), and death phase (figure I.8). At early log phase E. coli cells are used to make competent cells and cell stocks. In contrary, at stationary phase cells stop growing and metabolic products accumulate. At this phase cells have a good amount of pDNA. Therefore, at saturation phase E. coli cells are used in plasmid production [84].
Figure I.8.E. coli cells growth curve with its phases.http://www.exptec.com/retrieved on 13-06-2015
Plasmids are used to multiply or express genes. They are also used in production of large amounts of protein or studying the nuclease activity of chemical compounds. In order to be used pDNA are basically extracted from bacteria and used as extracellular DNA. The process of DNA isolation from bacteria consists of cell lysis and DNA solubilization followed by enzymatic or chemical methods to remove contaminating proteins, ribonucleic acid (RNA), and other macromolecules [85].
17 II. EXPERIMENTAL PART
II.1. Methodology
In this work a Schiff base ligand LH, 2-(pyridin-2-yl)hydrazono)methyl)phenol, and its complex with copper(II) were synthesized according to literature [50]. Compound [Cu(L)Cl](CH3OH) was prepared by coordination reaction between copper(II) chloride dihydrate (i.e., CuCl2.2H2O) with ligand LH. DNA-binding and nuclease activity of [Cu(L)Cl](CH3OH) were investigated by spectrophotometric DNA titration, fluorescence-based EtBr displacement assay, and AGE using Sc DNA. Furthermore, DNA cleavage testing of metal complexes (i.e., copper and vanadium based coordination compounds) in cells was performed. MACH-1 E. coli cells were cultivated and then treated by [Cu(L)Cl](CH3OH) and VO(acac)2. A technique known as “Boiling lysis miniprep” was employed for bacterial DNA purification from E. coli cells. The obtained DNA was then electrophoresed to check the nuclease activity of complexes on E. coli bacteria.
II.2. Synthesis and characterization II.2.1.Materials
Solvents and reagents of analytical grade were commercially purchase and used as received. They were obtained from Aldrich, Acros Organics, Panreac Quimica SA, TCI Europe, Liofilchem s.r.l., Merck KGaA, Carl Roth GmbH + Co. KG, or BDH Ltd. pBR322 DNA was purchased from Roche Farma S.A. Calf thymus DNA (ct-DNA) was purchased from Sigma-Aldrich. pA1 DNA (100 μg/mL) was prepared by Nataliya Butenko at University of Algarve.
II.2.2. Physical measurements
Proton (1H) spectra were recorded at room temperature with Varian Mercury 400 MHz spectrometer. Proton chemical shifts are expressed in parts per million (ppm, δ scale) and are referenced to the solvent peak. IR spectra (in KBr pellets) were recorded using a Nicolet-5700 FT-IR (in the range of 4000-400 cm-1), UV-vis experiments were performed with a Varian Cary-100 (at University of Barcelona) and Varian Carl-50 (at University of Algarve) spectrophotometers. The fluorescence measurements were carried out with iHR 320 spectrofluorometer.
18
[Cu(L)Cl](CH3OH) was dissolved at room temperature in DMSO solvent (5 mM), and the solution was frozen in liquid nitrogen. ESI-MS was carried out using a LC/MSD-TOF spectrometer (Agilent Technologies) equipped with an electrospray ionization (ESI) source at the Serveis Cientificotècnics of the Universitat de Barcelona. X-ray data were recorded at 190(2) K on a Bruker APEX II equipped with a CCD area detector and a graphite monochromator (MoKα radiation λ = 0.71073 Å).
II.2.3. Synthesis and characterization of ligand (LH)
10 mmol of 2-hydrazinopuridine and 10 mmol of salicylaldehyde were dissolved in 10 mL of methanol. The two solutions were then mixed in a 100-mL round-bottom flask. Condensation reaction in refluxed methanol between 2-hydrazinopuridine and salicylaldehyde was performed on a magnetic stirrer hot plate (90ºC) (figure II.1). After 4 hours pure ligand was filtrated and dried under vacuum.
Yield: 1.225g (5.7mmol, 57%). 1NMR (DMSO, 400MHz): δ=10.86 (S, 1H), 10.54 (S, 1H), 8.26 (S, 1H), 8.09-8.11 (m, 1H), 7.60-7.2 (m, 1H), 7.54 (dd, Ј= 7.7, 1.5Hz, 1H), 7.20-7.14 (m, 1H), 7.01 (d, J= 8.4, 1H), 6.88-6.82 (m, 2H), 6.75 (ddd, J=7.1, 5.0, 0.8Hz, 1H)ppm. IR (KBr, cm-1): 3186, 3103, 3054, 2982, 1602, 1541, 1492, 1446, 769. MS (ESI+): m/z=214.0824 ([C12H11N3O+H]+).
Figure II.1. Synthesis of 2-(pyridin-2-yl)hydrazono)methyl)phenol (LH) by Schiff based reaction between
2-hydroxybenzaldehyde and 2-hydrazinopyridine.
II.2.4. Synthesis and characterization of complex [Cu(L)Cl](CH3OH)
A methanolic solution (10 mL) of ligand LH (100 mg, 0.467 mmol) was added to methanolic solution (10 mL) of copper(II) chloride dihydrate (64 mg, 0.38 mmol) and refluxed on the magnetic stirrer hot plate (90oC). The resulting dark green reaction mixture was filtered and the filtrate left for the solvent to slowly evaporate. After two
19
days, dark green crystals of [Cu(L)Cl](CH3OH) were obtained and isolated by filtration under vacuum.
Yield: 77.92 mg (46.8%) IR (KBr, cm-1): 3373, 3171, 3126, 3083, 3038, 2934, 1625, 1600, 1571, 1531, 1479 1445, 756. MS (ESI+): m/z=275 ([C12H10N3OCu-Cl]+).
II.2.5. X-Ray crystallography of complex [Cu(L)Cl](CH3OH)
Crystals of complexes [CuLCl].CH3OH was picked up on Pasteur pipette and used for data collection. Data were recorded at 190(2) K on a Bruker APEX II equipped with a CCD area detector and a graphite monochromator (MoKα radiation λ = 0.71073 Å). II.2.6. Stability test of [Cu(L)Cl](CH3OH)
[Cu(L)Cl](CH3OH) stability has been tested by UV-vis spectroscopy technique for 0.3 mM in 0.5% DMSO and in 100% DMSO. Samples solutions were diluted in cuvettes to 0.045 mM before recording UV-vis absorption spectra in the range of 200-500 nm.
Instrumentation: cary 50 spectrophotometer, 2 quartz cuvettes Preparation of solutions
Stock solution of 0.3 mM [Cu(L)Cl](CH3OH) in 0.5% was prepared by sonicating (3 minutes) 2.6 mg of [Cu(L)Cl](CH3OH) crystals in 125 μL of DMSO. The resulting solution was transferred into 25-mL volumetric flask and then the volume has been adjusted with MilliQ water.
A stock solution of 0.3 mM [Cu(L)Cl](CH3OH) in 100% DMSO was prepared by sonication (3 minutes) of 2.6 mg of [Cu(L)Cl](CH3OH)crystals in 1 mL of DMSO. The resulting solution was then transferred into 25-mL volumetric flask. The volume (25 mL) was adjusted by addition of DMSO.
Solutions for baselines were 0.5% DMSO solution (0.125 mL DMSO + 24.875 mL MilliQ water) and 100% DMSO solvent.
Procedure: Baselines were recorded by filling 2 quartz cuvettes with solvents (0.5% or
100% DMSO). The baseline spectra were saved in a file to be reused for subsequent samples spectra measurement. After measuring baselines, one of the cuvettes was
20
filled with 1 mL of 0.045 mM solution of either 0.5 % DMSO or 100% DMSO. Between measurements, cuvette was always washed by solvent and then solution was passed before filling it with sample solution. UV-vis spectra were recorded between 200 and 500 nm for 0.0, 0.5, 1.0, 2.0, 4.0, 24.0 hours by Scan Software Version 02.00(25). Scan rate was 4800 nm/min while the data interval was 1 nm.
II.3. DNA binding studies
II.3.1. UV-visible spectroscopy
Preparation of solution: Cacodylate buffer and [Cu(L)Cl](CH3OH)preparation is described in the section of Agarose gel electrophoresis
Procedure: Two quartz cuvettes were used: one cuvette was loaded with 3 mL of 1mM cacodylate/20 mM NaCl buffer (pH 7.19) and the other one with 25 μM solution of [Cu(L)Cl](CH3OH) in cacodylate buffer (pH 7.19). The absorption titrations were performed by sequential addition of increasing amount (from 0 to 50 μM) of ct-DNA 25 μM [Cu(L)Cl](CH3OH) solution.
The A260/A280 ratio was calculated in order to determine the purity of ct-DNA. ct-DNA in 1mM cacodylate/20 mM NaCl buffer (pH 7.19) gave a ratio of 1.87:1 of UV absorbance at 260 and 280 nm, which indicates that the DNA was sufficiently free from protein [86]. The electronic absorption spectra were recorded from 200 to 500 nm using Varian Cary 100 Scan UV-vis spectrophotometer. Increasing amount of ct-DNA were added to a 25-µM solution of [Cu(L)Cl](CH3OH), mixed by pipetting (three times), and left for five minutes to equilibrate at room temperature.
II.3.2. Fluorescence spectroscopy
Relative binding affinity of complex [Cu(L)Cl](CH3OH) to ct-DNA was studied by fluorescence spectral method with EtBr-bound DNA in 1 mM cacodylate/20 mM NaCl buffer (pH 7.21). The complex stock solution was prepared in 100% DMSO. The experiments were carried out at constant concentrations of ct-DNA and EtBr, respectively, 25 µM and 25.36 mM, by adding increasing amount of [Cu(L)Cl](CH3OH) (from 0 to 100 µM). The solution of ct-DNA and EtBr in 1mM cacodylate/20 mM NaCl buffer (pH 7.21) was incubated for 1 h at 37ºC before spectra recording. Fluorescence
21
spectra were recorded at room temperature with excitation and emission wavelengths, λext and λem, of 514 and 610 nm, respectively.
II.4. Cell culture
II.4.1. Preparation of Luria-Bertani (LB) medium
LB medium was prepared by dissolution, under stirring, tryptone enzymatic (10 g), yeast (5 g) and sodium chloride (10 g) in 1L of water. pH was adjusted to 7.38 with 2.097 M NaOH and then autoclaved for 20 minutes at 121ºC in RAYPA steam sterilizer. After sterilization the mixture of LB broth was split into six bottles (three of 100 and three 250 mL blue screw cap bottles) and stored at 4ºC in fridge.
II.4.2. Growing bacteria in a culture
150 μL of ampicillin was added to 150 mL of LB broth and shaken well to mix. 100 mL of the mixture was then transferred to 500 mL Erlenmeyer (autoclaved). Aliquot of Mach-1 E. coli bacteria cells was taken on ice from -78ºC freezer. After thawing bacteria an inoculation loop was used to seed Mach-1 cells in LB medium. Erlenmeyer containing culture was covered by aluminium foil and placed at 37ºC and 210 rpm in Innova 4230 Refrigerated-shaker. After 13 h (overnight) optical density (OD) of the cell culture was monitored. The bacterial culture was opened under flame and 1 mL of sample was pipetted and diluted 1:10 before OD measurement. OD was measured using plastic cuvettes in SHIMADZU UV-1700 spectrophotometer at 600 nm.
II.4.3. Treatment of E. coli bacteria by [Cu(L)Cl](CH3OH) and VO(acaca)2 Preparation of solutions
2 mM VO(acac)2 and 2 mM [Cu(L)Cl](CH3OH) stock solutions were prepared by dissolving 26.5 mg and 34.4 mg, respectively, in 50 mL of MilliQ water. [Cu(L)Cl](CH3OH) crystals were sonicated (three minutes) in 250 μL DMSO and then adjusted to 50 mL by MilliQ water. Therefore, the final solutions consisted of 0.5% DMSO.
22
Dilutions were performed accordingly from stock solutions in order to have the required concentrations of compounds. For VO(acac)2 solutions of 0.25, 0.5, 1, and 2 mM have been prepared whereas 2 mM [Cu(L)Cl](CH3OH) and 2 mM MPA stock solutions were used without further dilution.
Treatment: After 13 h of incubation the the bacterial culture OD600 of 1.6 was measured. Under flame, grown cells were aliquoted into ten 50 mL conical screw cap tubes (falcon) which were labelled 1 to 10 for samples identification. After loading compounds in the culture samples (table II.1) tubes with mixtures were placed back at 37ºC and 210 rpm in Innova 4230 Refrigerated-shaker. Then after 1, 2, 4, and 8 h of incubation 2 mL of culture was taken from each sample and aliquoted into 2 separate eppendorfs (1.5 mL and 0.5 mL). Eppendorfs with 1.5 mL were placed in support and stored in freezer (-20ºC) while 0.5 mL was immediately used to measure absorbance (OD600) of samples.
Table II.1. Composition of sample culture after loading compounds
Components 1 2 3 4 5 6 7 8 9 10 E. coli culture (mL) 5 5 5 5 5 5 5 5 5 5 Fresh LB (mL) 5 4.95 4 4 3 4 4 4 4 0 100% DMSO (μL) 0 50 0 0 0 0 0 0 0 0 100% DMSO (mL) 0 0 0 0 0 0 0 0 0 5 2 mM MPA (mL) 0 0 1 0 1 0 0 0 0 0 2 mM [Cu(L)Cl](CH3OH) (mL) 0 0 0 1 1 0 0 0 0 0 0.25 mM VO(acac)2 (mL) 0 0 0 0 0 1 0 0 0 0 0.50 mM VO(acac)2 (mL) 0 0 0 0 0 0 1 0 0 0 1.00 mM VO(acac)2 (mL) 0 0 0 0 0 0 0 1 0 0 2.00 mM VO(acac)2 (mL) 0 0 0 0 0 0 0 0 1 0
23 II.5. DNA purification
DNA was isolated from Mach-1 E. coli cells according to “boiling lysis miniprep” technique [87]. All materials were autoclaved for 20 minutes at 121ºC in RAYPA steam sterilizer.
Instruments: CT 15RE centrifuge, boiling plate, 500 mL Erlenmeyer, micropipettes and
tips, 10 mL plastic pipettes, toothpicks, 1.5 mL microcentrifuge tubes (Eppendorfs), gloves, and ice.
Chemicals and reagents: STET, Lysozyme stock solution, isopropanol, 70% ethanol,
RNAase (10 mg/mL), Millipore (MilliQ®) water.
Preparation of STET solution: 100 mL of STET solution was prepared in MilliQ water
with 8% (wt/vol) sucrose, 5% (wt/vol) Triton X-100, 50 mM EDTA, pH 8.0, and 50 mM Tris-HCl, pH 8.0. After the preparation STET solution was sterilised and stored at 4ºC.
Preparation of Lysozyme stock solution (10 mg/mL): 10 mL of lysozyme stock
solution was prepared by dissolving 100 mg of lyzozyme, 2.75 mL of 1 M Trish-HCl, pH 8.0 and 7.5 mL of MilliQ water. The resulting solution was then sterilized in autoclave and stored at -20ºC.
Extraction of DNA from bacteria: It important to remind that 1.5 mL was sampled
(from each treated and control bacterial sample), transferred in 1.5-mL eppendorfs, and then stored at -20ºC. Isolation of DNA from Mach-1 E. coli cells was carried out in following steps:
1. Take samples of bacterial culture in 1.5-mL eppendorfs from freezer (-20ºC) and thaw them.
2. Pellet the cells by spinning at 4ºC for 1 minute at 11,000 rpm in CT 15RE microcentrifuge and discard supernatant.
3. Resuspend the bacterial pellets in 700 μL of STET and 25 μL of lysozyme stock solution. Voltex to achieve complete suspension.
4. Place tube on ice for 5-10 minutes.
24
6. Spin at 4ºC in CT 15RE microcentrifuge for 10 minutes at 11,000 rpm. 7. Pull out snot pellet with sterilized toothpicks.
8. Add 700 μL of room temperature isopropanol. Mix tubes by inversion
9. Spin at 20ºC in a CT 15RE microcentrifuge for 10 minutes at 11,000 rpm. A small white/clear pellet forms.
10. Remove supernatant. 11. Wash with 70% ethanol
12. Dry pellet and resuspend in 50 μL MillQ water containing 20 μg/mL RNAase A. II.6. Agarose Gel Electrophoresis (AGE)
Interaction between DNA and metal complexes [Cu(L)Cl](CH3OH) was studied by AGE at University of Barcelona and at University of Algarve under different electrophoretic conditions. The complex was tested on isolated pDNA (i.e., pBR322 and pA1) and inside living cells using Mach-1 E. coli bacterial culture. Cell culture was carried out at University of Algarve.
II.6.1. AGE at University of Barcelona
Instrumentation: BIORAD horizontal tank, PHARMACIA GPS 200/400 variable
potential power supply, BIORAD Gel DocTMEZ Imager, and incubator.
Preparation of solutions
500 mL of 1mM cacodylate/20 mM NaCl buffer (pH=7.21) has been prepared by dissolving 107 mg of sodium cacodylate trihydrate and 584.4 mg of sodium chloride (NaCl) in MilliQ water. pH was adjusted to 7.19 by adding drops of concentrated HCl. The cacodylate buffer solution was labelled and stored at 4ºC.
Stock solution of 20 mM [Cu(L)Cl](CH3OH) was prepared by sonicating (3 minutes) 6.2 mg of [Cu(L)Cl](CH3OH) crystals in 1 mL DMSO. The resulting solution was diluted to different concentrations (i.e., 2.0, 1.0, 0.5, 0.25, and 0.05 mM 10% DMSO) by addition of cacodylate buffer (pH=7.19).
25
Ascorbic acid stock solution (100 mM) was prepared by dissolving 7.2 mg powder in 420 μL of cacodylate buffer (pH=7.19). Afterwards stock solution was diluted to 1 mM by cacodylate buffer before being loaded in samples.
pBR322 DNA was purchased from Roche and has been diluted before being used. 5 μL (1.325 μL pRB322 DNA + 3.675 μL MilliQ water) was added in each sample.
Agarose gel preparation: 1.5 g of agarose powder was transferred into 250-mL
Erlenmeyer and dissolved in 150 mL 1x TAE. The mixture was heated in microwave oven for approximately 2 minutes at 800W. The solution was cooled down by swirling the flask by hand. The liquid was poured in the horizontal mould, any bubbles were removed using a pipette tip, and then left for 1 hour to solidify.
AGE procedure
Each sample was composed of 20 μL made of 13 μL of cacodylate buffer, 5 μL of pBR322 DNA, and 2 μL of [Cu(L)Cl](CH3OH) solution (2.0, 1.0, 0.5, 0.25, and 0.05 mM) 10% DMSO. Volume of cacodylate buffer was decreased to 11 μL in samples where ascorbic acid (2 μL) was added. The mixtures containing pBR322 with [Cu(L)Cl](CH3OH) 0-200 µM were incubated for 24 h at 37oC. Samples with DNA alone and of DNA in the presence of ascorbic acid were used as controls.
After 23 h of incubation 2 µL of ascorbic acid (1 mM) was added to the chosen samples. After the incubation 4 µL of loading buffer was added into samples to stop the reaction. Samples were then electrophoresed in 1% in TAE (Tris-acetate–EDTA) buffer for 1.5 hour at 1.5 V cm-1, using a BIORAD horizontal tank connected to a PHARMACIA GPS 200/400 variable potential power supply. Afterwards, the DNA was stained with SYBR safe and the gel was photographed with a BIORAD Gel DocTMEZ Imager.
26 II.6.2. AGE at University of Algarve
Instrumentation: Electrophoresis chamber and power supply (CONSORT E143) were
used to perform AGE. The visualization and photographing of gels bands were made by Alphalmagel from Alpha Innotech.
Densitometry: Lanes’ densitometry (1-D Multi) in AlphaEaseFCTM software (Alpha Innotech) was used to analyse gel images after electrophoresis. This tool has been used to measure and quantify the intensity of bands in each lane of the electrophoresis gel image.
Preparation of solutions
Stock solution of 80 mM [Cu(L)Cl](CH3OH) was prepared by sonication (6 minutes) of 27.6 mg crystals in 1 mL of DMSO. Stock solution was then diluted correctly using MilliQ water to obtain 5 solutions (1% DMSO) of different concentration (i.e., 800, 400, 200, 100, and 50 μM).
Vanadium acetylacetonate, 100 μM VO(acac)2, was used to linealize DNA for linear control band. It was prepared by dissolution of 1.3 mg crystals in 50 mL of MilliQ water. 2 mM 3-mercaptopropionic acid (MPA), which was used as an activating agent, has been prepared by diluting 17.5 mL of MPA > 99% in 100 mL MilliQ water.
100 mM solution of phosphate buffer was prepared by dissolving 1.74 g of di-potassium hydrogen phosphate (K2HPO4 99%) in 100 mL solution using MilliQ water. pH was adjusted to 7.39 by 0.1 M nitric acid (HNO3) with verification by pH meter.
3-(N-Morpholino)propanesulfonic acid (MOPS buffer), stock solution of EtBr (50 mg/mL), and loading buffer have been prepared by Nataliya Butenko.
A 10x stock of TBE (89 mM Tris-borate and 1 mM EDTA, pH 8.0) was prepared in milliQ water and stored at 4ºC. 0.5x TBE (that has been used to dissolve agarose powder) was prepare by dilution of TBE buffer stock solution (10x TBE).
27
Agarose gel preparation: 1% agarose gel was in 0.5x TBE with 30 μL EtBr (or 2
μg/mL EtBr). Gel has been prepared by dissolution of 1.5 g agarose powder in 150 mL of 0.5x TBE in Erlenmeyer on a hot plate. A gel casting plate was used to form a mould while combs with 15 or 17 teeth were chosen to make gel wells for samples loading. After dissolving agarose the mixture was cooled down by swirling movement in hand on tap water to approximately 60ºC and 30 μL EtBr was added. The solution was then poured into the mould and left at room temperature to gelify. In one hour gel solidified, a comb was carefully removed and a gel was submerged into 0.5x TBE (~ 1 mm depth) in the electrophoresis chamber.
AGE procedure: 2 methods have been used: (1) First procedure was the treatment of
extracellular (isolated) pA1 DNA by complex [Cu(L)Cl](CH3OH) and to check a DNA cleavage. (2) The second method was to treat Mach-1 E. Coli bacteria cells with complexes [Cu(L)Cl](CH3OH) or VO(acac)2 and then purify pA1 DNA. Afterwards, the isolated DNA was electrophoresed to detect the cleavage activity of complexes. DNA cleavage activity has been evaluated by monitoring the conversion of Sc pDNA to Nck and Lin DNA.
1. AGE of free pDNA (outside bacteria cell) – The composition of each reaction sample (in each gel’s well) was 6 μL of MilliQ water, 2 μL of 100 mM of buffer solution (i.e., Phosphate buffer or MOPS), 2 μL (100 μg/mL) of supercoiled pA1 DNA and 10 μL of the aqueous solution of [Cu(L)Cl](CH3OH) with concentrations of 800, 400, 200, 100, and 50 μM. Volume of water has been reduced to 4 μL in samples containing the activating agent (MPA). The Lin DNA control was used as a reference of linearized DNA form. Linear control sample was always made of a mixture of 2 μL of 10 mM phosphate buffer, 10 μL of VO(acac)2, 2 μL of pA1 DNA and 6 μL of MilliQ water.
The samples were incubated at 37ºC for 1 h, wrapped in aluminium foil. After incubation the reactions were quenched by adding 5 μL of loading buffer. Samples were then loaded to 1% agarose gel in a horizontal electrophoresis tank submerging in 0.5x TBE buffer. They have been electrophoresed for 3 h at 110 V

 solution measured in 0.5% DMSO at different duration after the preparation](https://thumb-eu.123doks.com/thumbv2/123dok_br/18623878.910593/46.918.117.794.342.817/figure-normalized-absorption-solution-measured-different-duration-preparation.webp)
 solution measured in 100%](https://thumb-eu.123doks.com/thumbv2/123dok_br/18623878.910593/47.918.129.776.110.503/figure-iii-plot-normalized-absorption-spectra-solution-measured.webp)
![Figure III.5. Plot of [DNA]/(ea-ef) vs. [DNA] for the titration of ct-DNA with complex [Cu(L)Cl]CH 3 OH](https://thumb-eu.123doks.com/thumbv2/123dok_br/18623878.910593/49.918.116.652.117.537/figure-iii-plot-dna-dna-titration-dna-complex.webp)
 (0-100 μM)](https://thumb-eu.123doks.com/thumbv2/123dok_br/18623878.910593/51.918.117.661.608.988/figure-iii-emission-spectra-dna-etbr-complex-increase.webp)
, 5-200 µM, without reducing agent (lanes 2-6) and in the presence of 100 mM ascorbic acid (lanes 8-13) incubated for 24 h at 37 o C and electrophoresed in](https://thumb-eu.123doks.com/thumbv2/123dok_br/18623878.910593/53.918.109.803.605.946/cleavage-increasing-concentrations-reducing-presence-ascorbic-incubated-electrophoresed.webp)
 in increasing complex concentrations 25-400 µM in 10 mM MOPS buffer (lanes 4-8) and in 10 mM phosphate buffer,PO 4- , (lanes 10-14)](https://thumb-eu.123doks.com/thumbv2/123dok_br/18623878.910593/54.918.111.807.574.916/figure-cleavage-increasing-complex-concentrations-buffer-phosphate-buffer.webp)
 under MOPS buffer at different concentration of complex](https://thumb-eu.123doks.com/thumbv2/123dok_br/18623878.910593/55.918.115.806.111.388/figure-quantification-bands-cleavage-buffer-different-concentration-complex.webp)
![Figure III.13. Bacterial cells growth curve of Mach1 - T1 E. coli cells compared to standard cloning strains (this figure was adapted from Invitrogen life technologies) [104]](https://thumb-eu.123doks.com/thumbv2/123dok_br/18623878.910593/57.918.113.759.109.554/figure-bacterial-compared-standard-cloning-strains-invitrogen-technologies.webp)