Copyright © 2018 The Author(s). Published by VGTU Press
This is an Open Access article distributed under the terms of the Creative Commons Attribution License (http://creativecommons.org/licenses/by/4.0/), which permits unre-stricted use, distribution, and reproduction in any medium, provided the original author and source are credited.
*Corresponding author. E-mail: fernando.alberto.ferreira@iscte.pt or fernando.ferreira@memphis.edu
2018 Volume 22 Issue 3: 168–178
https://doi.org/10.3846/ijspm.2018.1541
BARRIERS TO REAL ESTATE INVESTMENTS FOR RESIDENTIAL RENTAL
PURPOSES: MAPPING OUT THE PROBLEM
Adriana S. C. PIRES1, Fernando A. F. FERREIRA1,2,*, Marjan S. JALALI1, Hsiao-Chen CHANG3
1 ISCTE Business School, BRU-IUL, University Institute of Lisbon, Avenida das Forças Armadas, 1649-026,
Lisbon, Portugal
2 Fogelman College of Business and Economics, University of Memphis, Memphis, TN 38152–3120, USA 3 Chinese Culture University, 55, Hwa-Kang Road, Yang-Ming-Shan, Taipei, 11 114, Taiwan ROC
Received 27 December 2016; accepted 27 June 2017
Abstract. The recent economic crisis led to significant changes in the real estate market; one of which was a shift toward home rental (rather than buying). Real estate investors have an important role in the growth of the rental market. However, there are often hindrances to investing for residential rental purposes. In order to overcome these barriers, they first need to be identified and understood. With this in mind, the main focus of this investigation was the creation of a conceptual model, through fuzzy cognitive mapping, to identify and understand the cause-and-effect relationships between the factors that represent an obstacle to real estate investments for residential rental purposes. The results show that cognitive maps can be of great use for the structuring of complex decision problems, minimizing the number of factors left out of the decision-making process. In particular, the tenant risk behavior, property location and associated costs (for the owner) were identified as the main obstacles to real estate investment. The practical implications of the model, as well as the advantages and limitations of the process followed, are also discussed.
Keywords: cognitive mapping, decision aid, investment, renting, residential real estate.
Introduction
Residential rental “horror stories” – of the tenant who never paid the rent on time, the one who “trashed” the house before leaving or of being unable to find a tenant for weeks or months at a time – abound; and although such accounts are anecdotal in nature, they can both influence and reflect very real fears when it comes to investing in property for residential rental purposes.
Rapid changes in the real estate market, aggravated by the 2008 financial crisis, have led people to look for alternatives to buying a home. One of these alternatives is to rent, and indeed, the rental market has seen a gen-eralized rapid growth in the context of current economic conditions (Canas, Ferreira, & Meidutė-Kavaliauskienė, 2015). This could be seen as a golden opportunity for real estate investments for rental purposes. However, in prac-tice, there can be significant barriers to carrying out such investments. From a variety of taxes and fees, to volatile house prices to concerns over collecting rent and property maintenance, such issues can lead to hesitation when con-sidering real estate investments, even for those possessing
or with access to the necessary capital to carry them out. A quick Internet search on the issue turns up myriads of cautionary tales and advice columns about the potential pitfalls of such investments. In the United Kingdom (UK), for instance, “the cost of housing has become a salient
po-litical issue” (Financial Times, 2017). It is estimated that “the UK needs 240,000 homes each year, but only 140,000 are built annually”, and the “government is attempting to address the country’s housing shortage by purchasing £25m worth of shares in a vehicle investing in the private rental sector” (Financial Times, 2017).
Although the specific contours of the issue vary among countries, the ambivalence around what was traditionally considered one of the best investment options is now a reality in most contexts. The aim of the current study is thus to identify the sources of this potential ambivalence –
i.e. the barriers to real estate investments (for residential
rental purposes) and the inter-relationships between them. This is important, because it is only by identifying these hindrances, that effective strategies can be developed to overcome them.
1. Literature review
The real estate market can have an important role in the economic and social development of a region or even country. Maier and Herath (2009, p. 7) define it as “the
market where supply of and demand for real estate meet and where real estate is traded”. Underlying this
defini-tion are three key features that define the real estate mar-ket, namely: (1) “type of real estate” – e.g.: “housing, office,
shopping centers, industrial buildings and infrastructure real estate”; (2) “space”, which refers to the location of the
property; and (3) “time”, which pertains to when the ac-quisition of the property has taken or is taking place, given that this can influence the price charged.
According to Rybak and Shapoval (2011), the real es-tate market is an essential component of any economy, as it accounts for more than 50% of the world’s economic wealth, and is the basis for the functioning of the labor, fi-nancial, commodities and services markets, among others. Real estate assets “are an integral part of an overall
econ-omy”, and as such “changes in real estate value or transac-tion volume may have consequences in almost every sector of the economy” (Maier & Herath, 2009, p. 2). As a result,
the valuation of real estate investments is crucial, and of significant interest to a variety of participants, namely: (1) the sellers and buyers of properties, who need to know the total value of their personal assets; (2) governments and municipalities, whose revenues depend in part on real estate taxes; (3) financial institutions, who aim to imple-ment banking policies with minimized risks; and (4) bro-kerage firms, who need correct real estate evaluations in order to help their clients make decisions (Guo, Xu, & Bi, 2014). In this sense, the real estate market is characterized by investments which hold “the high-risk and high return
of economic activity” (Minli & Wenpo, 2012, p. 1815); and
several methodological studies have been developed with a view to more accurate assessments of investment risk in the sector. Table 1 presents the contributions and limita-tions of some of these studies.
Although Table 1 examines only a small sample of the various studies carried out in the field of real estate, in particular with regard to investment risk in this sector, it reflects the challenges associated with finding suitable ways to measure risk in this context. One of the key limi-tations in this regard has been the overwhelming use of methodologies based on statistical techniques and math-ematical objectivity, which while of great value, exclude from the analysis the subjective dimension of risk meas-urement (Brown & Young, 2011; Ferreira, Santos, Rod-rigues, & Spahr, 2014; Ribeiro et al., 2017). It is hoped that the methodology used in the current study can help bridge this gap, through recourse to techniques which explicitly incorporate subjectivity, and not only identify the determinants of a given decision problem, but also the cause-and-effect relationships between them. The decision problem focused on here relates to the hindrances to in-vesting in real estate for residential rental purposes. The real estate market is subdivided into two main
areas: (1) commercial; and (2) residential (Hill, 2011). Ac-cording to Yunus (2013, p. 136), the commercial aspect is intended for “retail, industrial, office” purposes, such as warehouse and store transactions. The residential area, in turn, is intended for housing and is divided into two branches: (a) residential purchases, which refers to prop-erty acquisition; and (b) residential rental, which focuses on an agreement pertaining to the use of the property, established between the tenant and the landlord, whereby the tenant can enjoy use of the property in return for pay-ment of a rent.
The residential rental market has been increasing in many European countries since the global financial crisis, because buying is typically associated to bank credit, ac-cess to which has become more difficult in recent years (Ferreira, Spahr, Gavancha, & Çipi, 2013). Both lenders and borrowers have been faced with increased risk since the crisis, which has put greater pressure on the cost of financing a property (Winger, 2002). As demand for rent-als increase, so do the opportunities for investment for such purposes. However, it is known that just as it can provide high returns to investments, the real estate market also presents high levels of risk (Ribeiro, Ferreira, Jalali, & Meidutė-Kavaliauskienė, 2017).
According to Brown and Young (2011), research in the field of real estate investments can be broadly di-vided into three categories: (1) risk measurement (which also applies to other fields); (2) the distinction between
discrete and continuous measures of the returns to real estate investments (this return is typically analyzed as
a discrete variable); and (3) the inclusion of subjectivity
into real estate investment decisions (since that
subjectiv-ity is inherent to the sector). The current study can best be positioned in the third group, and aims to build an evaluation model capable of identifying the obstacles to real estate investments for rental purposes, and which encompasses the complexity and subjectivity inherent to such investment decisions.
The model is developed through fuzzy cognitive map-ping techniques, which can serve as an important decision support tool, although our focus is more methodological in nature, rather than pertaining to the dynamic analyses often associated with applications of the Fuzzy Cognitive Map (FCM) approach. In this sense, one of the expected results of this study is to provide a means for increasing transparency in real estate investment decisions, based on the premise that decisions should made on the basis of well-founded information.
The ensuing section presents the literature review. Next, the theoretical background of the techniques ap-plied is provided, followed by the results obtained. The final section concludes the paper, highlighting the study’s contribution and limitations, and presenting avenues for future research.
2. Methodology
2.1. Background on cognitive mapping
Initially introduced by Tolman (1948), the onset of cogni-tive maps as a methodological tool is due to Cartwright and Harary (1956). The authors began their studies in this field, as a result of a need to understand interper-sonal relations. For these authors, “the definition of
bal-ance may be used in describing configurations of many different sorts, such as communication networks, power systems, sociometric structures, systems of orientation, or perhaps neural networks” (Cartwright & Harary, 1956, p.
292). Cognitive mapping thus emerges as a methodologi-cal tool which allows its users to understand the mental representations of a certain individual at a certain point in time (Nicolini, 1999; Jalali, F. Ferreira, J. Ferreira, &
Meidutė-Kavaliauskienė, 2016), allowing complex prob-lems to be structured.
In practice, cognitive maps allow for the understanding of mental representations. Eden (2004, p. 673) describes cognitive mapping as “the representation of thinking about
a problem that follows from the process of mapping”. These
maps can be used as “tools for improving understanding of
system modelling and problem solving [...] to improve self-analysis or communication with others and to conceptualize and analyze complex phenomena in systematic ways”
(Ad-ams & Ntuen, 2006, p. 2). As such, they seem particularly suited to the research problem under study; not only be-cause of the complexity of the problem at hand – the barri-ers to real estate investments for residential rental purpos-es –, but also due to the inherent subjectivity of an issue which in part deals with human emotions, preconceptions Table 1. Contributions regarding real estate investment risk evaluation
Authors Method Contribution / originality Limitations acknowledged by the author/s Wheaton, Torto,
Sivitanides, and Southard (1999)
Retrospective model Allows risk in the real estate market to be compared transversally to the market and types of property.
Due to the difficulties associated to the measurement of the risk of return inherent to this market, it is hard to compare real estate risk with the risk of other assets.
Adair and Hutchison
(2005) Risk analysis model Presents an alternative paradigm of risk reporting based on techniques applied to the business area.
Insufficient data to consistently calculate the standard deviation of the return to each property on the market. Devaney and Weber
(2005) Linear model Obtaining best practice regarding return and risk with respect to the Real Estate Investment Trust (REIT).
Examined a relatively short period of time, which may differ from estimates based on a long period.
Lee and Stevenson
(2005) Risk reduction tests Allows for the development of a successful portfolio for strategy within the real estate market.
There are limitations when the analysis is extended to a multi-asset scenario. M. Lee, M. Lee, and
Chiang (2008) Linear regression model Explains returns on the large-cap REIT. Temporary distortion of the REIT exposure, with regard to the price of commercial real estate which have reached the lowest point.
Cheong, Olshansky, and
Zurbruegg (2011) Graphic modeling/Quantitative computation method
Identifies the real estate sector as an indicator of market uncertainty from stakeholders’ point of view, and anticipates economic bubbles.
Sample considered of unexplained size, timing and range.
Mao and Wu (2011) Fuzzy mathematical
model Adjustment of relevant parameters of options based on risk assessment. The model assumes uncertainty in determining the parameters of revenues and costs, due to the high risk which affects these factors.
Minli and Wenpo
(2012) Comparative analysis model/Fuzzy evaluation method
Solving risk assessment problems in
real estate investment issues. Requires the combination of several methodologies, in order to increase the precision of the analysis and the conclusions.
Hui, Wang, and Wong
(2014) Vector Error Correction Model (VECM)
Provides important implications for investors and governments and serves as a reference for the competent authorities in what pertains to market risk.
The study uses a methodology which is not empirically supported.
La and Mei (2014) Analyses based on the
Timberland (REIT)
classification
Proves the absence of general trends throughout the history of assets, and proves the existence of a potential for long-term diversification in the assets in question.
Information scarcity with respect to the suggested models, making the model less precise.
and even prejudices. Their ability to bring out and visually represent experts’ understanding of decision problems and their underlying variables has seen cognitive maps vari-ously applied in a diversity of disciplines, including urban development, neurophysiology, international relations, management, operational research and decision analysis (see Eden, 2004; Filipe, Ferreira, & Santos, 2015; Ferreira, Jalali, Zavadskas, & Meidutė-Kavaliauskienė, 2017).
Researchers use cognitive maps “to represent
relation-ships and beliefs which are perceived by decision makers to exist among the elements (or objects) in a real environment”
(Adams & Ntuen, 2006, p. 2). In practice, these result in graphs composed by nodes and arrows (Stach, Kurgan, Pedrycz, & Reformat, 2005; Gonçalves, Ferreira, Jalali, & Meidutė-Kavaliauskienė, 2016). Nodes represent concepts relevant to a given scientific domain, and the cause-and-effect relationships between them are represented by ar-rows. Each arrow has associated to it a positive or negative sign, depending on the type of relationship between the concepts. Cognitive maps are particularly suited to situa-tions of information scarcity and uncertainty, and as such are appropriate to the subject under study; that is, the identification of the obstacles to real estate investment for residential rental purposes.
2.2. Cognitive maps and fuzzy cognitive maps
Cognitive maps are not without their limitations, however; in particular in what pertains to their limited ability to represent causality. This causality is typically represented by a set of positive or negative numerical values (Stach et al., 2005). However, due to the qualitative nature of cog-nitive maps, the numerical data associated to them is typi-cally uncertain and hard to obtain, making it difficult to formulate a mathematical model (Carvalho, 2013). With a view to overcoming these limitations, the concept of FCM (Fuzzy Cognitive Map) was introduced (Kosko, 1992).
FCMs thus constitute an extension of cognitive maps (Stach et al., 2005). Kosko (1992, p. 152) defines them as
“fuzzy signed directed graphs with feedback”, reflective of a
dynamic system which “takes its equilibrium behavior as a
forward-evolved inference” (Kosko, 1992, p. 153). The main
objective of the FCMs is the fuzzy representation of cau-sality and causal propagation (Carvalho, 2013), such that the “fuzziness passes into knowledge representations and on
into knowledge bases, where it leads to a knowledge acquisi-tion/processing tradeoff” (Kosko, 1986, p. 65). FCMs thus
add a “fuzzy logic that allows us to predict the change of the
concepts represented in CMs [Cognitive Maps]” (Carvalho
& Tomé, 1999, p. 1).
Within these maps, each concept is characterized by a number, which represents its value and results from the transformation of the real value of the variable and its insertion into the system. It is worth noting that all the values on the map are fuzzy, so each concept takes on a value in the range between [0, 1], and the intensi-ty values of the cause-and-effect relationships are in the range between [–1, 1] (Zadeh, 1965; Carvalho, 2013;
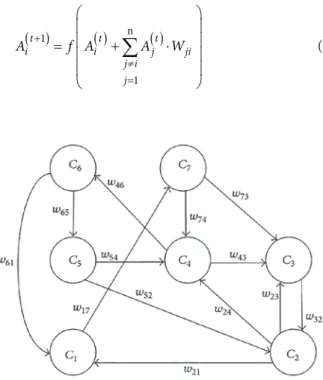
Fer-reira, 2016; F. FerFer-reira, Jalali, J. FerFer-reira, Stankevičienė, & Marques, 2016b). The cause-and-effect relationships be-tween the concepts can then take on three different forms, depending on the type of influence one concept exerts on the other: (1) positive causality, when an increase in the value of one concept leads to an increase in the value of another concept; (2) negative causality, when an increase in the value of one concept leads to a decrease in the value of another concept; and (3) lack of causality, when two concepts do not influence each other (Salmeron, 2009). Figure 1 exemplifies an FCM.
Mathematically, there is a vector 1 x n, which repre-sents the set of values of n concepts and originates the matrix W – an adjacency matrix, consisting of weights
n x n and combining the weights of the links wij
(Fer-reira et al., 2016b). The entries on the main diagonal of the matrix are typically equal to zero, because a criterion rarely causes itself (Kok, 2009). The value of each con-cept is instead influenced by the values of its intercon-nected concepts and its own previous values (F. Ferreira, Jalali, & J. Ferreira, 2016a). Thus, Ai(t+1) represents the
activation level of concept Ci at time t+1; f represents an
initial activation function; Ai(t) is the activation level of
the concept Ci at time t; Aj(t) depicts the activation level
of the concept Cj at time t; and, finally, wji reproduces
the relationship between the two concepts, as per for-mulation (1) (Tsadiras, 2008; Ferreira et al., 2016b). It is worth mentioning that the most common activation (or threshold) functions are as follows: (1) tangent hyperbolic (f(x) = tan (x)); (2) sigmoid function (f(x) = 1/(1 +
e
−x )); (3) bivalent function (f(x) = 0 or 1); and (4) trivalent function (f(x) = –1, 0 or 1) (Papageorgiou, Roo, Huszka, & Colaert, 2012; Glykas, 2013).( )1 ( ) n ( ) 1 t t t i i j ji j i j A + f A A W ≠ = = + ⋅
∑
(1)Figure 1. Example of a fuzzy cognitive map (source: Z. Peng, J. Peng, Zhao, & Chen (2015, p. 2))
In practice, this means that the impact of a change in the value of a given variable is given by a new state vector
Anew, which can be obtained by multiplying the previous state vector Aold by the adjacency matrix W (see Mazlack,
2009). Ferreira and Jalali (2015) exemplify this exercise using three criteria:
– State vector Aold = (1, 0, 1)
– Adjacency matrix W = 0 0.5 0.1 0.5 0 1 1 0.5 0 −
– New state vector Anew = Aold x W = (1, 0, 1) x 0 0.5 0.1 0.5 0 1 1 0.5 0 − = 1 x (0, 0.5, 0.1) + 0 x (-0.5, 0, 1) + 1 x (1, 0.5, 0) = (0, 0.5, 0.1) + (0, 0, 0) + (1, 0.5, 0) = (1, 1, 0.1).
Following this, the weight of the variables can be extracted at the end of the simulation, allowing the sys-tem’s fuzzy logic, and estimated relationships between the variables, to be visualized (Ferreira & Jalali, 2015). FCMs thus represent a system as a set of concepts and mutual relationships between them. They are understood to be neuro-fuzzy systems, able to incorporate and adapt hu-man knowledge; and as such, demonstrate great versatility, having been applied in a large number of areas of knowl-edge and gained momentum due to their simplicity and ease of use (Stach, Kurgan, & Pedrycz, 2010; Ferreira & Jalali, 2015).
3. Application and results
As previously noted, the aim of this study was to identify the barriers to real estate investments for rental purposes, through the development of a fuzzy evaluation model, based on the methodological orientations presented earli-er. The model was created and validated through the direct participation of experts in the field, and aims to contrib-ute to the dissemination of the FCM methodology in the fields of real estate and residential rentals.
Two group sessions were carried out for the model development, with six real estate experts. The participants all had practical experience in the field of real estate in-vestment for residential rental purposes in particular, and included landlords, real estate agents and private investors, operating in the Lisbon metropolitan area. Following the guidelines set out in the literature, the panel size was be-tween three and ten participants, and the same for both sessions (Eden & Ackermann, 2001). Panel members were aged between 34 and 53 years old, and their interaction, as owners or agents of real estate investments, was very important in bringing together and clarifying their differ-ing points of view. The sessions were conducted by two facilitators (i.e. researchers), tasked with moderating the sessions and recording the results.
It is worth noting that the methodological approach adopted was constructivist in nature (see Belton & Stew-art, 2002), such that the focus was on the process fol-lowed, rather than on output alone. As Bell and Morse (2013, p. 962) note, “an appreciation of process is not just
important but vital”. The results obtained through such
processes are naturally subjective, but advantageous in-sofar as, given the necessary adjustments, the technical procedures followed can also work effectively with a dif-ferent group of decision makers (cf. Belton & Stewart, 2002; Ferreira, 2015).
3.1. Developing the fuzzy cognitive map
The first session started with a presentation of the main aims of the study and its methodological approach. At-tention then shifted to the following question posed to the participants: “Based on your personal experience, what are
the deterrents to real estate investment for residential rent-al purposes?” This trigger question initiated and guided
the discussion, serving as the basis for the application of the Strategic Option Development and Analysis (SODA) methodology and the “post-its technique” (Ackermann & Eden, 2001), through which the group cognitive map was built. Fundamental to the process was the ongoing nego-tiation and discussion between the participants, which fostered both learning and a greater transparency in the decision-making process.
The post-its technique invited participants to write the criteria they considered relevant to the problem at hand (in this case, the deterrents to real estate investments for residential rental purposes) on post-its. The rule was that each post-it should contain one (and only one) criterion, and whenever there was a negative cause-and-effect rela-tionship, the post-it was identified with a negative sign (–) in the upper right corner (Kim & Lee, 1998; Ferreira, San-tos, & Rodrigues, 2011; Kang, Deng, Sadiq, & Mahadevan, 2012; Ferreira et al., 2014).
In a second stage, the decision makers were then in-vited to analyze and group the post-its into clusters of re-lated criteria. This was done through a dynamic process of extensive negotiation, as it was required that the group reach a consensus with regard to how the variables should be grouped. Seven clusters were identified: location; risk
behaviors; tenant characteristics; associated costs (for the owner); legal and administrative obstacles; macroeconomic conditions; and indecision/gut feel factors. Having created
the clusters, the experts were then asked to reorganize the criteria within each one in terms of relative importance. It should be noted that variables can be connected to more than one cluster at a time, although this was the exception rather than the rule in this case. Figure 2 illustrates some of the moments of the first group work session.
Using the Decision Explorer software (www.banxia. com), a group cognitive map was created, and provided to the group for analysis and validation (see Figure 3) (an editable version can be obtained from the authors upon request). At the top of the map, unifying the seven
clus-ters identified, was the issue underlying the whole process undertaken, namely “barriers to real estate investment”.
In the second session, the decision makers were asked to quantify the intensity of the relationships of causal-ity among the previously identified criteria, based on a process of collective discussion. The intensity of these relationships or influence between criteria could range between [–1; 1]. This was a particularly time consum-ing phase of the model development, because it required the coming together of the experts’ different opinions to reach consensus. The dynamics of the intensities among the criteria were illustrated with recourse to the FCMap-per (http://www.fcmapFCMap-per.net) and Pajek (http://mrvar.
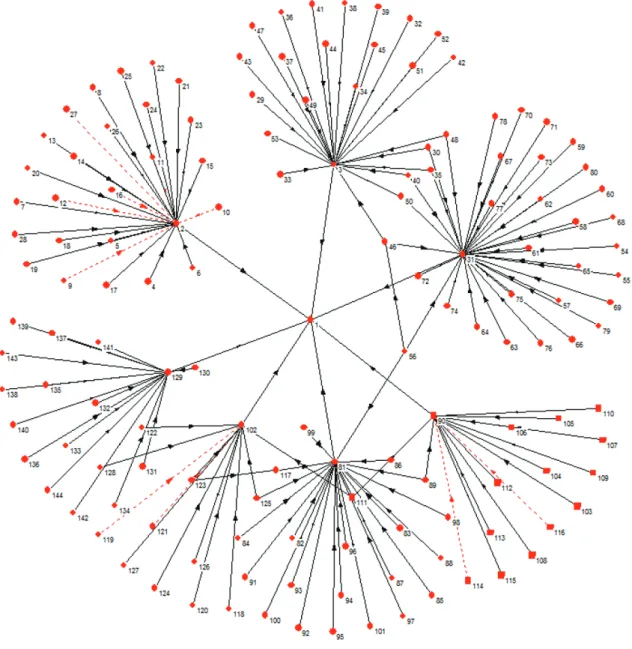
fdv.uni-Lj.si/pajek/) software packages. Figure 4 illustrates the cognitive structure of what would become an FCM, where for simplification purposes, the criteria have been replaced by numbers (it differs in layout from Figure 3 due to the different software packages used; however, a full version of this structure, with the concept names, is available upon request).
Once the FCM structure had been built, the intensities of the various linkages among the criteria were inserted into an adjacency matrix. Participants were asked to pro-vide intensity values for each relationship between two variables, and arrived at the final values through a process of extensive negotiation. Arriving at the intensity values Figure 2. Application of the post-its technique
is often a challenging process, but one that also provides room for discussion and the sharing of experiences among the participants, leading them ultimately to a consensus. The size of the matrix resulting from this consensus pre-vents us from presenting it here; however, Table 2 provides an illustration of the type of matrix developed (the full adjacency matrix can be made available upon request).
Figure 5 exemplifies the case of cluster 3 (i.e. tenant
characteristics), for which the linkages among criteria and
their respective degrees of intensity (within the range [–1; 1]) can be seen. This process was completed by the group for every single cluster.
Figure 4. Basic structure of the FCM
Table 2. Example of an adjacency matrix C1 C2 … Cn-1 Cn
C1 0 w12 … w1n-1 w1n
C2 w21 0 … w2n-1 w2n
… … … …
Cn-1 wn-11 wn-12 … 0 wn-1n
This stage of the session was considered concluded when the cognitive structure developed was validated, consensually, by the group. The next step was then to an-alyze the centrality indices of the main deterrents of real estate investment identified.
3.2. Analysis of the centrality of obstacles factors
According to Carlucci, Schiuma, Gavrilova, and Linza-lone (2013), an FCM allows an initial idea of the ranking among variables to be obtained. Thus, once the degrees of intensity had been defined, it became necessary to calcu-late the levels of centrality of the identified deterrents to real estate investment for residential rental purposes, as well as to perform some additional analyses in order to determine the consistency of the results. Table 3 shows the criteria with the highest levels of centrality (notwithstand-ing that all the criteria previously presented in Figure 4 show levels of centrality).
In practice, according to the decision makers, when an investor intends to acquire a property for residential rental purposes, his/her primary concerns relate to: the tenant
risk behaviors (22.00), followed by location (16.55), the as-sociated costs (for the owner) (16.05), tenant characteristics
(12.05), legal and administrative obstacles (9.00),
macroeco-nomic factors (8.90) and indecision/gut feel factors (8.00)
(the complete list can be made available upon request). As defined by the participants, tenant risk behaviors pertain to the possibility that the tenant will engage in careless or even illegal activities in the property. Thus, it includes behaviors ranging from not taking care of the property or getting into disagreements with the neigh-bors, all the way to subletting, human trafficking and oth-er illegal activities. The location clustoth-er includes a soth-eries of factors relating to where the property is situated; and constitutes the second largest concern in the model, in-sofar as such factors are understood to limit the earnings potential of a potential residential real estate investment. Thus, this cluster includes factors such as the level of noise around the property, the availability (or lack) of nearby Table 3. Main deterrents to investment [based on centrality] Criterion Reference Outdegree Indegree Centrality Tenant risk
behaviors 31 0.80 21.20 22.00 Location 2 0.90 15.65 16.55 Associated
costs (for the owner) 81 0.90 15.15 16.05 Tenant characteristics 3 0.80 11.25 12.05 Legal and administrative obstacles 102 0.80 8.20 9.00 Macroecono-mic factors 90 0.70 8.20 8.90 Indecision/gut feel factors 129 0.50 7.50 8.00
amenities, public transport and parking, and proximity to public housing estates, among others. Associated costs refer to the costs the owner must incur with the investment, such as taxes, condominium fees, repairs and real estate agent commissions. Tenant characteristics encompasses tenants’ or potential tenants’ personal characteristics; for instance, age, nationality, social status, and whether or not they have children, pets or smoke. The legal or
adminis-trative obstacles cluster pertains to the “red tape” involved
in such investments, ranging from having to change one’s correspondence address, all the way to having to investi-gate a tenant or find coercive strategies to force his/her exit. Macroeconomic factors relate to issues well outside the potential investor’s control, but which can nonetheless greatly affect his or her desire to invest for rental purposes. Factors such as interest rates, the ease or difficulty in ac-cess to bank credit and property depreciation are included here. Finally, indecision or gut feel factors refer to variables which appear “small”, but serve as stressors or even deter-rents to such investments. Issues such as having to de-cide who will pay for utilities or ensuring they are indeed paid for, personal life changes, or even the “history” of the property (for instance, if there has been a death there).
These results reinforce some of the results presented by Minli and Wenpo (2012), who identified the follow-ing real estate investment concerns, usfollow-ing a different methodology: (1) political risks and market oscillations; (2) investment risks (i.e. the costs inherent to the entire process, both initial and maintenance); (3) location risks; and (4) type of investment (see also Ribeiro et al., 2017). The results obtained in the current study add to previous research, however, in terms of the identification of more criteria, including more subjective criteria which are often overlooked. The structuring and analysis method followed not only allowed the deterrents to real estate investment to be prioritized, but also allows the effects of oscillations in the intensity of one criteria on the rest of the system to be visualized. Thus, the impact of a change in legisla-tion, for instance, or of the tax payments required, on the system as a whole would be able to be visualized, allowing for better decision making. Such analyses can allow a bet-ter definition of areas of inbet-tervention, which is something traditional methods cannot typically provide.
Conclusion and recommendations
This study recognizes the importance of the real estate market, in people’s lives and as a major driver of the economy; while also acknowledging that there are barri-ers to real estate investments, when these are intended for residential rental purposes. As such, an FCM was devel-oped, with the aim of increasing our understanding of the obstacles faced by real estate investors when investing in a property for later lease.
As noted by Olazabal and Pascual (2016, p. 19), “FCM
is an interesting tool with numerous comparative advan-tages including the ability to simplify a complex decision environment while integrating actors’ different perspectives
and ideas using a semi-quantitative approach”, allowing
for both static and dynamic analyses. The constructivist epistemological approach adopted in this study allowed for a distinctive contribution, in terms of the knowledge sharing it fostered. By focusing on the cognitive structure and the cause-and-effect relationships between determi-nants, it was possible to identify the tenant risk behaviors,
location, associated costs (for the owner), tenant character-istics, legal and administrative obstacles, macroeconomic constraints and the indecision/gut feel factors as the main
deterrents to real estate investments for residential rental purposes.
In terms of practical implications, the use of the FCM approach proved very useful for understanding the bar-riers to real estate investments for rental purposes, en-hancing transparency in what pertains to the identifica-tion of criteria, and furthering knowledge with respect to the cause-and-effect relationships between variables. Understanding the variables creating resistance to these investments is a first step toward helping overcome them. Knowing potential investors’ main concerns can help real estate agents address and assuage them, for instance. In-vestors themselves can mitigate some of their worries, by establishing pdefined rules and procedures, with re-gard to practical issues, such as the payment of utilities for instance, or even in terms of tenant characteristics. Although some issues, such as the macroeconomic con-straints are out of the stakeholders’ hands, merely becom-ing more knowledgeable and informed about such issues can increase willingness to invest. Finally, there seems to be an important role for policy makers in promoting real estate investments of this nature, as many of the obstacles identified pertain to legal and administrative obstacles and costs, such as taxes and fees.
It is worth noting that the direct involvement of the panel of decision makers greatly enhanced the model, giving it greater consistency, functionality and realism. Because of the constructivist nature of the study, much of its contribution is understood to be in the process of learning inherent to the construction of the FCM. In fact, the cognitive structure developed allows for the inclusion of new information, as well as the analysis of its impact. This constitutes one of the strengths of FCMs, and in prac-tical terms means stakeholders (be they investors, banks, agents or policy makers) can use these maps to not only better understand the issue (in this case, obstacles to in-vestment), but also to visualize how changes to variables would affect it. In this sense, the model resulting from the present study can be considered a work in progress, to which it is always possible add and build upon.
Despite the encouraging results, it is worth noting the idiosyncrasy and subjectivity of the model, which consti-tute an important limitation. Notwithstanding, the learn-ing that resulted from the application of methodological processes was an important element of the model develop-ment, and as such, future investigations might consider: (1) replicating the methodological processes adopted in
this study with a different group of decision makers; (2) extending the methodological approach to other contexts; and/or (3) combining different methodologies to make the evaluation systems more robust.
Acknowledgements
A previous and non-copyrighted version of this paper was presented at the 2017 BAI International Conference, held in Hiroshima, Japan. The authors acknowledge the superb contribution and infinite willingness of the panel mem-bers: Ana Alexandra Almeida, Fernando Pereira Marques, Gonçalo Coutinho, João Cunha, Jorge Candeias and Maria Arminda Rebelo. Institutional and facility support from the ISCTE Business School, University Institute of Lisbon, Portugal, is also acknowledged.
References
Ackermann, F., & Eden, C. (2001). SODA – journey making and mapping in practice. In J. Rosenhead & J. Mingers (Eds.),
Rational analysis for a problematic world revisited: problem structuring methods for complexity, uncertainty and conflict
(pp. 43-60) (2nd ed.). Chichester: John Wiley & Sons. Adair, A., & Hutchison, N. (2005). The reporting of risk in real
estate appraisal property risk scoring. Journal of Real Estate
Finance & Economics, 23(3), 254-268. https://doi.org/10.1108/14635780510599467
Adams, K., & Ntuen, C. (2006, December). An overview of cog-nitive maps and their applications. Proceedings of the 2006 IIE
Annual Conference and Exhibition (pp. 1-7). Orlando FL, USA.
Bell, S., & Morse, S. (2013). Groups and facilitators within prob-lem structuring processes. Journal of the Operational Research
Society, 64(7), 959-972. https://doi.org/10.1057/jors.2012.110
Belton, V., & Stewart, T. (2002). Multiple criteria decision
analy-sis: an integrated approach. Dordrecht: Kluwer Academic
Publishers. https://doi.org/10.1007/978-1-4615-1495-4
Brown, R., & Young, M. (2011). Coherent risk measures in real estate investment. Journal of Property Investment & Finance,
29(4/5), 479-493. https://doi.org/10.1108/14635781111150358
Canas, S., Ferreira, F., & Meidutė-Kavaliauskienė, I. (2015). Set-ting rents in residential real estate: a methodological proposal using multiple criteria decision analysis. International Journal
of Strategic Property Management, 19(4), 368-380. https://doi.org/10.3846/1648715X.2015.1093562
Carlucci, D., Schiuma, G., Gavrilova, T., & Linzalone, R. (2013, June). A fuzzy cognitive map based approach to disclose value creation dynamics of ABIs. Proceedings of the 8th Inter-national Forum on Knowledge Asset Dynamics (IFKAD-2013)
(pp. 207-219). Zagreb, Croatia.
Cartwright, D., & Harary, F. (1956). Structural balance: a gener-alization of Heider’s theory. Psychological Review, 63(5), 277-293. https://doi.org/10.1037/h0046049
Carvalho, J. (2013). On the semantics and the use of fuzzy cog-nitive maps and dynamic cogcog-nitive maps in social sciences.
Fuzzy Sets and Systems, 214(1), 6-19. https://doi.org/10.1016/j.fss.2011.12.009
Carvalho, J., & Tomé, J. (1999, August). Fuzzy mechanisms for causal relations. Proceedings of the 8th International Fuzzy Sys-tems Association World Congress (IFSA 99) (pp. 1-5). Taipei,
Cheong, C., Olshansky, A., & Zurbruegg, R. (2011). The influ-ence of real estate risk on market volatility. Journal of Property
Investment & Finance, 29(2), 145-166. https://doi.org/10.1108/14635781111112774
Devaney, M., & Weber, W. (2005). Efficiency, scale economies, and the risk/return performance of real estate investment trusts. Journal of Real Estate Finance and Economics, 31(3), 301-317. https://doi.org/10.1007/s11146-005-2791-5
Eden, C. (2004). Analyzing cognitive maps to help structure is-sues or problems. European Journal of Operational Research,
159(3), 673-686.
https://doi.org/10.1016/S0377-2217(03)00431-4
Eden, C., & Ackermann, F. (2001). SODA – The principles. In J. Rosenhead & J. Mingers (Eds.), Rational analysis for a
prob-lematic world revisited: problem structuring methods for com-plexity, uncertainty and conflict (pp. 21-41) (2nd ed.).
Chich-ester: John Wiley & Sons.
Ferreira, F. (2016). Are you pleased with your neighborhood? A fuzzy cognitive mapping-based approach for measuring residential neighborhood satisfaction in urban communities.
International Journal of Strategic Property Management, 20(2),
130-141. https://doi.org/10.3846/1648715X.2015.1121169
Ferreira, F., & Jalali, M. (2015). Identifying key determinants of housing sales and time-on-the-market (TOM) using fuzzy cognitive mapping. International Journal of Strategic Property
Management, 19(3), 235-244.
https://doi.org/10.3846/1648715X.2015.1052587
Ferreira, F., Jalali, M., & Ferreira, J. (2016a). Integrating qualita-tive comparaqualita-tive analysis (QCA) and fuzzy cogniqualita-tive maps (FCM) to enhance the selection of independent variables.
Journal of Business Research, 69(4), 1471-1478. https://doi.org/10.1016/j.jbusres.2015.10.127
Ferreira, F., Jalali, M., Ferreira, J., Stankevičienė, J., & Marques, C. (2016b). Understanding the dynamics behind bank branch service quality in Portugal: pursuing a holistic view using fuzzy cognitive mapping. Service Business, 10(3), 469-487.
https://doi.org/10.1007/s11628-015-0278-x
Ferreira, F., Jalali, M., Zavadskas, E., & Meidutė-Kavaliauskienė, I. (2017). Assessing payment instrument alternatives using cognitive mapping and the Choquet integral. Transformations
in Business & Economics, 16(2|41), 170-187.
Ferreira, F., Santos, S., & Rodrigues, P. (2011). Adding value to bank branch performance evaluation using cognitive maps and MCDA: a case study. Journal of the Operational Research
Society, 62(7), 1320-1333. https://doi.org/10.1057/jors.2010.111
Ferreira, F., Santos, S., Rodrigues, P., & Spahr, R. (2014). How to create indices for bank branch financial performance measure-ment using MCDA techniques: an illustrative example. Journal
of Business Economics and Management, 15(4), 708-728. https://doi.org/10.3846/16111699.2012.701230
Ferreira, F., Spahr, R., Gavancha, I., & Çipi, A. (2013). Readjusting trade-offs among criteria in internal ratings of credit-scoring: an empirical essay of risk analysis in mortgage loans. Journal
of Business Economics and Management, 14(4), 715-740. https://doi.org/10.3846/16111699.2012.666999
Filipe, M., Ferreira, F., & Santos, S. (2015). A multiple criteria in-formation system for pedagogical evaluation and professional development of teachers. Journal of the Operational Research
Society, 66(11), 1769-1782.
https://doi.org/10.1057/jors.2014.129
Financial Times. (2017). Retrieved from https://www.ft.com/con-tent/a49f47c4-3041-11e7-9555-23ef563ecf9a
Glykas, M. (2013). Fuzzy cognitive strategic maps in busi-ness process performance measurement. Expert Systems
with Applications, 40(1), 1-14. https://doi.org/10.1016/j. eswa.2012.01.078
Gonçalves, T., Ferreira, F., Jalali, M., & Meidutė-Kavaliauskienė, I. (2016). An idiosyncratic decision support system for credit risk analysis of small and medium-sized enterprises.
Techno-logical and Economic Development of Economy, 22(4), 598-616.
Guo, J., Xu, S., & Bi, Z. (2014). An integrated cost-based ap-proach for real estate appraisals. Information Technology and
Management, 15(2), 131-139.
Hill, R. (2011). Hedonic price indexes for housing. OECD
Statis-tics Working Papers, 2011(1), 1-61.
Hui, E., Wang, Z., & Wong, H. (2014). Risk and credit change in Asian securitized real estate market. Habitat International,
43(1), 221-230.
https://doi.org/10.1016/j.habitatint.2014.03.008
Jalali, M., Ferreira, F., Ferreira, J., & Meidutė-Kavaliauskienė, I. (2016). Integrating metacognitive and psychometric decision-making approaches for bank customer loyalty measurement.
International Journal of Information Technology & Decision Making, 15(4), 815-837.
https://doi.org/10.1142/S0219622015500236
Kang, B., Deng, Y., Sadiq, R., & Mahadevan, S. (2012). Evidential cognitive maps. Knowledge-Based Systems, 35(15), 77-86.
https://doi.org/10.1016/j.knosys.2012.04.007
Kim, H., & Lee, K. (1998). Fuzzy implications of fuzzy cognitive map with emphasis on fuzzy causal relationship and fuzzy partially causal relationship. Fuzzy Sets and Systems, 97(3), 303-313. https://doi.org/10.1016/S0165-0114(96)00349-1
Kok, K. (2009). The potential of fuzzy cognitive maps for semi-quantitative scenario development, with an example from Brazil. Global Environmental Change, 19(1), 122-133.
https://doi.org/10.1016/j.gloenvcha.2008.08.003
Kosko, B. (1986). Fuzzy cognitive maps. International Journal of
Man-Machine Studies, 24(1), 65-75.
https://doi.org/10.1016/S0020-7373(86)80040-2
Kosko, B. (1992). Neural networks and fuzzy systems: a dynamical
sys-tems approach to machine intelligence. New Jersey: Prentice Hall.
La, L., & Mei, B. (2014). Portfolio diversification through timber real estate investment trusts: a cointegration analysis. Forest
Policy and Economics, 50(1), 269-274.
Lee, M., Lee, M., & Chiang, K. (2008). Real estate risk exposure of equity real estate investment trusts. Journal of Real Estate
Finance & Economics, 36(2), 165-181. https://doi.org/10.1007/s11146-007-9058-2
Lee, S., & Stevenson, S. (2005). Real estate portfolio construc-tion and estimaconstruc-tion risk. Journal of Real Estate Finance and
Economics, 23(3), 234-253.
https://doi.org/10.1108/14635780510599458
Maier, G., & Herath, S. (2009). Real estate market efficiency: a survey of literature, SRE – Discussion Papers, 2009(7), 1-46. Mao, Y., & Wu, W. (2011). Fuzzy real option evaluation of real
estate project. Systems Engineering Procedia, 1(1), 228-235.
https://doi.org/10.1016/j.sepro.2011.08.036
Mazlack, L. (2009, June). Representing causality using fuzzy cog-nitive maps. Proceedings of the Annual Meeting of the North
American Fuzzy Information Processing Society (NAFIPS 2009) (pp. 1-6). Cincinnati, USA.
https://doi.org/10.1109/NAFIPS.2009.5156434
Minli, Z., & Wenpo, Y. (2012). Fuzzy comprehensive evaluation method applied in the real estate investment risks research.
Physics Procedia, 24(C), 1815-1821.
Nicolini, D. (1999). Comparing methods for mapping organiza-tional cognition. Organizations Studies, 20(5), 833-860.
Olazabal, M., & Pascual, U. (2016). Use of fuzzy cognitive maps to study urban resilience and transformation. Environmental
Innovation and Societal Transitions, 18(1), 18-40. https://doi.org/10.1016/j.eist.2015.06.006
Papageorgiou, E., Roo, J., Huszka, C., & Colaert, D. (2012). For-malization of treatment guidelines using fuzzy cognitive maps and semantic web tools. Journal of Biomedical Informatics,
45(1), 45-60. https://doi.org/10.1016/j.jbi.2011.08.018
Peng, Z., Peng, J., Zhao, W., & Chen, Z. (2015). Research on FCM and NHL based high order mining driven by big data.
Mathematical Problems in Engineering, 2015(4), 1-7. https://doi.org/10.1155/2015/802505
Ribeiro, M., Ferreira, F., Jalali, M., & Meidutė-Kavaliauskienė, I. (2017). A fuzzy knowledge-based framework for risk assess-ment of residential real estate investassess-ments. Technological and
Economic Development of Economy, 23(1), 140-156. https://doi.org/10.3846/20294913.2016.1212742
Rybak, J., & Shapoval, V. (2011). Industries and sectors: Issues and policies, perspectives of innovations. Economics &
Busi-ness, 8(2), 17-22.
Salmeron, J. (2009). Augmented fuzzy cognitive maps for mod-elling LMS critical success facts. Knowledge-Based Systems,
22(4), 275-278. https://doi.org/10.1016/j.knosys.2009.01.002
Stach, W., Kurgan, L., & Pedrycz, W. (2010). A divide and con-quer method for learning large fuzzy cognitive maps. Fuzzy
Sets and Systems, 161(19), 2515-2532. https://doi.org/10.1016/j.fss.2010.04.008
Stach, W., Kurgan, L., Pedrycz, W., & Reformat, M. (2005). Ge-netic learning of fuzzy cognitive maps. Fuzzy Sets and Systems,
153(3), 371-401. https://doi.org/10.1016/j.fss.2005.01.009
Tolman, E. (1948). Cognitive maps in rats and men.
Psychologi-cal Review, 55(4), 189-208. https://doi.org/10.1037/h0061626
Tsadiras, A. (2008). Comparing the inference capabilities of bi-nary, trivalent and sigmoid fuzzy cognitive maps. Information
Sciences, 178(20), 3880-3894.
https://doi.org/10.1016/j.ins.2008.05.015
Wheaton, W., Torto, R., Sivitanides, P., & Southard, J. (1999). Evaluating risk in real estate. Real Estate Finance, 16(2), 15-22. Winger, A. (2002). Why the emerging economy will mean more
systemic risk in real estate lending. Real Estate Issues, 27(1), 28-35.
Yunus, N. (2013). Dynamic interactions among property types.
Journal of Property Investment & Finance, 31(2), 135-159. https://doi.org/10.1108/14635781311305372
Zadeh, L. (1965). Fuzzy sets. Information and Control, 8(3), 338-353. https://doi.org/10.1016/S0019-9958(65)90241-X