Genetics and Molecular Research 8 (1): 319-327 (2009)
Distinction between plant samples according to
allele dosage by semiquantitative polymerase
chain reaction
F.A. Martins1, P.C.S. Carneiro1, C.T. Guimarães2, J.V. Magalhães2, J.E.S. Carneiro3 and C.D. Cruz1
1Departamento de Biologia Geral, Universidade Federal de Viçosa, Viçosa, MG, Brasil
2Embrapa Milho e Sorgo, Sete Lagoas, MG, Brasil
3Departamento de Fitotecnia, Universidade Federal de Viçosa, Viçosa, MG, Brasil
Corresponding author: F.A. Martins E-mail: [email protected]
Genet. Mol. Res. 8 (1): 319-327 (2009) Received January 15, 2009
Accepted January 26, 2009 Published March 17, 2009
AbSTrACT. The lack of informativity of samples from heterozygotic individuals is one of the hindrances in the mapping of quantitative trait loci of outbred populations, since it is not normally possible to identify the origin of each allele. One way to include these individuals in analyses would be to genotype their endosperm, considering that a heterozygote (Aa) has AAa or Aaa endosperm, when the female genitor donates the A or a allele, respectively. We used semiquantitative poly-merase chain reaction to determine allele dosages in DNA mixtures, by simulating the observed conditions for endospermic tissue. Semiquan-titative polymerase chain reaction on agarose gels, along with regres-sion analysis, allowed differentiation of the samples according to the amount of DNA. This type of information will help decrease the num-ber of non-informative individuals in quantitative trait locus mapping of outbred populations, thereby increasing mapping accuracy.
InTroDuCTIon
The simplest detection procedure for quantitative trait loci (QTLs) is analysis based on a single locus, which consists of the statistical comparison among phenotypic mean values of
character for the different evolved classes of genotypic markers. A significant result describes
the existence of a linkage between a marker and a QTL of the related character (Coelho, 2000).
The detection of a defined QTL depends on various parameters such as magnitude of effects
over a certain characteristic, assessed population size, and recombination frequencies between marker and QTL, as well as the inheritance of such characteristic (Tanksley, 1993). In the map-ping of outbred populations, it is not a certainty that the genotypes of the genitors are known (Slate, 2005), which means that is not possible to identify from the heterozygous offspring the origin of each of the alleles, the linkage phase between marker and QTL, and thus, it is impos-sible to estimate the recombination frequency among these loci (Da and Lewin, 1995).
The lack of informativity from heterozygotic individuals is one of the difficulties in the
QTL mapping of outbred populations (Liu, 1998). For this reason, such individuals are omitted in the analyses of mean contrasts, and thus, they do not contribute to QTL detection. Taking into account that endosperm is formed by the fusion of a male gamete with the two polar nuclei of the female gametophyte, and that fusion generates, by mitotic divisions, triploid endosperm nuclei with two copies of the maternal alleles and one copy of the paternal allele in its genomic DNA (Wu et al., 2002), it is possible to conclude that a useful tool for including heterozygotes in the analyses would be genotyping their endosperm, since it is expected that a heterozygote Aa has endosperm AAa or Aaa, when its female genitors donate the allele A or a, respectively.
Among the most recent methods for quantification of polymerase chain reaction
(PCR) products, real time-PCR is especially noted. Although sensitive and reliable, this method is still expensive and requires special equipment, which not only limits its routine
use in many laboratories but also points to the necessity of simplification and reduction of
costs, by adapting such techniques. In this sense, semiquantitative PCR (SQPCR) has been
successfully adapted. Underwood et al. (1994) were the first to propose the determination
of the number of genes by comparing samples with a standard curve, plotted based on DNA
amplification of samples with previously determined gene dosages. In the last years, semi
-quantification works have been carried out in a similar way in a wide range of cases such
as in the investigation of human diseases (diagnosis and determination of cytomegalovirus load in the leukocytes of bone marrow or kidney transplant patients (Marin et al., 2004) and determination of interferon-gamma mRNA levels in AIDS-free HIV-infected individuals
(Barabás et al., 2001)), the identification of mixtures containing conventional and geneti
-cally modified maize seeds (Tozzini et al., 2000), or the determination of transgenic maize
and soybean composition in processed foods (Cazzola and Petrucelli, 2006). However, its longest and most frequent use is in the analysis of gene expression, that is SQPCR, for in-stance, in the study carried out by Chelly et al. (1990) concerning the expression analysis of the gene for muscular dystrophy, or in the distinction between queen and worker bees
ac-cording to the production of mRNA for the enzyme methyltransferase (Baffi et al., 2004).
Genetics and Molecular Research 8 (1): 319-327 (2009)
indole alkaloid pathway, in Catharanthus roseus cell cultures, indicated a good correla-tion with results obtained by tradicorrela-tional Northern blot analysis. Semiquantitative PCR has also been shown to correlate with in situ hybridization. This was well exemplified by Tao et al. (2007) who studied the temporal expression and localization of the phytoene synthase gene during fruit ripening in Citrus sinensis. Their results demonstrated that an equivalent proportionality in the relative amount of RNA could be obtained by both PCR and in situ hybridization.
Although SQPCR does not permit an absolute quantification, the above-men-tioned works demonstrated that it was possible to estimate the relative amount (Chelly et al., 1990; Baffi et al., 2004; Dutta et al., 2007; Tao et al., 2007) or the number of ampli-fied molecules in each sample (Underwood et al., 1994; Tozzini et al., 2000; Marin et al., 2004; Cazzola and Petrucelli, 2006). The sensitivity of SQPCR is the result of a chain reaction, in which the products from one amplification cycle serve as substrates for the next, resulting in an exponential increase of the product. Theoretically, the amount of product doubles with each cycle of PCR, but in fact, beyond a certain number of cycles, the amplification efficiency decreases with increasing cycle number, resulting in a plateau (Gause and Adamovicz, 1994). It is essential to identify the exponential phase (or log-lin-ear range) of the reaction, where the quantified amount of amplified target is proportional to the initial amount of target molecules, since the linear range could be defined as the assay’s window in which quantification is possible (Ferre, 1992). Thus, in order to make use of SQPCR, it is necessary to know the reaction kinetics beforehand, to determine the ideal reaction time in which the PCR products correspond to the exponential phase, when the estimation can be more accurate (Chelly et al., 1990).
Owing to the potential use of SQPCR for the estimation of the number of amplified
molecules, the aim of this study was to make use of this method for the distinction of samples, in relation to allele dosage in a DNA mixture that simulates the conditions observed in en-dosperm tissue of maize.
MATErIAl AnD METhoDS
Plant material
Maize leaves of the inbred lines L3 and L1113-01, provided by Embrapa Milho e Sorgo, were used. The molecular procedures were carried out at the Núcleo de Biologia Apli-cada, in Sete Lagoas, Minas Gerais.
DnA extraction
DNA was extracted from the inbred lines according to the method described by
Saghai-Maroof et al. (1984). DNA quantification was performed on a 0.8% agarose gel, using a DNA
Kinetics of the amplification reaction
Initially, three pairs of microsatellite primers (simple sequence repeats), bnlg182, bnlg1006, and umc1653, polymorphic among the inbred lines, were selected based on the study of
informativity and amplification pattern conducted by Padilha L (unpublished results) (Table 1).
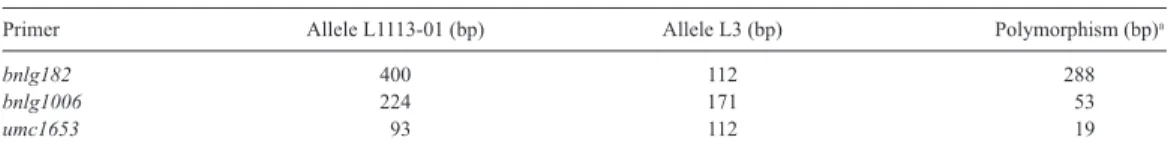
Primer Allele L1113-01 (bp) Allele L3 (bp) Polymorphism (bp)a
bnlg182 400 112 288
bnlg1006 224 171 53
umc1653 93 112 19
Table 1. Primers and polymorphisms between the inbred lines L3 and L1113-01.
aDifference in size (in bp) between the amplified alleles. The values in bp indicate the size of the allele present in each of the inbred lines.
The amplification reactions were performed in a final volume of 10 µL containing 30
ng DNA, 1 mM Tris-HCl, 50 mM KCl, 2 mM MgCl2, 125 µM of each dNTP, 0.6 µM of each primer and 1 U of the enzyme Taq polymerase. The cycles in PCR consisted of an initial dena-turation at 95°C for 2 min, nine cycles at 94°C for 20 s, 68°C for 20 s with a decrease of 1°C
per cycle, and 72°C for 20 s, followed by 15-25 amplification cycles at 94°C for 20 s, 60°C for 20 s and 72°C for 20 s, in the study of amplification kinetics.
The amplified fragments were visualized on 3% agarose gels after electrophoresis
at 80 V, for 2 h. The gels were treated with ethidium bromide (1 mg/mL) and the image was captured with the Eagle-Eye II, under ultraviolet light. The images were analyzed with the ImageQuaNT® program (Molecular Dynamics) for quantification of band intensity.
Estimation of copy number
After determining the ideal number of cycles and the different DNA proportions of
the inbred lines L3 and L1113-01 in the mixtures, new amplifications were performed for the
primers bnlg182 and bnlg1006, in an attempt to propose models for different simple sequence repeat primers. Three repetitions were carried out for each primer, and the total number of
am-plification cycles was fixed at 30, with the other reaction conditions remaining unchanged.
The intensity values observed in the three repetitions for the primers bnlg182 and bnlg1006 were converted into a scale from 0 to 100, in which the band intensities referring to the samples that contained DNA from only one of the inbred lines were considered to be 100, and the other values were obtained by a simple rule of three. The converted data were subjected to variance analysis in order to test their conformity to the linear model.
Analysis of variance (ANOVA) and estimation of the regression parameters were per-formed with assistance of the GENES program (Cruz, 2006). Furthermore, the coefficients of determination (ratio between the sum of the squares of the regression and the treatment)
were established, as well as the 95% confidence intervals for each independent variant in the
Genetics and Molecular Research 8 (1): 319-327 (2009)
rESulTS AnD DISCuSSIon
Kinetics of the amplification reaction
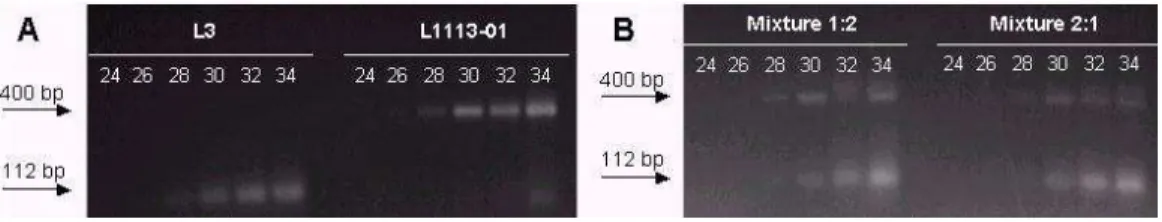
Fragments amplified by the primer bnlg182 were observed after 28 cycles (Figure 1). Bands corresponding to the fragments of smaller size appeared more diffuse compared to the bands of larger fragments. Similar results were observed for the other primers, bnlg1006 and umc1653.
Figure 1. Electrophoresis of the samples of leaf DNA and the respective mixtures, on a 3% agarose gel, treated with ethidium bromide, showing the products amplified with the primer bnlg182. A. Reaction products with samples of DNA of the inbred lines L3 and L1113-01. b. Reaction products with the mixtures (1:2) and (2:1). The number of
amplification cycles varied from 24 to 34, with intervals of two cycles.
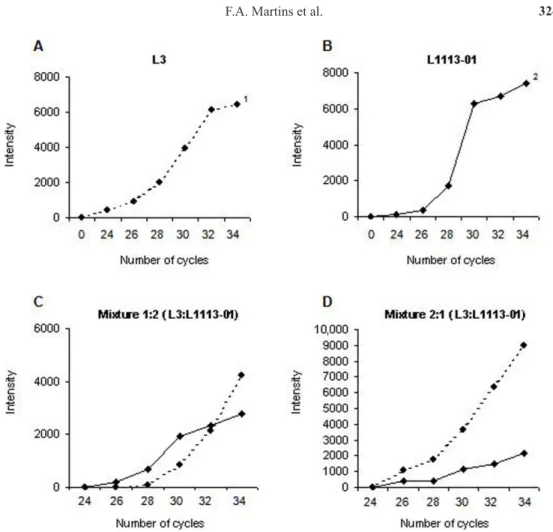
The intensity of the bands amplified by the primer bnlg182 was obtained with the ImageQuaNT® program, and the values corresponding to each reading were plotted (Figure 2). The kinetics study of the amplification reaction evidenced that, when individually ampli
-fied, the allele of smaller size reaches the plateau phase after 32 amplification cycles, whereas
the allele of larger size reaches this phase after only 30 complete cycles (Figure 2A and B).
When co-amplified, as in the mixtures, a greater difference was observed in the number of
cycles needed to reach the plateau phase, since it was not possible to visualize it for the smaller
fragment, while for the larger fragment a slight decrease in amplification was evident after 30
cycles (Figure 2C and D). According to Gause and Adamovicz (1994), the number of PCR cycles at which the plateau effect occurs varies greatly with the particular DNA sequence
be-ing amplified. The length of the fragment to be amplified is important, as is the initial total
amount and concentration of DNA. As a result, the number of cycles at which the plateau ef-fect occurs must be individually determined for each target sequence.
For the primer bnlg1006, with smaller polymorphism (Table 1), greater similarity was observed in the reaction kinetics (data not shown) for both alleles; however, for the primer umc1653, the resolution of the 3% agarose gel was not sufficient to clearly distinguish the
amplified products, so that the analyses with this primer were hampered. This way, in studies
of SQPCR that are intended to differentiate the allele dosages, the use of primers with alleles that do not display great polymorphisms and that show adequate size for discrimination on an agarose gel should be favored.
Also in Figure 2, it was observed that 30 amplification cycles was the number that best represented the exponential phase, seeing that in this phase the amount of amplified molecules
Estimation of copy number
The analysis regarding the fragments with 30 amplification cycles permitted differen -tiation of the DNA amount of the inbred lines in all four samples (Figure 3). The intensity of the
bands amplified by the primers bnlg182 and bnlg1006 was obtained with the ImageQuaNT®
program, and the values corresponding to each reading were converted and subjected to analy-sis of variance (Table 2). The effect of the treatment was decomposed in regression effect and
regression deviation. The latter appeared as not significant at 1% probability with the F-test, indicating a linear response of the band intensity with DNA amount, with coefficients of de
-termination varying from 92.6 to 99.8%.
Figure 2. Reaction kinetics of amplification with the primer bnlg182.A. and b. Products of amplification reaction
of the inbred lines L3 and L1113-01, respectively. C. and D. Products of amplification reaction of the mixtures 1:2
(10 ng L3 DNA and 20 ng L1113-01 DNA) and 2:1 (20 ng L3 DNA and 10 ng L1113-01 DNA), respectively. 1 and
Genetics and Molecular Research 8 (1): 319-327 (2009)
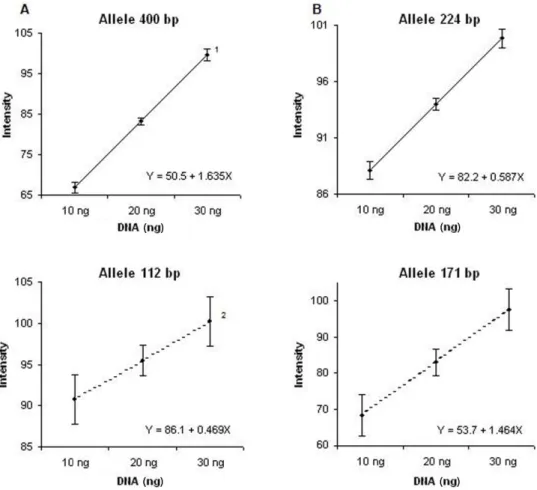
Based on the estimation of regression parameters, graphs were obtained and the 95% confidence intervals were established for each independent variant in the different reactions
(Figure 4). In the graphs representing reactions with the primer bnlg182 (Figure 4A),
overlap-ping of confidence intervals for the larger allele (400 bp) was not observed. However, among
nine intensity values that constituted the regression analysis, three did not belong to any of
the intervals. Contrarily, for the smaller allele (112 bp), overlapping of confidence intervals
was observed for the independent variant with amounts of 10 and 20 ng, as well as for 20 and 30 ng. Two of the analyzed intensity values were observed within the overlapping intervals; as a consequence, the initial DNA amount to which they correspond could not be estimated,
since these intensity values may refer to the amplification of either one or the other initial
DNA amount. The graph in Figure 4B, relating to the primer bnlg1006, did not show
overlap-ping in the confidence intervals. However, regression analysis for the intensity values of the
Figure 3. Electrophoresis of the amplification reactions with 30 complete cycles for the primers bnlg182 (A) and
bnlg1006 (B) on a 3% agarose gel. Lanes 1 and 2 = samples with 30 ng DNA from the inbred lines L3 and L1113-01, respectively. Lanes3 and 4 = samples with mixtures of DNA from the inbred lines L3 and L1113-01, in the proportions of 1:2 and 2:1, respectively.
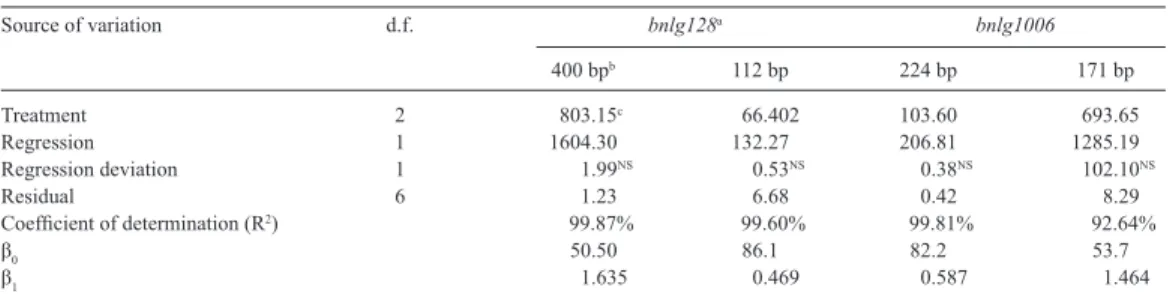
Source of variation d.f. bnlg128a bnlg1006
400 bpb 112 bp 224 bp 171 bp
Treatment 2 803.15c 66.402 103.60 693.65
Regression 1 1604.30 132.27 206.81 1285.19
Regression deviation 1 1.99NS 0.53NS 0.38NS 102.10NS
Residual 6 1.23 6.68 0.42 8.29
Coefficient of determination (R2) 99.87% 99.60% 99.81% 92.64%
β0 50.50 86.1 82.2 53.7
β1 1.635 0.469 0.587 1.464
Table 2. Summary of the variance analysis of the intensity values for the bands amplified by the primers bnlg182
and bnlg1006.
d.f. = degrees of freedom. NSNot significant at 1% probability with the F-test. aprimer, blength of the analyzed allele in bp, cmean square value; β
bands corresponding to the larger and smaller alleles did not explain all the observed values. For both alleles, three of the observations did not belong in any of the established intervals.
Semiquantification by PCR, based on comparison between the intensities that correspond to the amplified products and a standard curve, plotted upon DNA amplification of samples with previously determined gene or allele dosages, was proposed for the first time by Underwood et al. (1994). These authors also observed overlapping of the confidence intervals, and reported
that the initial gene quantity in the samples could not be determined in these intervals.
Figure 4. Standard curve for the intensity of fragments amplified with the primers bnlg182 (A) and bnlg1006 (B) plotted versus the initial DNA amount in the samples, in ng. 1 and 2 refer to the alleles of smaller and larger size,
respectively, in bp. The confidence interval, at 5% probability, is indicated by symmetric bars.
Genetics and Molecular Research 8 (1): 319-327 (2009)
relation to their initial DNA amount. Thus, it is concluded that this method can be applied for increasing accuracy in QTL mapping, by decreasing the number of non-informative individuals in outbred populations. However, it is noted that SQPCR requires previous knowledge of the reaction kinetics for the primers to be used, as well as standard samples with a known number of allele dosages.
ACKnowlEDGMEnTS
Research supported by Conselho Nacional de Desenvolvimento Científico e Tec -nológico (CNPq), Fundação de Amparo à Pesquisa do Estado de Minas Gerais (FAPEMIG) and Embrapa Milho e Sorgo.
rEFErEnCES
Baffi MA, Vieira CU, Siquierolli AC, Bonetti AM, et al. (2004). Expressão do gene hormônio juvenil metiltransferase em
abelhas Melipona scutellaris (Hymenoptera, Apidae, Meliponini). Arq. Inst. Biol. 71: 378-380.
Barabás É, Nagy K, Várkonyi V and Horváth A (2001). Comparison of the quantitative competitive and semiquantitative RT-PCR methods for the determination of interferon-gamma mRNA levels in AIDS-free HIV-infected individuals.
Braz. J. Med. Biol. Res. 34: 1271-1275.
Cazzola ML and Petrucelli S (2006). Semiquantitative analysis of genetically modified maize and soybean in food. Electron. J. Biotechnol. 9: 320-325.
Chelly J, Montarras D, Pinset C, Berwald-Netter Y, et al. (1990). Quantitative estimation of minor mRNAs by cDNA-polymerase chain reaction. Application to dystrophin mRNA in cultured myogenic and brain cells. Eur. J. Biochem.
187: 691-698.
Coelho ASG (2000). Considerações Gerais sobre a Análise de QTL’s. In: Análise de QTL no Melhoramento de Plantas (Pinheiro JB and Carneiro IF, eds.). FUNAP, Goiânia, 1-36.
Cruz CD (2006). Programa GENES - Estatística Experimental e Matrizes. Universidade Federal de Viçosa, Viçosa. Da Y and Lewin HA (1995). Linkage information content and efficiency of full-sib and half-sib designs for gene mapping.
Theor. Appl. Genet. 90: 699-706.
Dutta A, Singh D, Kumar S and Sen J (2007). Transcript profiling of terpenoid indole alkaloid pathway genes and regulators
reveals strong expression of repressors in Catharanthus roseus cell cultures. Plant Cell Rep. 26: 907-915. Ferre F (1992). Quantitative or semi-quantitative PCR: reality versus myth. PCR Methods Appl. 2: 1-9.
Gause WC and Adamovicz J (1994). The use of the PCR to quantitate gene expression. PCR Methods Appl. 3: S123-S135.
Liu BH (1998). Statistical Genomics. CRC Press, New York.
Marin LJ, Cunha AA, Aquino VH and Figueiredo LT (2004). The use of qualitative and quantitative polymerase chain reactions for diagnosis of cytomegalovirus infections in bone marrow and kidney transplant recipients. Rev. Soc. Bras. Med. Trop. 37: 158-164.
Saghai-Maroof MA, Soliman KM, Jorgensen RA and Allard RW (1984). Ribosomal DNA spacer-length polymorphisms in barley: Mendelian inheritance, chromosomal location, and population dynamics. Proc. Natl. Acad. Sci. U. S. A.
81: 8014-8018.
Slate J (2005). Quantitative trait locus mapping in natural populations: progress, caveats and future directions. Mol. Ecol.
14: 363-379.
Tanksley SD (1993). Mapping polygenes. Annu. Rev. Genet. 27: 205-233.
Tao N, Hu Z, Liu Q, Xu J, et al. (2007). Expression of phytoene synthase gene (Psy) is enhanced during fruit ripening of Cara Cara navel orange (Citrus sinensis Osbeck). Plant Cell Rep. 26: 837-843.
Tozzini AC, Martínez MC, Lucca MF, Rovere CV, et al. (2000). Semi-quantitative detection of genetically modified grains based on CaMV 35S promoter amplification. Electron. J. Biotechnol. 3: 149-153.
Underwood MA, Bartlett JM and Cooke TG (1994). An improved method for semiquantification of gene amplification
from archival material. PCR Methods Appl. 4: 178-184.