M
ASTER OF
S
CIENCE IN
FINANCE
M
ASTERS
F
INAL
W
ORK
PROJECT
EQUITY RESEARCH
:
R
OYAL
M
AIL
PLC
F
ILIPE
M
IGUEL
F
ERREIRA
D
UARTE
S
UPERVISOR
:
P
EDRO
R
INO
V
IEIRA
M
ASTER OF
S
CIENCE IN
FINANCE
M
ASTERS
F
INAL
W
ORK
PROJECT
EQUITY RESEARCH
:
R
OYAL
M
AIL
PLC
F
ILIPE
M
IGUEL
F
ERREIRA
D
UARTE
S
UPERVISOR
:
P
EDRO
R
INO
V
IEIRA
Abstract
The main motivation in choosing Royal Mail is to understand the behavior it will have in the coming years and the impacting effects that Brexit may have on a large British company.
Economic growth is expected to slow down in the coming years, not only across Europe, but also worldwide.
Thus, defining the methods of analysis and evaluation of the company through the CFA structure, an estimate of a price target was made.
As one of the largest companies in the sector, Royal Mail has two segments, the first referring to the distribution of letters and parcels in the United Kingdom and the second referring to the distribution of parcels in Europe, USA and Canada, having obtained a volume of revenue £10,581 million in 2019. To assess the intrinsic value of Royal Mail, the main valuation model was the Discounted Cash Flow (DCF) and the multiple valuation as a relative model to corroborate the principal. Through the absolute model, it was possible to verify a price target for March 25, 2020 of £232.27 per share, representing a 2.20% drop in the same period, which means that my recommendation is for SALE with high risk. In addition to the evaluation models, sensitivity analysis and Monte Carlo simulation were also used to support these results.
Resumo
A principal motivação na escolha do Royal Mail é entender o seu comportamento nos próximos anos e os efeitos impactantes que o Brexit pode vir a causar numa grande empresa britânica.
Estima-se que o crescimento económico desacelere nos próximos anos, não apenas por toda a Europa, mas também a nível mundial.
Assim, definindo os métodos de análise e avaliação da empresa através da estrutura CFA, foi feita uma estimativa de em price target.
Sendo uma das maiores empresas do setor, a Royal Mail possui dois segmentos, sendo o primeiro referente à distribuição de cartas e encomendas no Reino Unido e o segundo referente à distribuição de encomendas na Europa, EUA e Canadá, tendo obtido um volume de receitas de £10.581 milhões em 2019.
Para avaliar o valor intrínseco do Royal Mail, o principal modelo de avaliação foi o Fluxo de Caixa Descontado (DCF) e a avaliação múltipla como modelo relativo para corroborar com o principal. Através do modelo absoluto, foi possível verificar um price target para 25 de março de 2020 de £232,27 por ação, representando uma queda de 2,20% no período homólogo, o que significa que minha recomendação é de VENDA com alto risco.
Além dos modelos de avaliação, análises de sensibilidade e simulação de Monte Carlo também foram utilizadas para apoiar esses resultados.
Index
Abstract i
Index iiii
List of Figures ivv
List of Tables v
1. Research Snapshot 1
2. Business Description 2
3. Management and Corporate Governance 4
4. Industry Overview and Competitive Positioning 5
5. Investment Summary 9
6. Valuation 10
7. Financial Analysis 12
8. Investment Risks 13
Appendices 1
Appendix 1: Statement of Financial Position
1
Appendix 2: Statement on Financial Position (Common-Size)
2
Appendix 3: Income Statement
3
Appendix 4: Income Statement (Common-Size)
4
Appendix 5: Cash Flow Statement
5
Appendix 6: Cash Flow Statement (Common-Size)
5
Appendix 7: Key Financial Ratios
6
Appendix 8: Forecasting Assumptions
7
Appendix 9: Taxation
10
Appendix 10: Financial Assets and Liabilities
11
Appendix 11: Interest Rate Risk Management
12
Appendix 12: Growth Rate Discounted Cash Flow Analysis
13
Appendix 13: Discounted Cash Flow Analysis
14
List of Figures
Figure 1. Change Company's Name 2
Figure 2 - Royal Mail Revenues by Segment (in £ billions) 2
Figure 3 - Royal Mail Revenues by Market (in £ billions) 2
Figure 4 - Royal Mail March-2019 Revenues by Market (% of total revenues) 3
Figure 5 - Royal Mail Revenues, Cost, EBIT and Net Income 3
Figure 6 - Revenues and Operating Costs (in £ billions) 3
Figure 7 - Royal Mail plc Market Segment 4
Figure 8 - Royal Mail plc Strategies 4
Figure 9 - Royal Mail Shareholders 5
Figure 10 - Supervisory Board and Committee 6
Figure 11 - World Real GDP Growth 6
Figure 12 - Euro Area GDP Growth 6
Figure 13 - United Kingdom Real GDP Growth 7
Figure 14 - USA Real GDP Growth 7
Figure 15 - Porter's Five Forces 8
Figure 16 - Oil Forecast, dollar per barril 9
Figure 17 - Growth Rate 9
Figure 18 - Cost of Capital 10
Figure 19 - Capital Structure and equity beta 10
Figure 20 - WACC vs D/E 10
Figure 21 - DCF Price Target 11
Figure 22 - Multiple Average 11
Figure 23 - Company Name 12
Figure 24 - Multiple 1: EV/EBITDA 12
Figure 25 - Multiple 2: EV/EBIT 12
Figure 26 - Gross Profit and EBITDA Margin 13
Figure 27 - EBIT and Net Profit Margin 13
Figure 28 - ROCE, ROE and ROA 13
Figure 29 - TATR and FATR 14
Figure 30 - Current, Quick and Cash-Ratio 14
Figure 31 - Debt to Equity, Equity Multiplier and Interest Coverage Ratio 14
Figure 32 - OCF, ICF, FCF and Change in Cash 15
Figure 33 - EPS and EVA 15
Figure 34 - UK's Interest Rate From 2017-2024 15
List of Tables
Table 1 - Risk Analysis 1
Table 2 - Royal Mail Board Structure 2
Table 3 - Valuation Results 9
Table 4 - Risk Matrix 15
Table 5 - Sensitivity Analysis WACC and Growth Rate 16
Table 6 - Sensitivity Analysis Beta Unleveraged and Growth Rate 17
Royal Mail PLC
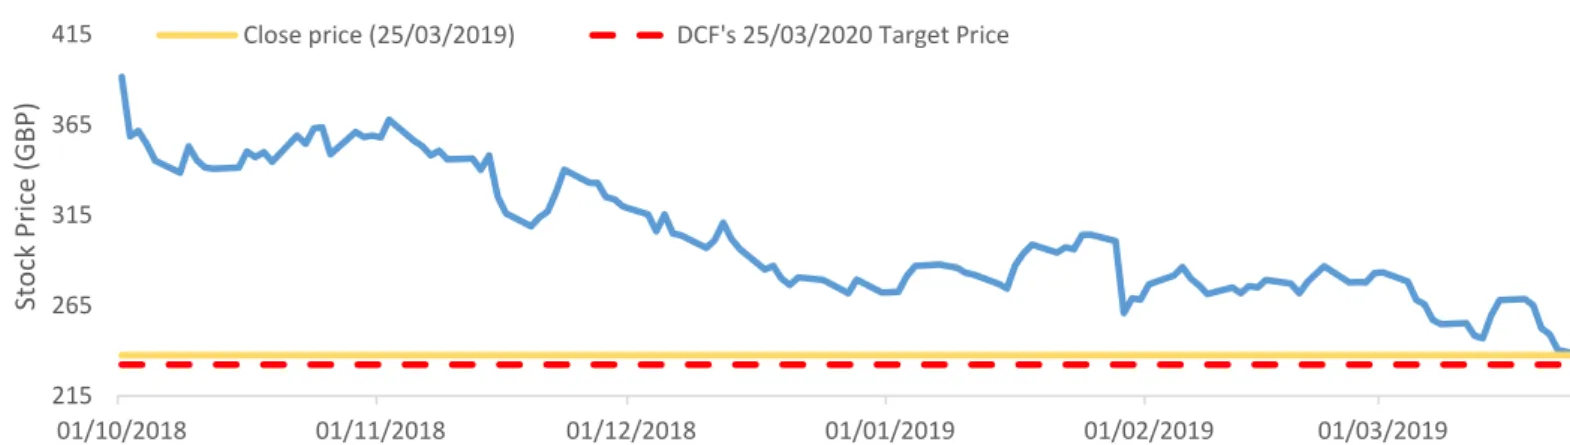
(25/03/2020 Price Target of GBP 232.27; 2.20% Downside Potential; High Risk; Final Recommendation: SELL)
My final recommendation for Royal Mail plc stand for SELL with a 25-03-2019 target price of GBP 232.27, representing a downside potential of 2.20% in comparison with the closing price of GBP 237.50 on March 25, 2019. The target price is calculated using the DCF valuation as the main model and a relative market multiple methodology was also used to support the recommendation provided by this approach. The market multiples methodology is not in line with DCF as it recommends a reduction in market position.
Global revenues are expected to grow by 0.81% CAGR between 2020F-2024F, that is, to grow from GBP 11.296 million to GBP 11.758 million.
This forecast is based on an industry study, both in terms of economy outlook, involving the regions where the company operates, as the analysis of supply, demand and the competitive position according to Porter's 5 forces. It is also based on its composition and company situation with its stakeholders.
The company's growing expansion led to an increase in revenue stream, but in turn caused a decrease in its productivity leading to a loss of its operating synergies. With this, the prospective company for the next 3 and 5 years will have a capex of between £ 400-500 million in order to automate the process and reduce the number of working hours.
It is expected that net income, which has so far been declining, will increase again, however its liquidity decreases to £ 454-27 million, demonstrating that the company may incur serious financial liquidity risks. The debt-to-asset structure will remain partly the same and it is expected that the current debt will increase its weight to around 33% of the asset.
1.
Research Snapshot
Low Medium High
My analysis estimates a high-risk investment for Royal Mail
Royal Mail plc
SELL
High risk 14 February 2020Portugal
215 265 315 365 415 01/10/2018 01/11/2018 01/12/2018 01/01/2019 01/02/2019 01/03/2019 Sto ck Price (G BP)Close price (25/03/2019) DCF's 25/03/2020 Target Price
Table 1. Risk analysis
Royal Mail plc is an English postal and delivery service Company headquartered in London. It is one of the oldest organizations in the world with more than 500 years and it’s responsible for the introduction of new technologies and digital services. Nowadays, the Royal Mail group is one of the biggest companies in the world represented in England as Royal Mail and as General Logistic Systems (GLS), his subsidiary, across Europe, United States and, more recently, Canada.
Brief History
It all began in the reign of Henry VII in 1516 with the creation of the postal service operating only for the king and the court, and was open to the general public only in 1635. In 1660, the Postal Act created the postal service of public property and in 1711 he set up a unified postal service throughout Scotland, England and Wales, joining Ireland in 1808. In 1784, given his familiar view across the country, the Postal Service changed its name to Royal Mail.
The 19th century is marked by the distribution of mail by sea (1821) and ferries (1830) and by the standardization of postage rates and the introduction of the stamp (1839 and 1840, respectively).
At the beginning of the 20th century, the distribution was also made by road (1907) and planes (1911). In 1959, the Postcodes are introduced facilitating the distribution of the mail through postal mail.
With mail being organized into three different companies - Royal Mail Letters, Counters and Parcels - the latter is renamed Parcelforce in 1990 and Parcelforce Worlwide in 1998. This renaming is accompanied by the introduction of online tracking and the construction of national sorting centers and international. In 1999, Royal Mail acquires the Germany German Parcel, the latter was renamed General Logistics Systems (GLS) at the end of the year.
The beginning of the 21st century is marked by technological innovations and reduction of environmental pollution, such as the introduction of SmartStamp® in 2004, Sustainable Mail® in 2009 and Click & Drop in 2015. It is also marked by expansion, both, in its national network through acquisition of eCourier in 2015 and the expansion of GLS throughout Europe. More recently the expansion in the US in 2016 was through the acquisition of the Golden State Overnight Delivery Service and in Canada in 2018 through the acquisition of Parcel Delivery Company Dicom Canada.
Operational segments/regions and Key drivers of profitability
The company is organized in two segments, based on geography, that is, for UK operations it has UK Parcels, International & Letters (UKPIL) and for non-UK operations it has General Logistics Systems (GLS).
2.
Business Description
1516 - Postal Service
1784 - Royal Mail
Figure 1. Change Company’s name
Source: Royal Mail Website
0 2 4 6 8 10 12 UKPIL GLS Group
Source: Royal Mail plc Annual Report 2009
Figure 2. Royal Mail Revenues by segment (in £ billions) 0 2 4 6 8 10 12
Letters Parcels Total
Source: Royal Mail plc Annual Report 2009
Figure 3. Royal Mail Revenues by market (in £ billions)
UKPIL
UKPIL is represented by ‘Royal Mail’ and ‘Parcelforce Worldwide’ brands. As Royal Mail, the provision of services for the collection, sorting and delivery of parcels and letters are supported by the combined letter and parcel delivery networks, which includes the services provided by Royal Mail as the UK’s designated Universal Service Provider. As Parcelforce Worldwide is a leading provider of express parcel delivery services. The join delivery of letters and parcels benefits from the extensive UK network enabling the handling and delivering of around 13 billion letters and 1.3 billion parcels, reaching 60% of UK delivery points each day, last year. Royal Mail, of all UK corporations made the 7th largest contribution to the UK economy totaling
£10.3 billion, including through employment and procurement.
GLS
GLS offers an increase product and geographical diversification. Being one of the largest ground-based, parcel delivery networks in Europe, it covers 41 countries and nation states in Europe and 7 states in western US and 1 state in Canada, through a combination of wholly-owned companies and partner companies. Last year, GLS delivered 634 million parcels for 300,000 clients.
Royal Mail Group
When analyzed the group, it is possible to observe that 73% of group revenues came from UKPIL and the remaining 27% came from GLS and although GLS increased its revenues, the costs increased more than the revenues. In addition, UKPIL registered a slight increase in revenues followed by a bigger increase in costs which, at the end of the period 2018-19, the group registered an increase of its EBIT, EBT and a decrease of net income because of the increase of tax credit of £112 million, when compared with the previous year.
Company Strategies
In order to connect customers, companies and countries, RMG aims to build a more balanced and diversified international business parcels-led for the next 5 years. To achieve this ambition, their strategy are focused in three keys (Figure 8):
‘Turnaround and grow’ in UK business
Considering the vital strategy for the next 5 years, the group will have as renewed focus the investment on productivity through a in new digital work tools – About 12% of their UK parcels are machine sorted and RM aims to increase to over 80% - and other daily and M/L term operational initiatives on delivery and distribution in order to improve the service. Since Royal Mail has a very good network, particularly for letters and small parcels, RM intends to extend the network to handle large parcels
37% 63%
Letters Parcels
Source: Royal Mail plc Annual Report 2009
Figure 4. Royal Mail March – 2019 Revenue by Market (% of total revenue)
0 2 4 6 8 10 12
Revenue Costs EBIT EBT Net Income
Source: Royal Mail plc Annual Report 2009
Figure 5. Royal Mail Revenues, Cost, EBIT and Net Income (in £ billions)
9 10 10 11 11 12 12 13
Revenue Operating Costs
Source: Royal Mail plc Annual Report 2009
Figure 6. Revenues and Operating Costs (in £ billions)
and next day orders in a more competitive and cheaper way. Through automation, there will be a way to deal more efficiently with products thus providing for a reduction in unit costs. The deployment of the network will provide in the long term a system of 2 deliveries per day in most countries, the first of letters and small parcels and the second of large parcels that were ordered online, including the previous night.
‘Scale up and grow’ GLS
Continued focus on profitable revenue growth and an improving performance in US, by the integration of GSO and Postal Express, in France, based on quality and targeting profitable segments, in Spain, by the integration of Redyser, and the extensive European coverage will play a key role. B2B will continue to be the heart of GLS business model and a selective growth in B2C will be pursued, where the approach will be centered on service and margin management and tailored solutions for local market needs.
Enhancing the cross-border proposition
The cross-border strategy involves a combination of GLS and Royal Mail International in order to increase the market share of UK export orders. This growth aims to be fueled by e-commerce and by the gradual unblocking of limitation of the segment below 2Kg that GLS has.
Shareholder Structure
Investment Managers is composed by 62.78% of the shareholders, leaving 0.05% for Brokerage Firms, 0.21% for Strategic Entities and the remainder for Free Float. Most of Investment Managers are Investment Advisor and/or Hedge Fund. This leads the company to incur potential risks because they are not interested in corporate governance, instead, they are looking for short-term returns and can pressure the Board to get short-term results, ignoring the company's medium/long-term strategy (Figure 9).
Mr. Keith Williams was elected Royal Mail plc’s Chairman of the Board in May 2019. Former British Airways CEO and chairman over the past 18 years, he is a successful leader with prior experience area in Finance, consumer focus and transport. Mr. Rico Back was appointed Group CEO on June 2018 and also took commercial responsibility for Post and Parcels in November 2018. With nearly 30 years of experience, Rico successfully founded GLS in 1989 and he was senior Royal Mail Group executive and CEO of the subsidiary GLS for 18 years. Appointed CFO on July 2017 and with operational responsibilities for Post and Parcels, Mr. Stuart Simpson has many years of experience as COO and Finance Director and he
3.
Management and Corporate Governance
Source: Royal Mail plc Annual Report 2009
Figure 7. Royal Mail plc Market Segment
'Turnaround and grow' UK
• New transformation plan with renewed focus on improved service, efficiency and productivity; • Continued success in UK parcels;
• UK network extension to handle large and small orders most efficiently tracked.
'Scale up and grow' GLS
• Focus on profitable revenue growth including yield management;
• Focus on B2B, with selective growth in B2C; • Integration of existing acquisitions.
Enhancing our cross-border proposition GROUP
• Generate incremental value from combined Royal Mail and GLS strengths in small, deferred shipments;
• Growth in share of UK export parcels market.
Source: Royal Mail plc Annual Report 2009
worked for 15 years in the automotive industry having senior roles in Finance and Strategy.
Board Structure, Attendance and Corporate Governance
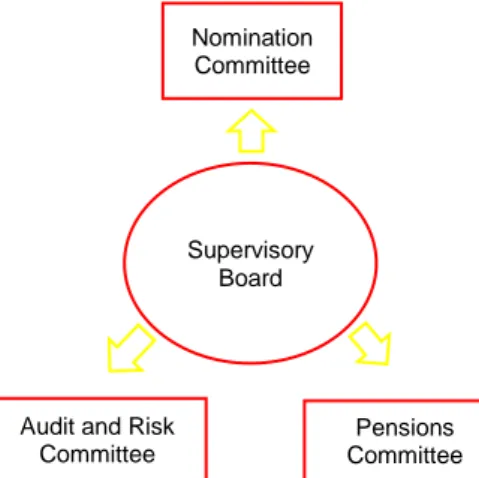
There are 7 seats on the Board of Directors, where 71.4% are Non-Executives. The Board is responsible for the long-term success of the group, and for that, it has three committees: Nominating Committee (NC), Audit and Risk Committee (ARC) and Remuneration Committee (RC) (Figure 10).
With the board and senior managers, the NC is responsible not only for reviewing the structure, size and composition of the board, but also for ensuring the renewal of board members, taking into account the challenges the company faces and what the board needs for its future. The NC is also responsible for assessing the organization's leadership needs to compete in the market.
The ARC shall be appointed by the Board and shall have at least three members and, where possible, one RC member. The ARC shall ensure that internal controls and risk management processes function effectively and make assessments and recommendations on the financial statements and associated disclosures for Board of Directors approval.
Having at least three non-executive directors and being appointed by the Board, the RC determines and recommends the remuneration of senior executives of the Group previously approved by the Board (Table2).
Sustainability and Social Responsibility
Operating in different regions, RMG highlights three areas: Health and Safety, where the goal is to create a workplace where everyone is free from injury whether physical or mental and reduce physical and mental health issues; Environment, where their commitment is to managing the environmental impacts, such as energy, water and waste, as well as how RMG works with customers and suppliers on environmental issues; and climate change, where RMG is committed to implement the Taskforce on climate-related Financial Disclosures (TCFD) recommendations.
Economy Outlook
Global Economy Outlook
It is important to know in what situation we are in the economic cycle. Empirically, it has been proven that the recovery and economic expansion cycle usually lasts 8-10 years, and a decade has passed. It is believed that the global economy appears to have peaked in 2018 at 3%, still below the initial projection due to the economic slowdown at the end of 2018, with a moderate growth of 2.9% in 2019 and an
Name Committee Chair Member
Keith Williams Chairman;
NC ARC
Rico Back CEO
Orna Ni-Chionna RC NC; ARC
Rita Griffin NC; RC; ARC Simon Thompson NC; RC; ARC
Michael Findlay ARC
4.
Industry Overview and Competitive Positioning
Table 2. Royal Mail Board Structure
Source: Royal Mail plc Annual Report 2009
62.78%
0.05% 0.21%
36.96%
Investment Managers Brokerage Firms Strategic Entities Free Float
Source: Thomson Reuters
Figure 9. Royal Mail Shareholders Structure
average of 2.8% in 2020-21 (Figure 11). This drop of growth is justified by monetary policy accommodation in advanced economies have been removed, global trade gradually decreases, and the tensions between advanced economies.
Europe Economic Outlook
Economic growth slowed in 2018 to 1.9%, 0.2pp below than expected. Although, the unemployment rate has fallen, and this decline is mainly due to the fact that the inflation rate is very low and that the interest rate is expected to remain negative in the coming years. In addition, loans and the profitability of the financial system is increasing, although some European banks in emerging markets and developing economies (EMEA) have exposed financial tensions. Furthermore, Europe still faces the Brexit's issue, which represents the greater risk in the short term of the Eurozone with effects difficult to predict. Even though, this difficulty exists in the materialization of risk, economic growth is estimated to be 1.6% in 2019 and an average of 1.4% in 2020-21, as a global trade growth moderate (Figure 12).
UK Economic Outlook
At present, it is very difficult to predict economic growth in the United Kingdom because of Brexit and political instability. With Brexit's range of resolution possibilities, from non-execution to No Deal Brexit, it is possible to expect alarming economic consequences for the country, given all the expenses you may incur for the case and companies leaving for countries of Europe (already made and which may be). Economic growth in the UK has weakened since the referendum, justified by declining investor confidence and the unknown risks the UK may face after Brexit. It went from economic growth of 2.3% in 2015 to 1.9% and 1.8% in 2016-17, respectively, and is estimated at 1.5% in 2018-19 (Figure 13).
North America Economic Outlook (USA and Canada)
Growth has been moderate in most advanced economies, except in the United States, where by 2018 it is estimated a 2.9% growth derived from the fiscal stimulus that boosted its activity. For the next few years, we are expected to see slow growth, while the monetary policy accommodation is removed and the fiscal stimulus fades and subsequently begins to drag on growth. To do so, the US economy is expected to grow by 2.5% in 2019 and an average of 1.7% in 2020-21.
There is a strong correlation between Canada and the US because Canada is the largest US trading partner. There are agreements in the three types of sectors (primary, secondary and tertiary), for example, Canada's two largest export sources are oil and vehicles. Starting with the first, Canada is the world's largest oil supplier to the US, and since the Canada-United States Automotive Agreement signed in 1965 there has been no customs barriers to trade in vehicles and their components.
Supervisory Board Nomination Committee Pensions Committee Audit and Risk
Committee
Figure 10. Supervisory Board and Committee
Source: Royal Mail plc Annual Report 2019
0.0 0.5 1.0 1.5 2.0 2.5 3.0
Source: World Bank & Deloitte
Figure 12. Euro Area Real GDP Growth 0.0 0.5 1.0 1.5 2.0 2.5 3.0 3.5
Source: World Bank & Deloitte
With this, Canada's economic growth is expected to slow to the same extent as the US by 1.3 percent in 2020 (Figure 14).
Demand and Supply Analysis Demand Side
Online Retailers
The number of digital buyers worldwide has been increasing boosted by the growing number of start-up business in online retail. With the success of e-commerce business models from Amazon to Ebay in USA, to JD.com (Jing Dong) and the Alibaba Group in China. There is a growing number of start-up businesses that can sell virtually anything; segmenting by group, geography and type of costumer. This trend is an important demand driver that can boost revenues for F&L companies.
Change in Consumer Behavior
Consumer behavior is rapidly changing. For these new types of consumers, physical shopping is inefficient. Online shopping boasts a number of advantages, as on the palm of one’s hand there’s access to everything and there aren’t any cues or lines checking out. For F&L companies this comes as an opportunity to enter and exploit new markets and geographies.
Supply Side
Industry 4.0 and Technological Breakthrough
With the current trend of automation and connectivity in manufacturing technologies, it’s expected to see accelerated manufacturing times. Smart factories are being implemented not only in growth industries but also in more mature ones (at a slower level, though). This can be an important driver raising productivity to unprecedented levels of efficiency, and also the sheer number of final goods. This could prove to be a very important factor for Royal Mail as it intends to increase process automation by around 70% over the next 5 years. By achieving this percentage, it is possible to achieve market synergies that competitors cannot.
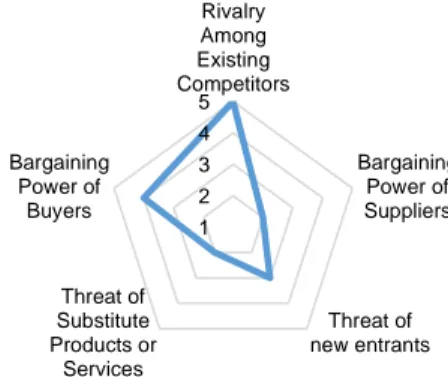
Competitive Position Porter’s 5 Forces
Bargaining Power of Buyers (High)
B2B companies expect improvements over efficiency and performance causing impact on margins. E-commerce players like Amazon and Ebay while capturing new costumers put increasing pressure on the industry. Both businesses and individuals expect to get goods faster, more reliably and for lower prices, regardless of seasonal capacity constraints. 0.0 0.5 1.0 1.5 2.0 2.5 3.0 3.5
Source: World Bank & Deloitte
Figure 14. USA Real GDP Growth 0.0 0.5 1.0 1.5 2.0 2.5
Source: World Bank & Deloitte
Bargaining Power of Suppliers (Low)
The biggest players in the F&L industry have high standards and demands when choosing for partners/suppliers. Suppliers include manufacturers of standard truck and trailer combinations, mega-trailers, local transport companies and are widely available in the market being selected based on cost and compliance with defined standards.
Threat of New Entrants (Moderate)
Entry barriers were modest, but with technological breakthroughs automation and data analytics can bring new unorthodox players. Sharing and collaborative economy can contribute to new entries that could consist of existing suppliers (now turned competitors) and even final customers. A remarkable threat also comes from Amazon with its publicly known obsession for controlling the process from start to end, which currently doesn’t happen. Amazon already created its inhouse logistics division – Amazon Logistics recruiting small and local partners and working in a franchising business model.
Threat of Substitute Products or Services (Low)
F&L industry offers different services satisfying different needs of users. These range from warehousing, supply chain management to transportation services. There are only alternatives for transportation, however at this point they are still an extra cost for customers. There is not a real and credible substitute for these services.
Rivalry Among Existing Competitors (High)
Currently there is low differentiation the industry. Competition is high, based on price and quality of service. Switch costs for buyers are low, intensifying rivalry among the major players. The industry has three to four major players, them having on aggregate more than 80% of the global market share. Technological progress can stablish a new paradigm as the service can get not only cheaper but also more reliable.
SWOT Analysis Strengths
The expansion to other markets through the acquisition of companies such as GSO in the US and Parcel Delivery Company Dicom Canada in Canada has led to greater risk diversification and new revenue generation.
The integration of new technologies from acquisitions and the creation of new ones has made Royal Mail more competitive.
The fact that they look at the company as a family causes them to train their teams so that customers are more satisfied.
1 2 3 4 5 Rivalry Among Existing Competitors Bargaining Power of Suppliers Threat of new entrants Threat of Substitute Products or Services Bargaining Power of Buyers
Figure 15. Porter’s Five Forces
The continuous increase with Free Cash Flow means that the company has more liquidity to continue its expansion process and also provides security to face a possible future economic downturn.
Weakness
The expansion of the group also shows us some possible weaknesses at the cultural level. The international expansion involves the connection with other habits and customs and this cultural connection can be harmful to the company in the point of view of efficiency since the operational synergies are not being obtained at its optimum point.
And while the company has been responsible for some innovations, it is important to invest more in R&D. The sector is not following global technological development and if this continues, it risks to become obsolete.
Opportunities
Revenue from online commerce is increasing and the creation of new technology linked to e-commerce can create more profits and bring competitive advantages to the major peers.
The decrease in the cost of transportation leads to a decrease in the cost of the product that can provide an increase in profits.
Threats
Local distributors may pose as threat to Royal Mail as they may make distribution agreements with other companies to secure their local trade.
The legal terms of each country may also be a problem to Royal Mail as these vary from country to country and as such the company may be incurring certain legal risks of which it is not fully aware.
Despite all the global technological development, the sector has not followed it in the same way and a dependence on oil might be harmful. The company still very dependent on oil and this will change over the next few years and could pose serious threats if the risk hedge is not done (Figure 16).
My final recommendation for Royal Mail plc is a sell position, with a target price to March 25, 2020 of £232.27, with a downside potential of 2.20%, compared with the closing price of £237.50 on March 25, 2019 with high risk.
Price Upside/ Downside Potential Share Price £237.50 DCF (WACC) £232.27 -2.20% Multiple Average £238.92 0.60% EV/EBITDA £228.44 -3.81% EV/EBIT £249.39 5.01%
5.
Investment Summary
Figure 3: Oil Forecast From 2018-2023 (Montly)
Source: https://longforecast.com/oil-price-today-forecast-2017-2018-2019-2020-2021-brent-wti
Table 3. Valuation Results
Source: Author
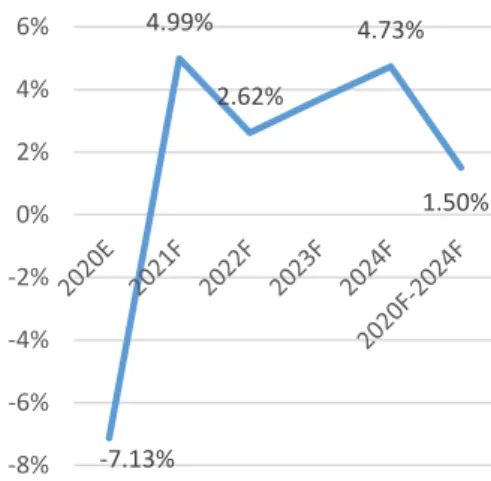
Source: Author
Figure 17. Growth Rate
-7.13% 4.99% 2.62% 4.73% 1.50% -8% -6% -4% -2% 0% 2% 4% 6%
Figure 16. Oil Forecast, dollar per barril
Key value drivers and potential catalysts
Expansion into North America, first with the west coast of the United States and later with Canada, has increased the flow of revenues and, consequently, diversified economic risk.
The parcels segment is gaining importance in Royal Mail's portfolio and the focus in the coming years is to maintain this focus so that 70% of parcel gains can be achieved.
Unlike parcels, letters are decreasing their importance in the portfolio due to technological developments and will continue to make sense.
Royal Mail intends to inject between £400- £500 million over the next few years to increase productivity through process automation. This increase in productivity is also accompanied by a boost to workers and a reduction in the number of hours worked.
Valuation method
To evaluate Royal Mail, my main evaluation model was to use the DCF approach. To corroborate the cash flow approach, a relative valuation using multiples was applied as another tool with a price target of £232.27, representing a downside potential of 2.20%. Thus, all methods demonstrate that Royal Mail is overvalued (Table 3).
As mentioned earlier, two valuation methods were used, one absolute, Discounted Cash Flow (DCF), and one relative, Multiple. The main analysis model was the DCF and the second one used to corroborate the analysis.
Discounted Cash Flow
The DCF model is used to estimate the value of equity per share through the FCFF. Several assumptions were used to reach the value of equity.
Assumption Revenues
UKPIL segment revenues represent the majority of total revenues and it is expected that these will decline as a result of the decrease in letter volume and the potential bad economic results that UK may have from Brexit. As for GLS revenues, an increase is expected due to increased revenue flow and continued market growth in
6.
Valuation
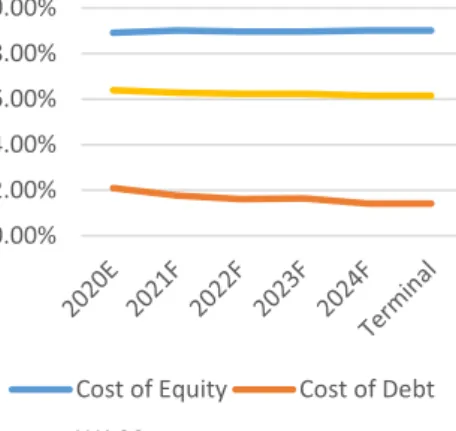
0.00% 2.00% 4.00% 6.00% 8.00% 10.00%Cost of Equity Cost of Debt WACC
Figure 18. Cost of Capital
Source: Author 1.25 1.26 1.26 1.27 1.27 1.28 1.28 0% 20% 40% 60% 80% 100% 120% Equity-Weight Debt-Weight Equity-Beta
Figure 19. Capital Structure and equity beta
Source: Author 6.00% 6.05% 6.10% 6.15% 6.20% 6.25% 6.30% 6.35% 6.40% 6.45% 0.58 0.59 0.59 0.60 0.60 0.61 2018F 2019F 2020F 2021F 2022F D/E WACC
Figure 20. WACC vs D/E
the European countries, despite the present potential economic situation largely due to the decline in German economic growth that may affect the rest of Europe.
Operating costs
For the next 5 years, RMG has assumed a strategy of increasing productivity by around 18%, justified by process automation and reduction of working hours.
Capital Expenditure (Capex) and Depreciation and Amortization (D&A)
In order to fuel the increase in productivity, the company has committed to finance £ 400 million YOY and for D&A expenses, a historical average of PP&E and IA has been assumed and scrapped over the next few years.
Debt
With debt repayment over the next few years, the company runs the risk of running out of liquidity and, as a result, it has been assumed that it will resort to a new debt of £ 100 million in 2024 to 10 years at a rate of fixed rate of 2%.
NWC
It was assumed that inventories and Account Receivables tended to sector values until 2024 and account payables remained constant, as they had better values than the sector. Industrial data from Damodaran’s website.
DCF-Valuation
The two-stage FCFF model was used to calculate DCF following a WACC approach, that is, first individual growth rates were computed between 2020F-2024F and then a constant growth at the terminal (Figure 21).
The terminal constant growth was assumed to be 1.5% since it is the most coherent value as it is estimated that world inflation will grow around 2% and therefore assumed a lower value than world inflation and that the average period as it was close to inflation so that seemed to me a somewhat biased reality.
Regarding the WACC calculation (Figure 18 and Appendix 12), it was calculated to discount the FCFF and the Terminal Value (Figure 3 and Appendix 2). The Terminal Period was stabilized considering the period between 2020 and 2024 and the EV at March 25, 2020 of £2,387.75 million was adjusted by the net debt to reach the Equity Value of £2,322.74 million. Thus, in March 25, 2020, the price target will be £232.27, representing a downside potential of 2.20% (Appendix 13).
Price Target MN GBP Enterprise Value 2 387.75 Net Debt 65.01 Value of Equity 2 322.74 Nº of Shares Outstanding 1 000.00 Price at 25/03/2020 £232.27 Price at 25/03/2019 £237.50 Upside/Downside Potential -2.20% Source: Author
Figure 21. DCF Price Target
Multiple Average MN EUR
EV/EBITDA Price 228.44
EV/EBIT Price 249.39
Price on 31st Dec, 2019 £238.92 Price in 31st Oct, 2018 £237.50 Up(or Down) side Potential 0.60% Figure 22. Multiple Average
Multiples Valuation
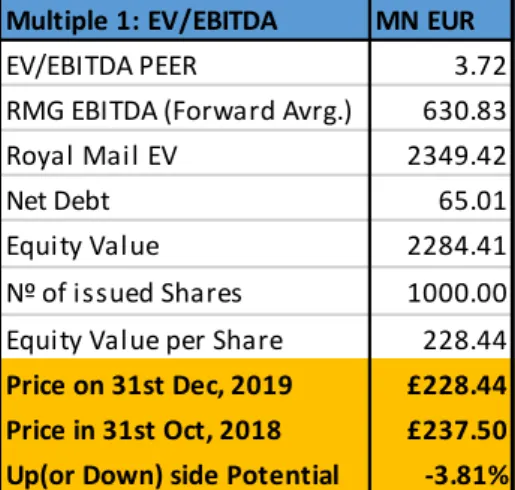
To support my analysis of the DCF Method, it was used the Multiples valuation in order to acquire the target price. To evaluate the firm through multiples, a comparable peer group was selected from Reuters (Figure 23) and the multiples used was the Enterprise Value to EBITDA and Enterprise Value to EBIT.
The multiple average (Figure 22) has a price target of £238.92 in March 25, 2020, representing an upside potential of 0.60%. This was made by multiple EV/EBITDA and EV/EBIT. Starting with the EV/EBITDA (Figure 24), it gave a price target of £228.44, or a potential low of 3.81%. Looking at the multiple EV/EBIT (Figure 25), it gave a price target of £249.39, a potential high of 5.01%.
Good projections for sustainable growth for Royal Mail
From 2019 to 2024, revenues are expected to grow to 2.13% CAGR, with operating costs, including D&A, increasing by 1.97% CAGR, resulting in higher operating income (Figure 6).
This increase was mainly driven by an increase of parcel revenues and gains of productivity. That said, EBIT and Net profit will increase from 1.65% and 1.65% in 2019 to 3.14% and 2.90% in 2024, respectively (Figure 27).
Due to the increase in net income, the ROA is expected to increase from 2.36% in 2019 to 4.40% in 2024 and ROE from 3.79% to 7.05% (Figure 28).
Same operational efficiency in the future
TATR is at 0.05 in 2019 and remain constant for years. The FATR is 1.44 in 2019 and grows to 1.54 in 2024 (Figure 29). This information shows the measures used by Royal Mail are not the most efficient to apply and it can be other measures to apply in order to turn the operational part more efficient (Figure 29).
Bad perspective of liquidity and solvency in the future
In 2019, we observe that operating activities was not sufficient to support the Cash Flow Statement, giving a negative change in cash in £362 million. In 2020, the change in cash will be positive because the company will not invest in capex and, for the rest of the forecast, will have a constant capex investment, changing the change of cash from positive to negative, and a maintenance of operating activities. Only FCF showed a low negative impact on Cash Flow Statement (Figure 32). Over the time, it is possible to observe that the company assets will increase more than liabilities but the current liabilities will increase more than current assets which gives a potential risk of liquidity.
When the current, quick and cash ratio are observed, it is possible to see a small increase of this indicators in 2020 but then, they will start to decrease to a minimum
7.
Financial Analysis
Company Name Bpost SA Deutsche Post AG FedEx Corp Nippon Express Co Ltd Poste Italiane SpA United Parcel Service Inc Figure 23. Company NameSource: Thomson Reuters
Multiple 1: EV/EBITDA MN EUR
EV/EBITDA PEER 3.72
RMG EBITDA (Forward Avrg.) 630.83
Royal Mail EV 2349.42
Net Debt 65.01
Equity Value 2284.41
Nº of issued Shares 1000.00
Equity Value per Share 228.44 Price on 31st Dec, 2019 £228.44 Price in 31st Oct, 2018 £237.50 Up(or Down) side Potential -3.81% Figure 24. Multiple 1: EV/EBITDA
Source: Author
Multiple 2: EV/EBIT MN EUR
EV/EBIT PEER 8.72
RMG EBIT (Forward Avrg.) 293.60
Royla Mail EV 2558.94
Net Debt 65.01
Equity Value 2493.93
Nº of issued Shares 1000.00
Equity Value per Share 249.39 Price on 31st Dec, 2019 £249.39 Price in 31st Oct, 2018 £237.50 Up(or Down) side Potential 5.01% Figure 25. Multiple 2: EV/EBIT
historical values to 202, and the cash ratio reach close to zero (Figure 30). Looking the Royal Mail with its shareholders, it is found that Royal Mail is in a fragile situation, with profits declining until 2017, although revenues increase and liabilities decrease. This reveals operating inefficiency that is expected to be gradually phased in over the next few years and, as a result, will bring about an increase in profits and maintain the volume of liabilities. With this behavior, value creation is expected to decrease the negative EPS value (Figure33).
Overall, there is a perspective of a stabilization of the financial situation The attempt to have more operational synergies, increasing the productivity with the investment in capex and reducing the work hours will be offset with the potential economic recession, mainly because of the Brexit and that results to a decrease of the enterprise value.
New and Complex Competition (NCC)
There is a serious threat coming from Amazon. The online retail giant is gearing up its in-house logistics division. For now, only recruiting small and local businesses but the company intends to gain scale. The concern is mostly for US companies, FedEx and specially UPS and Royal Mail as GLS.
Failure to Adapt to Technological Change (FATC)
Major players in F&L are slowing adapting to technological change and investment in R&D remains low. For instance, DHL plans to invest 5% of revenue in R&D following the “Strategy 2020: Focus. Connect. Grow”. FedEx and UPS have similar plans. Royal Mail intents to invest £400-500 per annum during the next 5 years. This is a critical point.
Oil Price Volatility (OPV)
Major players in F&L are, as expected very much dependent on oil and exposed to that market risk. Their peers hedge that risk with derivatives.
Trade wars, Tariffs and Protectionism in USA (TWTP)
In order to cut trade deficit President Trump has placed tariffs worth billions of dollars on goods from around the world, particularly in China. The intent is to boost US Industry and protected it from foreign competition. This can be counterproductive as it can raise costs for many industries and reduce purchasing power. Expansion to markets outside the US can hedge that risk for the US peers.
8.
Investment Risks
0% 1% 2% 3% 4% 5% 6% 7% 2019 2020E 2021F 2022F 2023F 2024F Gross Profit Margin (%) EBITDA Margin (%) Figure 26. Gross Profit and EBITDA MarginSource: Author 0% 1% 1% 2% 2% 3% 3% 4% 2019 2020E 2021F 2022F 2023F 2024F EBIT Margin (%) Net Profit Margin (%) Figure 27. EBIT and Net Profit Margin
Source: Author 0.00% 1.00% 2.00% 3.00% 4.00% 5.00% 6.00% 7.00% 8.00% 2019 2020E 2021F 2022F 2023F 2024F ROA (%) ROCE (%) ROE (%) Figure 28. ROCE, ROE and ROA
Reputational Risk (RR) and Industrial Espionage (IR)
Operational risk can be critical for any business. When operations are decentralized and geographically diversified, the internal control system must be strong in order to mitigate this risk. This is a critical point for Royal Mail, as it has shown continued productivity losses as it expanded to North America.
Inorganic Growth for Consolidation (M&A)
M&E and JV are expected as the industry further consolidates, we anticipate a major trend. FedEx recently acquired TNT to grow in the European market and technologically advanced small businesses are also being acquired in the Asian market. This poses a serious threat to GLS as its main market is in Europe.
Recession in Germany (RG)
There’s growing speculation about a crisis in Europe fueled by Germany. European Central Bank’s Quantitative Easing program is expected to come to a halt as the current President’s mandate comes to an end.
Taxation (Tx)
Taxation is critical as it can reduce competitiveness. Corporate taxes on US companies have been eased by the Trump administration. These points may dictate a good or bad future for Royal Mail in the US.
Failure to Diversify to New Markets (FDNM)
The American peers are mostly concentrated in the domestic market, as it is huge and still growing. Chinese ecommerce businesses are an opportunity to expand. DHL understood this and took action and Royal Mail bought the Golden State Overnight Delivery Service.
Climate Changes (CC)
Sustainable energy is critical to future growth. We can see efforts in DHL to overcome oil dependence with their GoGreen Program, FedEx also has a similar program, EarthSmart, but less sophisticated, Royal Mail lauched in 2009 Sustainable Mail® and, more recently, it is possible to observe in some European countries the employer distributing letters and parcel on electric vehicles. In the case of UPS, we see no similar initiatives.
Raise In Interest Rates (RIR)
Interest rates will maintain in the USA and higher then Europe. In Europe rates will maintain negatives for the coming years, as they are at historically low levels. The only concern that is not possible to expect is the behavior of the interest rate in UK, because of the multiple results that Brexit can give. However it is expected that the
0.00 0.20 0.40 0.60 0.80 1.00 1.20 1.40 1.60 1.80 2019 2020E 2021F 2022F 2023F 2024F Total Assets Turnover (x) Assets Turnover Figure 29. TATR and FATR
Source: Author 0.00 0.20 0.40 0.60 0.80 1.00 2019 2020E 2021F 2022F 2023F 2024F Current Ratio (x) Quick Ratio (x) Cash Ratio (x) Figure 30. Current, Quick and Cash - Ratio
Source: Author 0.00 1.00 2.00 3.00 4.00 5.00 6.00 2019 2020E 2021F 2022F 2023F 2024F Debt to Equity Ratio (x)
Equity Multiplier (x) Interest Coverage Ratio (x) Figure 31. Debt to Equity, Equity Multiplier and Interest Coverage Ratio
interest rate rise. Impact is for all companies, as rates rise, costs rise, and already low margins decrease (Figure 34).
Shift in Supply Chain (SSC)
Technology can bring a shift in the supply chain of their companies. Suppliers that once were unsophisticated and low tech, can now gain bargaining. One good strategy is to establish networks of suppliers and local companies and involve them in this changing world. If need be they can be acquired and vertically integrated.
Political Instability in Europe (PIE)
As referred in Macroeconomic Environment, there’s a growing trend of populists and nationalists movements. Although Royal Mail has at a risky situation, DHL is more at risk, as the consequences of these policies are often unpredictable.
Brexit
It is not possible to predict what will happen about Brexit and, therefore, difficult to estimate the inherent risks. The worst case scenario is that the UK leaves without agreement and, if it does, extremely negative results for the UK economy are expected to severely affect all companies. Even if there is an agreed Brexit, the UK will have to bear all the costs of leaving it, which will have a substantial damage in its economy.
That said, and in all possible circumstances, I expect the UK to go through a bad economic phase in the coming years.
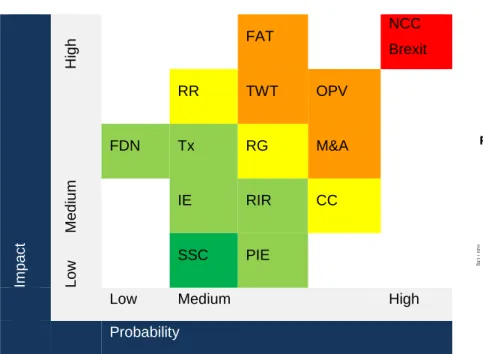
Imp ac t Hi gh FAT NCC Brexit Me d ium RR TWT OPV FDN Tx RG M&A IE RIR CC Low SSC PIE
Low Medium High
Probability ( 600) ( 400) ( 200) 0 200 400 600 Operating Activities Investment Activities Financing Activities Change in Cash
Figure 32. OCF, ICF, FCF and Change in Cash
Source: Author -250.00 -200.00 -150.00 -100.00 -50.00 0.00 50.00 2019 2020E 2021F 2022F 2023F 2024F EPS (x)
Economic Value Added (EVA)
Figure 33. EPS and EVA
Source: Author
Table 4. Risk Matrix
Source: Author
Source: Statista
Risk to price Target
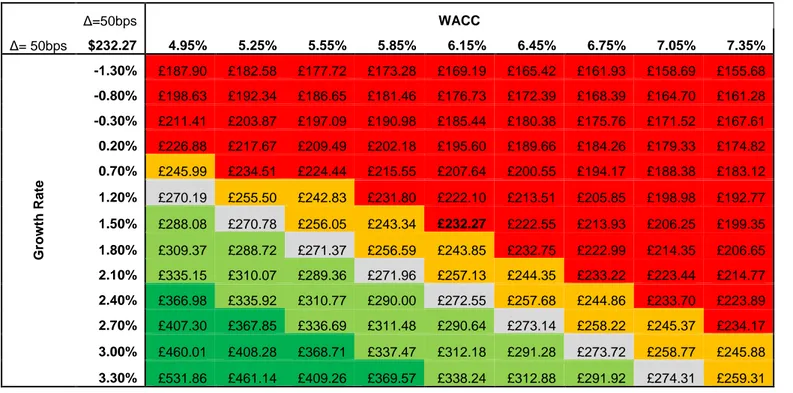
In order to evaluate Royal Mail plc, a number of assumptions have been made in order to know the impact that the investment risk have on price target. These risks include changes to key components of the DCF valuation model and other key factors for Royal Mail's business and can vary, for instance, by changing the growth rate, or cost of capital, or risk free rate.
Sensitivity analysis for changes in terminal growth rate and perpetuity WACC The Table 5 shows the possible results derived from variation in g and/or WACC. The g=1.50% with WACC=6.15% yields to a price target of £232.27. If, for instance, g=0.50% with WACC=6.65% yields to a price target of £189.70.
Δ=50bps WACC Δ= 50bps $232.27 4.95% 5.25% 5.55% 5.85% 6.15% 6.45% 6.75% 7.05% 7.35% G row th Rate -1.30% £187.90 £182.58 £177.72 £173.28 £169.19 £165.42 £161.93 £158.69 £155.68 -0.80% £198.63 £192.34 £186.65 £181.46 £176.73 £172.39 £168.39 £164.70 £161.28 -0.30% £211.41 £203.87 £197.09 £190.98 £185.44 £180.38 £175.76 £171.52 £167.61 0.20% £226.88 £217.67 £209.49 £202.18 £195.60 £189.66 £184.26 £179.33 £174.82 0.70% £245.99 £234.51 £224.44 £215.55 £207.64 £200.55 £194.17 £188.38 £183.12 1.20% £270.19 £255.50 £242.83 £231.80 £222.10 £213.51 £205.85 £198.98 £192.77 1.50% £288.08 £270.78 £256.05 £243.34 £232.27 £222.55 £213.93 £206.25 £199.35 1.80% £309.37 £288.72 £271.37 £256.59 £243.85 £232.75 £222.99 £214.35 £206.65 2.10% £335.15 £310.07 £289.36 £271.96 £257.13 £244.35 £233.22 £223.44 £214.77 2.40% £366.98 £335.92 £310.77 £290.00 £272.55 £257.68 £244.86 £233.70 £223.89 2.70% £407.30 £367.85 £336.69 £311.48 £290.64 £273.14 £258.22 £245.37 £234.17 3.00% £460.01 £408.28 £368.71 £337.47 £312.18 £291.28 £273.72 £258.77 £245.88 3.30% £531.86 £461.14 £409.26 £369.57 £338.24 £312.88 £291.92 £274.31 £259.31
Sensitivity analysis for changes in terminal βu and growth rate
The Table 6 shows the possible results derived from variation in βu and/or g. The g=1.50% with βu =6.87% yields to a price target of £124.61. If, for instance, g=0.50% with βu =0.87% yields to a price target of £202.57.
Table 5. Sensitivity analysis WACC and Growth Rate
Δ=50bps Growth Rate Δ=100bps $232.27 -0.50% 0.00% 0.50% 1.00% 1.50% 2.00% 2.50% 3.00% 3.50% Beta u nl e v e red -5.13 £586.75 £631.41 £683.97 £746.73 £822.98 £917.60 £1 038.13 £1 196.91 £1 415.57 -4.13 £452.44 £485.45 £524.31 £570.70 £627.07 £697.01 £786.11 £903.48 £1 065.11 -3.13 £359.20 £384.13 £413.46 £448.49 £491.06 £543.87 £611.15 £699.77 £821.81 -2.13 £292.84 £312.01 £334.57 £361.52 £394.25 £434.87 £486.62 £554.78 £648.65 -1.13 £244.57 £259.55 £277.19 £298.25 £323.84 £355.59 £396.04 £449.32 £522.69 -0.13 £208.78 £220.66 £234.65 £251.35 £271.64 £296.81 £328.88 £371.13 £429.31 0.87 £181.80 £191.34 £202.57 £215.98 £232.27 £252.49 £278.25 £312.18 £358.90 1.87 £161.14 £168.89 £178.01 £188.91 £202.14 £218.56 £239.48 £267.04 £305.00 2.87 £145.11 £151.47 £158.96 £167.90 £178.76 £192.24 £209.41 £232.02 £263.17 3.87 £132.52 £137.79 £143.99 £151.39 £160.39 £171.55 £185.78 £204.51 £230.31 4.87 £122.51 £126.92 £132.10 £138.28 £145.80 £155.13 £167.01 £182.66 £204.21 5.87 £114.49 £118.19 £122.55 £127.76 £134.09 £141.94 £151.94 £165.12 £183.27 6.87 £107.99 £111.13 £114.83 £119.24 £124.61 £131.26 £139.75 £150.92 £166.30
Regarding the table below, the fact that negative values start to appear in the lower left corner is due to the growth rate being greater than the WACC rate and the formula is valid only if the WACC is greater than the growth rate, as shown in equation below. Therefore, values that do not respect this condition should not be considered.
𝑷𝑽 (𝑻𝑽)𝒕 =
𝑻𝑽
(𝑾𝑨𝑨𝑪 − 𝒈)𝑻 , 𝒊𝒇 𝑾𝑨𝑪𝑪 > 𝒈
Table 6. Sensitivity analysis Beta and Growth Rate
Monte Carlo Simulation
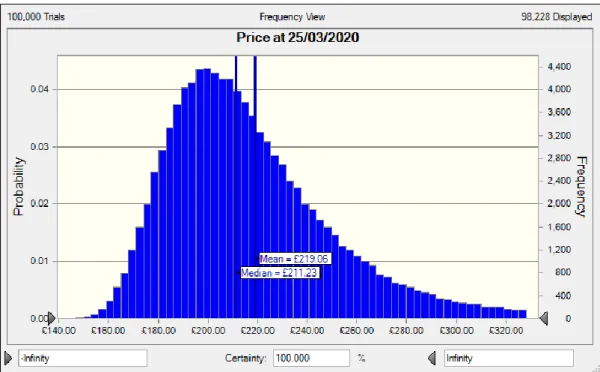
To complement the analysis to my price target, it was performed a Monte Carlo Simulation. It was used the Crystal Ball Software, covering a total of 100,000 trials and the forecast was mostly having in consideration the sensitivity with the growth rate and WACC. Having in consideration this two assumptions of sensitivity price distribution, the variable with major impact was WACC with 91.8% and growth rate with 8.2%. With the Monte Carlo Simulation, it is possible to establish that the mean of the price target is £219.06, representing a downside potential of 6.43% (Table 7), which is lower than the DCF-valuation of £232.27. The sell recommendation has a 59.57% probability of being accurate.
Monte Carlo Statistics
No. of Trials 100,000 Mean £219.06 Standard Deviation £38.94 10th percentile £180.88 90th percentile £265.17 Downside Potential 6.43% Source: AuthorFigure 35. Monte Carlo Simulation
Source: Author
Appendices
Appendix 1: Statement of Financial Position
BALANCE SHEET 2016 2017 2018 2019 2020E 2021F 2022F 2023F 2024F
Non-current assets
Property, plant and equipment 2 002 2 062 2 016 2 066 1 822 1 858 1 817 1 826 1 885
Goodwill 206 316 324 380 430 480 530 580 630
Intangible assets 451 567 608 631 538 607 666 717 760
Investments in associates and joint venture 9 7 5 5 5 5 5 5 5
Financial assets
Pension escrow investments 20 20 198 207 207 207 207 207 207
Derivatives 2 4 5 4 0 0 0 0 0
Retirement benefit surplus - net of IFRIC 14 adjustment 3 430 3 839 2 163 2 408 2 415 2 422 2 429 2 436 2 443
Other receivables 12 13 13 12 12 12 12 12 12
Deferred tax assets 9 15 72 64 40 0 0 0 0
6 141 6 843 5 404 5 777 5 469 5 591 5 666 5 783 5 942
Assets held for sale 39 37 50 36 36 36 36 36 36
Current assets 0 0 0 0 0 0 0 0 0
Inventories 21 23 25 27 28 30 32 33 35
Trade and other receivables 1 020 1 117 1 160 1 310 1 379 1 453 1 531 1 613 1 700
Income tax receivable 6 7 3 7 7 7 7 7 7
Financial assets
Derivatives 5 8 15 8 4 0 0 0 0
Cash and cash equivalents 368 299 600 236 454 333 173 71 27
1 420 1 454 1 803 1 588 1 873 1 823 1 742 1 725 1 769
Total assets 7 600 8 334 7 257 7 401 7 378 7 450 7 445 7 544 7 747
Current Liabilities
Trade and other payables 1 700 1 810 1 927 1 883 1 883 1 883 1 883 1 883 1 883
Financial liabilities
Interest-bearing loans and borrowings 0 33 1 0 0 0 1 0 606 Obligations under finance leases 84 64 59 37 30 44 0 0 0
Derivatives 33 9 3 3 2 0 0 0 0
Income tax payable 23 12 33 8 8 8 8 8 8
Provisions 151 88 59 58 58 58 58 58 58
1 991 2 016 2 082 1 989 1 981 1 993 1 950 1 949 2 555
Non-current liabilities
Financial liabilities
Interest-bearing loans and borrowings 392 430 436 431 430 536 546 589 100 Obligations under finance leases 136 130 110 88 58 14 14 14 14
Derivatives 8 2 4 2 0 0 0 0 0
DBCBS retirement benefit deficit 0 0 0 72 72 72 72 72 72
Provisions 96 108 103 104 104 104 104 104 104
Other payables 41 47 41 41 37 33 29 25 21
Deferred tax liabilities 469 603 45 55 50 50 50 50 50
1 142 1 320 739 793 751 809 815 854 361 Total Liabilities 3 133 3 336 2 821 2 782 2 732 2 802 2 765 2 803 2 916 Net assets 4 467 4 998 4 436 4 619 4 647 4 648 4 680 4 741 4 831 Equity Share capital 10 10 10 10 10 10 10 10 10 Retained earnings 4 451 4 940 4 381 4 576 4 604 4 605 4 637 4 698 4 788 Other reserves (3) 47 45 33 33 33 33 33 33
Equity attributable to parent Company 4 458 4 997 4 436 4 619 4 647 4 648 4 680 4 741 4 831
Non-controlling interests 9 1 0 0 0 0 0 0 0
Appendix 2: Statement of Financial Position (Common-Size)
BALANCE SHEET (Common-Size) 2016 2017 2018 2019 2020E 2021F 2022F 2023F 2024F
Period End Date
27-Mar-2016 26-Mar-2017 25-Mar-2018 26-Mar-2019 25-Mar-2020 26-Mar-2021 25-Mar-2022 26-Mar-2023 25-Mar-2024 Non-current assets
Property, plant and equipment 26.34% 24.74% 27.78% 27.92% 24.69% 24.94% 24.41% 24.21% 24.33%
Goodwill 2.71% 3.79% 4.46% 5.13% 5.83% 6.44% 7.12% 7.69% 8.13%
Intangible assets 5.93% 6.80% 8.38% 8.53% 7.29% 8.15% 8.95% 9.50% 9.81% Investments in associates and joint venture 0.12% 0.08% 0.07% 0.07% 0.07% 0.07% 0.07% 0.07% 0.06%
Financial assets
Pension escrow investments 0.26% 0.24% 2.73% 2.80% 2.81% 2.78% 2.78% 2.74% 2.67% Derivatives 0.03% 0.05% 0.07% 0.05% 0.00% 0.00% 0.00% 0.00% 0.00% Retirement benefit surplus - net of IFRIC 14
adjustment 45.13% 46.06% 29.81% 32.54% 32.73% 32.51% 32.63% 32.29% 31.54% Other receivables 0.16% 0.16% 0.18% 0.16% 0.16% 0.16% 0.16% 0.16% 0.15% Deferred tax assets 0.12% 0.18% 0.99% 0.86% 0.54% 0.00% 0.00% 0.00% 0.00%
80.80% 82.11% 74.47% 78.06% 74.12% 75.05% 76.11% 76.66% 76.70%
Assets held for sale 0.51% 0.44% 0.69% 0.49% 0.49% 0.48% 0.48% 0.48% 0.46%
Current assets 0.00% 0.00% 0.00% 0.00% 0.00% 0.00% 0.00% 0.00% 0.00%
Inventories 0.28% 0.28% 0.34% 0.36% 0.39% 0.40% 0.43% 0.44% 0.46% Trade and other receivables 13.42% 13.40% 15.98% 17.70% 18.70% 19.50% 20.56% 21.38% 21.95% Income tax receivable 0.08% 0.08% 0.04% 0.09% 0.09% 0.09% 0.09% 0.09% 0.09%
Financial assets
Derivatives 0.07% 0.10% 0.21% 0.11% 0.05% 0.00% 0.00% 0.00% 0.00% Cash and cash equivalents 4.84% 3.59% 8.27% 3.19% 6.16% 4.47% 2.33% 0.95% 0.34%
18.68% 17.45% 24.84% 21.46% 25.39% 24.47% 23.41% 22.87% 22.84%
Total assets 100.00% 100.00% 100.00% 100.00% 100.00% 100.00% 100.00% 100.00% 100.00%
Current Liabilities
Trade and other payables 22.37% 21.72% 26.55% 25.44% 25.52% 25.28% 25.29% 24.96% 24.31%
Financial liabilities
Interest-bearing loans and borrowings 0.00% 0.40% 0.01% 0.00% 0.00% 0.00% 0.01% 0.00% 7.82% Obligations under finance leases 1.11% 0.77% 0.81% 0.50% 0.41% 0.59% 0.00% 0.00% 0.00% Derivatives 0.43% 0.11% 0.04% 0.04% 0.03% 0.00% 0.00% 0.00% 0.00% Income tax payable 0.30% 0.14% 0.45% 0.11% 0.11% 0.11% 0.11% 0.11% 0.10% Provisions 1.99% 1.06% 0.81% 0.78% 0.79% 0.78% 0.78% 0.77% 0.75%
26.20% 24.19% 28.69% 26.87% 26.85% 26.75% 26.19% 25.84% 32.98%
Non-current liabilities
Financial liabilities 0.00% 0.00% 0.00% 0.00% 0.00% 0.00% 0.00% 0.00% 0.00% Interest-bearing loans and borrowings 5.16% 5.16% 6.01% 5.82% 5.82% 7.19% 7.33% 7.81% 1.29% Obligations under finance leases 1.79% 1.56% 1.52% 1.19% 0.79% 0.19% 0.19% 0.19% 0.18% Derivatives 0.11% 0.02% 0.06% 0.03% 0.00% 0.00% 0.00% 0.00% 0.00% DBCBS retirement benefit deficit 0.00% 0.00% 0.00% 0.97% 0.98% 0.97% 0.97% 0.95% 0.93% Provisions 1.26% 1.30% 1.42% 1.41% 1.41% 1.40% 1.40% 1.38% 1.34% Other payables 0.54% 0.56% 0.56% 0.55% 0.50% 0.44% 0.39% 0.33% 0.27% Deferred tax liabilities 6.17% 7.24% 0.62% 0.74% 0.68% 0.67% 0.67% 0.66% 0.65%
15.03% 15.84% 10.18% 10.71% 10.17% 10.86% 10.95% 11.32% 4.66% Total Liabilities 41.22% 40.03% 38.87% 37.59% 37.02% 37.61% 37.14% 37.16% 37.64% Net assets 58.78% 59.97% 61.13% 62.41% 62.98% 62.39% 62.86% 62.84% 62.36% Equity Share capital 0.13% 0.12% 0.14% 0.14% 0.14% 0.13% 0.13% 0.13% 0.13% Retained earnings 58.57% 59.28% 60.37% 61.83% 62.40% 61.81% 62.28% 62.27% 61.81% Other reserves -0.04% 0.56% 0.62% 0.45% 0.45% 0.44% 0.44% 0.44% 0.43% Equity attributable to parent Company 58.66% 59.96% 61.13% 62.41% 62.98% 62.39% 62.86% 62.84% 62.36% Non-controlling interests 0.12% 0.01% 0.00% 0.00% 0.00% 0.00% 0.00% 0.00% 0.00%
Appendix 3: Income Statement
INCOME STATEMENT 2016 2017 2018 2019 2020E 2021F 2022F 2023F 2024F Period End Date
27-Mar-2016 26-Mar-2017 25-Mar-2018 26-Mar-2019 25-Mar-2020 26-Mar-2021 25-Mar-2022 26-Mar-2023 25-Mar-2024 Continuing operations Revenue 9 251 9 776 10 172 10 581 11 296 11 405 11 521 11 639 11 758 Operating Costs 8 766 9 286 9 936 10 107 10 832 10 904 10 982 11 062 11 142 Operating profit before transformation costs 485 490 236 474 464 501 539 577 616 Transformation costs 191 137 113 133 150 235 235 235 235 Operating profit after transformation costs 294 353 123 341 314 266 304 342 381
Operating specific items
Impairment of assets relating to GSO and
Postal Express businesses 0 0 0 68 0 0 0 0 0
Accounting impact of RMSEPP buy-in
settlement 0 0 0 64 0 0 0 0 0
Employee Free Shares Charge 158 105 33 22 8 0 0 0 0
Legacy/other costs 2 18 8 7 7 7 7 7 7
Amortization of intangible assets in
acquisitions 0 11 16 20 20 20 20 20 20
Operating profit 138 219 66 160 279 239 277 315 354
Non-operating specific items
Profit on disposal of property, plant and
equipment 29 14 71 15 15 15 15 15 15
Loss on disposal of business 0 2 0 0 0 0 0 0 0
Earnings before interest and tax 167 231 137 175 294 254 292 330 369
Finance costs 16 18 19 18 17 16 14 15 16
Finance income 3 2 3 5 3 3 3 3 3
Net pension interest (non-operating specific
item) 113 120 91 79 86 86 86 86 86
Profit before tax 267 335 212 241 365 326 366 404 442
Tax credit/(charge) 45 62 46 66 88 75 84 93 102
Profit for the year from continuing operations 222 273 258 175 278 251 282 311 341
Discontinued operations
Profit from disposal of discontinued operations
(non-operating specific item) 31 0 0 0 0 0 0 0 0
Tax on profit from disposal discontinued
operations (5) 0 0 0 0 0 0 0 0