Portuguese data on child work:
what does it encompass
Abstract: After the analysis of different meanings of child work, we go through neoclassical microeconomic model and its insufficiencies in explaining this phenomenon. Focusing in the Portuguese case, we use the data available to depict the distinctive characteristics of working and nom-working children. We conclude that even in developed countries child labour is still mainly linked with the economically, socially and culturally less privileged.
Keywords: child work, microeconomics, Portugal, survey data, discriminant analysis.
J.E .L. C1, D1, J4, I2.
By: Margarida Chagas Lopes
Pedro Goulart
Lisbon, December 2002
( On behalf o CISE P’s research scholarship programme)
Index
1. Introduction ……… .2
2. Leading Concepts ………... .2
3. A microeconomic analysis of child work ………....3
The neo-classical model ……… 3
The model critical approach – some issues ……….. 5
4. Child work: a social construct ………. 5
5. The Portuguese case ……… 6
Dualities ………. ..7
Education and labour market ………. ...7
6. Data analysis on child work ……….………8
Methodology………. ...8
Discriminant Analysis Results for 1998 ………...9
Discriminant Analysis Results for 2001 ………-……….. …10
Discriminant Analysis: A comparison between 1998 and 2001 …10
7. Conclusion……….. 13
8.A Appendix A………. 14
8.B Appendix B ……….14
1. Introduction
The main purpose of this paper is to access child labour in Portugal. Provided the quite complex etiology of the phenomenon, as well as the relative lack of tradition of this kind of studies among us, this research is an exploratory essay, although we have got to shed some light into its major determinants and features. Furthermore, child work databases are still the outcomes of quite recent statistical procedures, which underlying methodology, leading assertions and hypothesis we will try to assess as well.
Regarding definitions and operative concepts, approaching methodologies and statistical modelling, much has been said in international discussions, being the path for universal consensus on these matters still long. That is why we begin by presenting some of the diverse assertions under which child work is currently disguised or exhibited, in order to make clear our research object.
The contribution brought by neoclassical economics to the understanding of the phenomenon is then reviewed and therefore criticised in its leading hypotheses and developments. Among these ones, we stress the limitations of economics to access such a complexity, provided the social construction in which basis child work takes place and then refer to this social diversity.
Finally, we consider the Portuguese case, on the basis of each one of the two enquiries available as yet and comparing the corresponding results, as well. Search for data profitability, mostly in what has to do with mixed nature variables, advised us to select a non-parametric statistical tool – discriminant analysis – in the basis of which we arrive at the major outcomes and features behind child work in Portugal.
2. Leading Concepts
Much of the controversy in the child labor debate is due to the diversity of meanings and misleading assertions through which the process is quite frequently approached. In terms of the activities performed, child labor has firstly been associated with paid work, mostly as an outcome of the industrial revolution, but in more recent times, the concept has been extended to the whole economic activity. That is to say, it includes now all the activities that contribute to the national accounts, therefore adding non- paid family work to salaried work. This may be referred as’’ economically active children.’’
In terms of age, there are also different sets of children. The 1989 United Nations’ Convention on the Rights of the Child considers children under 18 years old and UNICE F protects children from harmful work for the minor’s psychological, physical and social development. In the 1973 Minimum Age Convention, the International Labor Organization established 15 as the minimum age for work in article number 138, but allowing for light work after the age of 12. The international agreements do not cover all kinds of work, meaning that child work exceeds economically active children and this exceeds the forbidden child work.
E ach country legislation normally takes also its own compulsory school average age into account. In the case of Portugal, compulsory school stands for 9 years, which most minors end by the age of 15. By 15 and under parental permission, or whenever minors are heads of household, certain kinds of work are then allowed; this permission is enlarged by the age of 16 and finally, at 18, full permission to work is then set.
Besides the above assertions, it must also be stressed the worst forms of child work, like prostitution, street kids and others, considered to be the most dangerous to their health and future development. Recently, there has been an international convergence in discourse to primarily focus on these activities, targeting their elimination. This resulted in 1999 ILO Worst Forms of Child Labor Convention, forbidding these kinds of work for minors under 18 (article number 182).
It is also possible to make a distinction according to the length of the activity performed: it may be considered the whole year or, alternatively, a more precise cut in time as, for instance, the previous week. The former measures all the work relative to children involved in activities during the year, providing an assessment for regularly performed activities. The latter refers to the fact that many activities developed by children have a strong seasonal component. Another important distinction is if it is the minor himself or his/ her household representative that reports the child work activity.
This research means to focus on the whole activity of minors, thereby comprising both economic and domestic work. The population under study is aged from 6 to 15, according to the average ages for compulsory school enrolment and the range established by the Portuguese survey data, as well.
It is preferable to use last week reference to determine the number of children commonly enrolled in work. Comparing different months, the week previous to the survey seems to be adequate for a child work seasonality-free balance. It is also preferable to focus on the minors’ answers instead of their representatives’, as if there is some over-estimation it would be almost certainly smaller than the under-estimation from other minors and also from their parents. This is mainly due to the way society perceives child work, assuming it as natural, especially domestic work, and also to the accommodation to the ‘facts of life’.
3. A microeconomic analysis of child work
The neo-classical model
amount of supplied working hours as the wage rate grows. Provided there will not be any other income except the wages outcome, this ‘substitution effect’ will be lasting until some reference level income will be reached, thereafter giving room to the complementary ‘income effect’.
When the analysis is enlarged to take into account not only the individual’s behaviour but the household’s, neo-classical authors still go on imposing the same hypothesis relative to ‘substitution’ and ‘income effects’, as a rule. Nevertheless, the trade-off relationships become now more complex, given that – for an average wage rate- there are now more than one wage-earner; and so, this leads to cross-decisions as to the whole working hours supply1 and, specially, concerning their redistribution among the two/or the several paid
workers, this last question becoming most important in the framework of child work.
In figure 1 we represent the model relative to the entry of children into the labour market; it can also easily incorporate the cases for non-paid and domestic work, throughout the introduction of a shadow-wage for those activities. We display in the horizontal axis the number of working hours supplied by the household and in the vertical axis the household’s income level. We can identify the point A that can be understood as the minimum income earned by the household without performing any activity. This extra-wage income can result from rents, profits, dole, minimum income programme, citizenship income or, yet, from benefits coming from education, health or social security. It strongly varies among families, regions and countries. We also consider the existence of a survival threshold, corresponding to the straight line R. The straight lines AC or/and AD are related to the income earned by household’s adults, represented by the wage rate. DD’ and CC’ stay for the possible wage rate of the child. The graphical model was built considering an household with two adults and one child, but it can easily be extended for another composition of the household: it will be enough to change the global number of hours worked.
One of the assumptions of the model, fairly based in empirical evidence, is that children receive lower remuneration for their work. We can see this by comparing children’s wage rate (inclination of CC’ or DD’) with the wage rate for the adults (with always an higher slope, in both cases). This feature is explained by the fact that children will be less productive than adults, but also because children are under-protected and easily exploited. The model still holds for two specific, though very common, cases. The first one, has to do with the situations in which children are not paid directly their wages but, instead, some other member in the family will receive them; the other, concerns non-paid activities, as domestic work, where children’s activity and effort should actually be valued as one of the household wealth components. The figure also allows the determination of the effect exerted by the household income upon child’s potential labour supply.
In the situation 1, C’ is the amount of working hours supplied by the household, including the minor, necessary for reaching the survival threshold. If we consider situation 2, which stays for another household with higher adults’ wage rate or, simply, the same household with an increase in wage rate, the straight line rotates up, based in point A. This way, we can verify that fewer hours of child’s work are then needed for reaching straight line R. This means that the level of household’s income is associated with child work throughout a negative correlation: the amount of child work will be smaller when the income will be higher. If we consider that an higher household income is related to persons with more
years of education, we will also find a negative correlation between the education level of parents and child work.
In situation 3, the household does not need child work for reaching the survival threshold. There will be then lower probabilities for the household children to work. In other words, an eventual child work will not be directly due to economic needs but to other determinants influencing household’s preferences and, consequently, indifference curves.
Income
D’
Situation 3 D
Situation 2
R C’
Situation 1
C
A
Hours of work
Figure 1. Microeconomic Analysis on Child Work
Notes:
Horizontal Axis – number of hours worked by the household Vertical Axis – household’s income level
Point A – minimum income earned by the household without performing any activity Straight line R – survival threshold
Straight line AC or AD – level of income earned by household’s adults
Straight line CC’ or DD’ – contribution of the child for the household income.
The model critical approach – some issues
household has a single utility function is dubious: it is easy to accept the argument that preferences between parents and children may differ. Here, we are making the assumption that the parent’s utility function is a single one, which is also not unanimously accepted. It also deserves to be mentioned the generally good acceptance of child’s work we could observe in several studies2, what might be understood as a resignation to one’s fate. Another possible explanation is that what is most often considered to be the best strategy in individual terms, should not necessarily be the one that better suits to the social reproduction of the household.
Thirdly, the conventional assumption under which individuals or households base their behaviour on some form of optimisation must be considered as a social by-product and therefore contextually relative – it remains, for example, negatively perceived in some societies where there are a low number of children. Lastly and related to the latter, the assumption on an household’s desired children function made by several authors and its link to child labour does not hold if we focus in reality3.
In sum, it is not possible for a microeconomic model to capture all the complexity of a phenomenon as child work, although it can helps us to understand some of its mechanisms.
4. Child work: a social construct
Human societies have been facing an increasing interaction and cooperation within their members since the cavern times until now. As societies grew more complex the division of labour became more important, not only across individuals within the same society, but also across societies. An international world order was built, where countries and classes would perform different roles in the international and national hierarchies. After centuries of history, it now faces new stages and challenges when globalisation goes stronger.
Child work must be perceived as a part of all this. It is mostly influenced by the mode of production, as the social relations are defined within and across societies determining hierarchies among countries and within societies, the tasks for each class, age and gender groups. Child work is mainly a social construction and must be faced accordingly.
The refusal over child work is rather new if we consider human history. It is but recently that society started facing children and even youngsters as in a specific phase of human development, thereby specifying their rights and obligations. The inexistence of childhood prevailed across times and societies ; a perceived moment of learning how to live in society, in spite of some prior particular rites associated, being the only distinction between old and young. It follows that the work of children was considered not to be different from the adults’. They were considered as just less strong workers, being attributed accordingly one of the lowest ranks in society and smaller remuneration. The insertion into regular life was much quicker.
With the advent of the industrial revolution and the generalisation of salaried work, social relations of production changed deeply, particularly in E urope. Child labour was no longer a means of learning and living, to become mostly an economic activity. This is a debate that
2 See for example PE E TI (2000).
is still present, especially when we face rural/urban differences and the development of a country.
5. The Portuguese case
On studying child labour, most efforts have been dedicated to focus on developing countries as they face the most severe realities. This has currently led to the negligence of similar realities in the so-called First World.
But if the child labour phenomenon in the Third World can reach a rather extreme character, as in the cases of prostitution and slavery, we should not ignore the other existing forms of child work, which can deeply harm youngsters. As we said, child work in developed countries is mainly linked to the less privileged, contributing most of the times to the increase of a dangerous phenomenon: the widening of relative poverty within these countries. E ven when fundamental needs have been fulfilled, the eruption of other needs may lead to child work. The expansion of consumption, and most importantly, the spread of mass consumption, led other products than food, health and shelter to become as important as those ones. This may involve goods and services highly valued by society, but not accessible for everyone.
As a matter of fact, the strong wish for consumption frequently stays as a backlash towards children’s work, even though there should not be any special need for children to work inside the household. In such cases, be it an outcome of the youngsters autonomous strategy or the result of some sort of indifference or accommodated acceptance from the child’s relatives, as previously referred, school attendance and, mostly, educational development, will always be affected. Child work will harm present education and consequently their future earnings (Burgess et al, 2002).
As it can easily be seen throughout the more recent human capital approaches and life cycle analysis, age still goes on exerting a strong impact upon skills up-grading trajectories. And this because of an interplay of several explaining features, such as: the smaller opportunity costs of education for the youngsters; the higher probability of job losses, occupational downgrading and reward stagnation or decreasing, for the ‘second opportunity education’ strategies; the growing labour market instability and the corresponding smaller rates of returns to education as time goes by…Features like the above ones seem to play a major role in the Portuguese life cycle activities for both gender, but specially for women.4
Being one of the poorest countries in the E uropean Union, Portugal has frequently been designated among the developed countries as one with the most worrying figures on child labour. During last years, government finally recognized the problem, taking action against child labour with the promotion of surveys in 1998 and 2001, several studies and propaganda. In Portugal, the regulationist view is prevailing (Goulart 2002) and the minimum age was fixed between 15 and 16 years, depending on the cases, but always conditional to minimum school completion. But there are still other problems linked to the very specific Portuguese reality. This way, explaining child labour in Portugal is far from being simple.
Dualities
Portugal cannot be considered as an homogenous country. There is not one single reality, there are many of them. There can easily be easily seen the dualities between urban/rural, male/female, modern/traditional sector, coastal/interior areas, north/south, among others. In the urban areas, mostly set near the coast, the most populated and richer areas may be found, in spite of the perseverance of poor neighbourhoods. The population density is higher, being reinforced by rural migrants across the decades. In these areas, child labour is mainly linked to the informal sector, being now camouflaged with subcontracting methods. The minor may receive a monetary compensation/”salary”, in kind or even nothing, this latter cases being called non-paid family labour. Parents working at home may earn for a piece and any extra hand would be helpful. There is a common acceptance, although tending to change, that it is better to work than “having nothing to do“. A particular case in the Portuguese child labour typology is Algarve, where most child labour is linked to tourism and close activities.
Rural areas have seen their population leave, looking for better opportunities in other countries or in the urban areas. This process was stronger in the 50’s and 60’s, but still continues. The migrants are mostly young people, thereby reducing human resources but also the possibilities for human reproduction. In recent years, some rural areas have seen immigrants flow in as an answer to the shortage of labour supply in agriculture. This is due to the fact that migration of Portuguese is not necessarily linked to the mechanization of agriculture; instead, these migrants look for a better job in the urban areas. E ven in these ones, much is concentrated in the urban areas of Lisbon and Oporto. In rural areas, the most usual child labour is performed within agriculture, very often “conciliated” with school, specially in the North and Centre of Portugal, where small land ownership still prevails. This kind of child labour encompasses a strong component of socialization and is clearly embedded in community culture.
E ducation and labour market
A problem that fosters child work is the average low level of educational attainment among the Portuguese population. The almost five decades of dictatorship left a country traditionally poor according to these records even farther from its fellow E uropean countries. With the end of the dictatorship, in 1974, one of the prime goals was to provide literacy to adults and to guaranty a generalized education for all.
It appears now clear to us why there are so many dropouts among the Portuguese young scholars and also how these youngsters are condemned to face low-skill job opportunities. Most of the vacancies offered to them are, actually, inserted into the informal or semi-legal economy, with a strong seasonal component, being furthermore very difficult to regulate. If in textiles, construction and shoemaking, minors’ work is more easily inspected, subcontracting and labour shift from factories to family homes are strong opponents to it. In terms of agricultural labour, it is virtually impossible to investigate, leaving few chances for coercive measures. A recent introduction of the Guaranteed Minimum Income5 has
given a complement to households’ income, allowing children to go to school – it is one of the requirements for the program. Furthermore it has also been effectively targeted and contributed for reducing the poverty gap (Farinha Rodrigues 2001). Still, Portugal has a long way to go.
In sum, socio-economic Portuguese features generate a still favourable environment to child work, even if improvements have been clear. This leads to unfortunately high child work records: in spite of the existing well up-to-date legislation, law enforcement is still failing quite often.
6. Data analysis on child work
Methodology
The data
The phenomenon of child work is complex and embedded in multiple characteristics of society. In this sense, the data used for its study must cover a wide range of areas, such as social, economic, cultural, among others. The two databases6 in which we based our study
gather much of these types of information, both in qualitative and quantitative terms. Data refers to 1998 and 2001, being the latter the outcomes of a second enquiry launched in sequence of the former, although any comparisons and conclusions on evolution trends should be carried quite carefully. This is due mostly to the fact that several questions have been improved, some others removed, and also the sample is not the same for both enquiries. Furthermore, the context is different, leading to different analytical outcomes. If the 2001 database is richer, it lost some information compared to 1998, which would be important to allow for control.
Discriminant A nalysis
In face of the richness of data, we preferred to use a non-parametrical model, in order to take into account mixed data, mostly quantitative as well as qualitative one. Actually, this kind of statistical methodologies is by far much broader as to the scope of variables which relationship they are able to take into consideration; and despite their weaker robustness as to statistical accuracy when compared with parametric models, successive testing procedures allow us to identify and select quite reliable adjustments, with no need for giving up most meaningful variables and thereby amputating the global explanation.
5 Recently (December 2002), the Portuguese Constitutional Court pronounced against the new government
reform according to which the under 25 years’ would no longer be eligible for this kind of support. As a matter of fact, Portuguese labour market severely penalises this age cohort, strongly affecting their earning capacity.
6 From two enquiries “Social characterisation of the Portuguese households with schoolage children”
In this light, we decided to carry several Discriminant Analysis adjustments, with the aim of separating, as clearly as possible, the two under analysis groups: working and non-working children. With this kind of methodology, we are then able to set the leading variables for which homogeneity among working children appears to be the larger, as well as differentiation between those two groups of children becomes the utmost.
For an overall fitness testing, we use the number of correctly classified cases, Wilk’s Lambda and the canonical correlation, which are not always conclusive altogether, in the sense that they may not imply the same inference intensity. Being aware of these kind of limitations and, surely, of the fact that each variable’s influence strongly depends on the specific set of relations we consider, let us now present the leading outcomes we arrived at.
Discriminant Analysis Results for 19987
Applying the discriminant analysis for the 1998’s dataset, we obtained two quite good adjustments, F1 and F2, whose statistical test values were the ones presented in table 1.
Table 1 – Overall fitness of the adjustment % of Correctly
Classified Cases
Canonical Correlation
Wilks’ Lambda Chi-square (significance level)
F1 (1,2) 91.6 0.561 0.686 0.000
F2 (1,2) 91.6 0.560 0.686 0.000
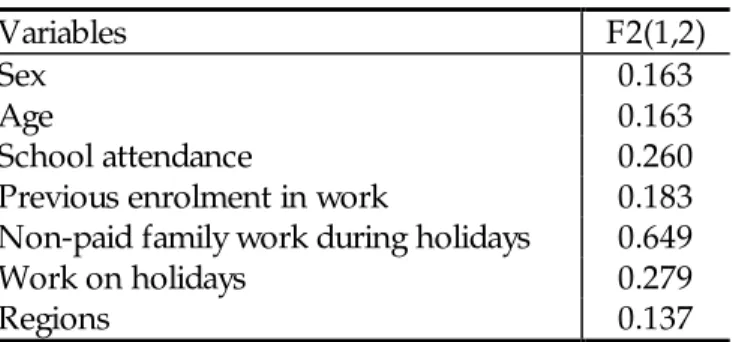
Taking these functions, which show almost no differences in the quality of the adjustment, it is difficult to depict any difference between their capability of discriminating group 1 from group 2, that is to say from ‘children who don’t work’ and ‘working children’. Function F1 includes some ten more variables than F2, being the latter the result of a focus on the variables that seemed more relevant according to our methodology. An indicative threshold of 0.10, in absolute values, on standardized canonical discriminant function coefficients was followed. In table 2, we show the set of variables for which the adjustments comply with our proposed significance level 8.
Table 2 – Relevant variables for 1998
Variables F2(1,2)
Sex 0.163
Age 0.163
School attendance 0.260
Previous enrolment in work 0.183
Non-paid family work during holidays 0.649
Work on holidays 0.279
Regions 0.137
The above results show that summer activities performed by children, either as non-paid family workers or through paid job, reveal to be the leading discriminant variables. Both may be seen as performing quite well as a proxy for the family socio-cultural and economic status. Furthermore, school attendance also plays an important role; sex and age, better than region, overcome the 10% level as well, though exhibiting the smallest values for the standardized coefficients. A final remark goes to the values relative to previous enrolment
in work as representative of the endogeneity of child labour, suggesting that this feature not only constrains minor’s present daily life but also his/her future development.
Discriminant Analysis Results for 20019
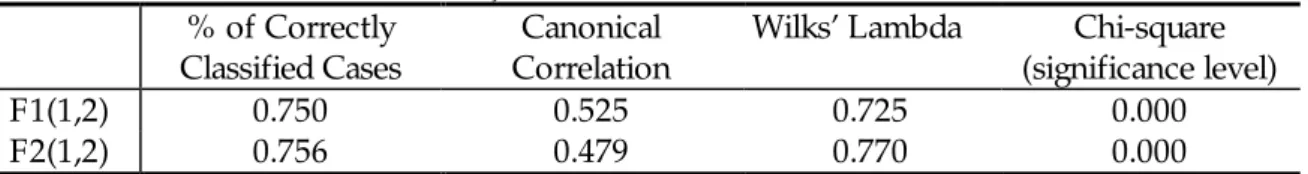
For 2001, the discriminant adjustments display a better performance than for 1998 and their statistical test values are quite good too. Table 3 presents the results for the two more relevant functions found. Although quite similar in accuracy on correctly classified cases, with a slight advantage for F2, F1 displays better results for the canonical correlation and Wilks’ lambda.
Table 3 - Overall fitness of the adjustment % of Correctly
Classified Cases
Canonical Correlation
Wilks’ Lambda Chi-square (significance level)
F1(1,2) 0.750 0.525 0.725 0.000
F2(1,2) 0.756 0.479 0.770 0.000
Considering F1 and F2 and the same significance level as before (0.10) for the absolute values of the standardized canonical discriminant coefficients, we obtain several significant discriminant variables. In Box 1, we present variables assuming values within the range 0.1-0.210.
Box 1 - Values for the standardized canonical discriminant coefficients between 0.1 and 0.2 for functions 1 and 2.
Function F1: Condition of dwelling (0.170); back yard or small farm (-0.113); maid services (-0.183); Received support to elderly/deficient (0.172); Reason for last medical appointment (answered by the minor) (0.154); School ambition (-0.148); Attending courses on foreign language outside school (0.120); Working for an employer during summer (0.105); Relation with school (answered by the child’s representative) (0.178); Reason for last medical appointment (answered by the representative) (-0.185); Practice of sports activities (0.175); Value of monthly allowance (answered by the representative (-0.100); Unemployment spell (-0.117); Representative does not know how minor spends his/her spare time (0.178).
Function F2: Household members per room (0.192); Complete bathroom (0.117); back yard or small farm (0.173); Sex (-0.114); Nursery school (-0.131); Means of transport to school (-0.174); Attending music courses outside school (-0.165); Being in school during last week (0.133); Relation with school (answered by the minor) (-0.122); Receiving State Minimum Income (0.130); Attending computer courses outside school (0.147); Living always in this location (-0.103); Value of monthly allowance (answered by the representative) (0.157); Time commuting home-school’ (0.198); Tutoring outside school (0.154); School ambition (0.113).
If we now turn to the leading discriminant variables, presented in table 4, it is possible to analyse and compare more directly the two functions.
The main discriminant variables in Function 2 are by far distance ‘Receiving state support’ and ‘Receiving other type of support’. ‘Non-paid family work during summer’, ‘Family
support’, ‘Age’ and ‘Number of persons in the household’ should also be referred as deserving special interest. An important remark goes to the fact that the most relevant variable in F2 is not being considered in F1. In the latter, ‘Financial support (excluding State Minimum Income)’, ‘Number of persons in the household’ and ‘Receiving other type of support’ are the most relevant. Also important are ‘None activity outside school’, ‘Household members per room’, ‘Sewage’, ‘Age’, ‘Non-paid family work during summer’, ‘Missing school’, ‘Nanny or nursery school’ and ‘Catechism’.
Table 4
V ariables F1 F2
Financial support (excluding State Minimum Income) 0.509 -0.264
Number of persons in the household 0.480 -0.326
Receiving other type of support 0.456 1.490
None activity outside school 0.387 -0.269
Household members per room -0.365 (0.192)
Sewage 0.345 ---
Age 0.321 -0.331
Non-paid family work during summer 0.318 -0.375
Missing school 0.314 -0.239
Nanny or nursery school 0.311 -0.223
Catechism 0.309 -0.289
Monthly global income 0.288 -0.293
Sex 0.268 (-0.114)
Attending computer courses outside school -0.262 (0.147)
Income reduction during last year -0.246 ---
Attending music courses outside school 0.221 (-0.165)
Family support -0.218 0.339
Complete bathroom -0.210 (0.117)
Receiving State Minimum Income -0.207 (0.130)
Condition of dwelling (0.170) -0.232
Maid (-0.183) 0.271
Receiving support to elderly/deficients (0.172) -0.252
Receiving state support --- 1.820
Note: The table only displays the variables more relevant in explaining child work. Values within parenthesis indicate being under 0.2 for one function, but beyond this threshold on the other.
In both cases there is strong evidence of the need for support as the main discriminant driving force, namely public ‘Received state support’ or from another kind ‘Received other type of support’ in F2 and ‘Financial support (excluding State Minimum Income)’ or ‘Received other type of support’ in F1. These results stress the effect of the family economic precariousness upon the differentiation between working/not working children. As for the ‘Number of persons in the household’ in F1, but also for the other relevant variables in both functions, it offers the means for depicting a social, economic, cultural characterization of the minor and his household, which we do next in Box 2.
So, according to the previous outcomes for both functions, we can try a rather synthetic typology for the 2001’s working children, as follows:
-
in spite of this, both monthly global income and any possible breakdown in the family revenue, appear to exert a smaller, although meaningful, impact than it could be expected – should this reflect, then, the levelling and stabilising effects associated with the outcomes of the above safety nets ?-
it seems also most probable to find working children in crowded dwellings, where both the high number of persons by room and the relative absence of comfort utilities become a norm;-
missing school, as well as not having attended nursery or nanny, also seem to exert a quite meaning influence on being a working child;-
finally, working children seem to rarely attend other activities outside school, except for helping with family work.Box 2 - Distinctive characteristics between working and non-working children.
School
F1 ‘Missing school’2 F2 ‘Missing school’3
E conomic Status
F1 ‘Household members per room’2; ‘Sewage’2, ‘Nanny or nursery school’2; ‘Complete bathroom’3, ’Monthly global income’3; ‘Income reduction during last year’3
F2 ‘Monthly global income’3, ‘Condition of dwelling’3; ‘Maid’3, ‘Nanny or nursery school’3
Individual and household characteristics
F1 ‘Number of persons in the household’1; ‘Age’2; ‘Sex’3 F2 ‘Number of persons in the household’2; ‘Age’2
Safety nets
F1 ‘Financial support (excluding State Minimum Income)’1, ‘Receiving other type of support’1; ‘Family support’3; ‘Receiving State Minimum Income’3
F2 ‘Receiving state support’1, ‘Receiving other type of support’1; ‘Family support’2; ‘Financial support (excluding State Minimum Income)’3, ‘Receiving support to elderly/deficients’3
Culture & hobbies
F1 ‘None activity outside school’2, ‘Non-paid family work during summer’2, ‘Catechism’ 2; ‘Attending computer courses outside school’3, ‘Attending music courses outside school’3 F2 ‘Non-paid family work during summer’2; ‘Catechism’ 3, ‘None activity outside school’3 Note: 1,2 or 3 correspond to the degree of importance of each variable. From 1 max (over 0.4) to 3 min (over 0.2 and under 0.3).
Both functions stress the relevance of the different kinds of safety nets of in identifying the minors in risk, belonging to an underprivileged skirt of society. E ven being “more supported” than the rest of population, this is not enough to avoid child work. Links either to the inefficient11, either to insufficient support may be made, with important, although probably contradictory, conclusions for policy implications. A relevant feature in this framework is the smaller importance deserved by ‘Receiving State Minimum Income’, which may be the result of two effects: lack of reporting child activity by fear of withdrawing of subsidy; the program has indeed succeeded in reducing child activity linked to the requirement of minor’s school attendance. The result of this counter forces is undetermined, requiring data not available as yet. However, in either case, we wonder if the results would not become quite different, if we could take into account not only school attendance but also ‘school efficiency’ as well.
11 This seem not to be the case. See Farinha Rodrigues (2001) that finds evidence for target efficiency and
Discriminant Analysis: A comparison between 1998 and 2001
Despite being difficult to compare the results for the two years, given the reasons we have mentioned above in the methodology, in this section we try to make the possible comparison. From this, the following outcomes reveal to be quite impressive:
-
family income, income variations (for 1998) and most particularly the corresponding room for support both from public, family or other sources (for both years), appear to be the leading differentiating factors;-
school attendance, as well as nursery school frequency, also deserve an important mention, as well as attending no other extra-school activity than catechism (specially for 2001);-
other school characteristics do not seem to be very relevant in our discriminant analysis; much of it probably due to the difficulty on the measurement of ‘school efficiency’;-
only the 10% significance level allows the effect of ´socio-economic status’ variables to appear, be it under the form of ‘attending music’ and/or ‘computer courses outside school’. As to this question, another variable – ‘maid’ – is deserving a special mention, as it actually performs above the 20% significance ceiling we have proposed;-
finally, individual characteristics, like sex and age, seem to deserve an importance smaller than it would be expected, specially for 2001; as to sex, should we consider this outcome as an indicator of the loosing in importance of domestic tasks performance or, merely, a result of the changing in the enquiry structure between the two years, it certainly deserves a further in-depth analysis.7. Conclusion
In the end of this paper we must conclude that child labour is essentially an historically and socially constructed phenomenon. It can be partially understood if considered as a part of an household survival strategy, which includes many decisions about the division of labour, investments in education and living arrangements. Preferences of the involved agents are based on their cultural and social framework. This leads to a variation in child labour, even in the same country. However, those decisions are by no means free. The household is largely constrained in the process of decision, not only by the values embedded in its socialization process, but also by the surrounding environment. This strengthens the argument within child labour debate that it is a structural problem and cannot be fight just with patch measures. For this, it has to be understood that most child labour’s causes are directly or indirectly connected with a broad concept of poverty. E ven in developed countries child labour is still mainly linked with the economically, socially and culturally less privileged, in spite of being less deterministic than the developing countries’ reality. The study of the Portuguese case confirms these reflections, but also gives more specific and new insights.
8.A Appendix A
– 1998’s variables displaying standardized canonicaldiscriminant function coefficients over 0.02 until 0.1 (values over 0.05 in brackets)
father relating to minor); ‘Household global monthly income’; ‘Household members per room’; ‘Condition of dwelling’; ‘Sewage’ (-0.054); ‘Fully equipped bathroom’; ‘Telephone’; ‘Hi-fi set’; ‘Washing machine’; ‘Microwaves’; ‘Bicycle’; ‘Motorcycle/scooter’ (0.76); ‘Automobile’; ‘Permanence in the same location’; ‘Number of years in the same location’; ‘Financial support excluding State Minimum Income’; ‘Nanny or nursery school services attendance’; ‘Family household breakdown’; ‘Bank account ownership by household members’; ‘Attending a special class’; ‘Number of failed times in school’ (0.091); ‘Relation with school’ (answered by the minor); ‘No private course attendance out of school’; ‘Last year’s school attendance’ (-0.98); ‘Time minor gets up’; ‘Monthly allowance or pocket money’ (answer by father relating to minor); ‘Minor engaging in vocational training’.
8.B Appendix B
– 2002’s variables displaying standardized canonical discriminant function coefficients under 0.10.F 1 – values under 0.1 but important for the adjustment of the model.
‘Food support’; ‘Nursery school’; ‘Means of transport to school’; ‘Relation with school’ (answered by the minor); ‘Value of monthly allowance’ (answered by the minor); ‘Number of rooms’; ‘Failure at school’; ‘Living always in this location’; ‘Relationship/kinship with the representative’;
F2 – values under 0.1 but important for the adjustment of the model.
Reason for last medical appointment (answered by the representative); Reason for last medical appointment (answered by the minor);
9. References
Becker, Gary (1965) The allocation of time, E conomic Journal.
Boyden, Jo, Birgitta Ling and William Myers (1998) What work s for work ing children. Radda Barnen.
Burgess, Simon, Karen Gardiner and Carol Propper (2001) Growing up: School, family and area influences on adolescents’ later life chances. CASE paper 49, September 2001.
DE TE FP (1998) Social characterisation of the Portuguese households with schoolage children, E nquiry, in collaboration with ILO.
DE TE FP (2001) Social characterisation of the Portuguese households with schoolage children, E nquiry, in collaboration with ILO.
Farinha Rodrigues, Carlos (2001) A nti-poverty effectiveness and efficiency of the guaranteed minimum income programme in Portugal, Working paper, ISE G-UTL, Lisbon.
Figueiredo, Luis, Pedro Goulart, Delfina Soares e Vera Vicente (1999) Trabalho Infantil em Portugal, Paper for Labour E conomics, ISE G, Mimeo.
ILO (2002) E very child counts. New global estimates on child labour, International Programme on the E limination of Child Labour, ILO, Geneva.
Leão Fernandes, Graça and Margarida Chagas Lopes (2002) Gender, L ife Cycle Trajectories and their Determinants in the Portuguese L abour Mark et, paper presented to the Seminar ‘Gender-from costs to benefits’, University of Kiel, 15-17 November, 2002.
PE E TI (2000), “Trabalho Infantil em Portugal – Caracterizacão social dos menores em idade escolar e suas famílias”, Grupo de Trabalho integrado no âmbito do PE E TI, Cadernos PE E TI, Volume 3, Ministério do Trabalho e da Solidariedade.
Smith, Stephen W. (1994) Labour E conomics, Routledge.
Srivastava, S. P. (1992), “Child Labour in India – Some Critical Issues”, The E astern Anthropologist, Vol. 45, No. 4, pp 405-417 E thnographic & Folk Culture Society.
Veerman, Philip (2002) Development assistance, social policy and children’s rights. Paper to be presented at the Institute of Social Studies, The Hague, 17 December, Mimeo.