Cancers
Tetsuya Shiraishi1*, Shinako Matsuyama2, Hiroaki Kitano1,3,4
1Sony Computer Science Laboratories, Shinagawa-ku, Tokyo, Japan,2Sony Corporation, Shinagawa-ku, Tokyo, Japan,3The Systems Biology Institute, Shinjuku-ku, Tokyo, Japan,4Okinawa Institute of Science and Technology, Kunigami, Okinawa, Japan
Abstract
Protein–protein interaction and gene regulatory networks are likely to be locked in a state corresponding to a disease by the behavior of one or more bistable circuits exhibiting switch-like behavior. Sets of genes could be over-expressed or repressed when anomalies due to disease appear, and the circuits responsible for this over- or under-expression might persist for as long as the disease state continues. This paper shows how a large-scale analysis of network bistability for various human cancers can identify genes that can potentially serve as drug targets or diagnosis biomarkers.
Citation:Shiraishi T, Matsuyama S, Kitano H (2010) Large-Scale Analysis of Network Bistability for Human Cancers. PLoS Comput Biol 6(7): e1000851. doi:10.1371/ journal.pcbi.1000851
Editor:Nathan D. Price, University of Illinois at Urbana-Champaign, United States of America
ReceivedMay 14, 2009;AcceptedJune 3, 2010;PublishedJuly 8, 2010
Copyright:ß2010 Shiraishi et al. This is an open-access article distributed under the terms of the Creative Commons Attribution License, which permits unrestricted use, distribution, and reproduction in any medium, provided the original author and source are credited.
Funding:The authors received no specific funding for this work.
Competing Interests:The authors have declared that no competing interests exist. * E-mail: [email protected]
Introduction
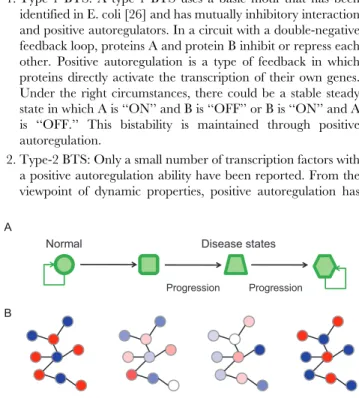
Understanding diseases within the context of biological networks is one of the major challenges in systems biology. Diseases often persist and resist therapeutic intervention. The persistence of a disease in a system must be reflected in the ability of the system’s networks to maintain the state underlying the disease. In other words, networks are ‘‘locked-in’’ to disease states and maintain their stability. Thus, it is important to understand how such multi-stable states are achieved within the context of network topology and to understand the dynamics of these states. A network robust against a range of perturbations can maintain a healthy state but can also, when affected by a disease, transition to a new steady state that is often also robust against perturbations, making the disease state persistent. A series of disease progressions may be the result of a sequence of state transitions in the network dynamics (Fig. 1A). Bistable circuits may drive such transitions and are thus critical in enabling the initiation and progression of diseases to be understood (Fig. 1 B).
Complex networks exhibiting such multi-stability must have a set of bi-stable or multi-stable circuits consisting of proteins and genes. The identification of circuits that exhibit bi- or multi-stability within large protein-interaction and gene-regulation networks would provide information useful for understanding the mechanism(s) of network bistability. Furthermore, circuits exhibiting bistability can be potential drug targets or biomarkers for classifying disease states.
Network dynamics are regulated by the structure of the network and the flow of information through feedforward and feedback loops. Mutual activation or mutual inhibition configurations can maintain the flow of biological information between two molecules and act as network memories or switches. Furthermore, an activation-inhibition configuration, in which one molecule stimu-lates the other while the latter inhibits the former, generates dynamics with periodicity like that seen in circadian rhythms and
cell cycles [1]. The stability and characteristics of Boolean networks comprising these configurations were studied in detail by Kauffman et al. [2]. In the study reported here, we focused on mutual inhibition, which is thought to be involved in the stable deviations of a system observed during the progression of tissue from a normal to a diseased state.
There are several important network motifs for system configurations [3–6] in protein-protein networks. One of them, a toggle switch that converts a continuous input signal into a discontinuous ON or OFF response, plays a fundamental role in information processing and decision making. Among the naturally occurring toggle switches that have been reported are the lambda phage lysis–lysogeny switch [7–9], switches in the lactose operon repressor system [10–12], the mitogen-activated protein kinase (MAPK) cascade [13–20], the Sonic hedgehog network in stem-cell differentiation [21], stem-cell-cycle regulatory circuits [22–24], and the rapid lateral propagation of receptor tyrosine kinase activation [25]. Genetically engineered toggle switches have been construct-ed experimentally in Escherichia coli [26,27] and in mammalian cells [28].
A robust toggle switch behaves as a signal memory unit by using a hysteresis mechanism [29]. Once in the ON state, a toggle switch remains in the ON state even if the stimulus concentration falls below the threshold level [11,13,23,24,30,31]. A molecular network’s persistence in a disease state might be due to the hysteresis of toggle switches.
Results
Extraction of bistable toggle switches
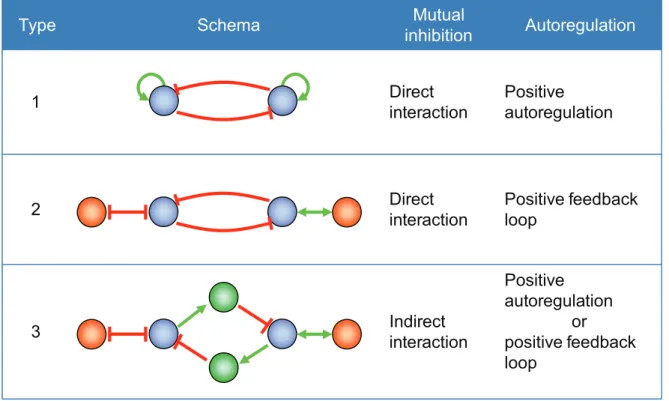
There are theoretically many system configurations that can lead to bistability [18,32–35]. We focused on bistable toggle switches (BTSs) with double-negative feedback. Such switches can be constructed from any two genes that mutually repress their expression. We considered three types of network motifs that can exhibit bistable behavior (Fig. 2).
1. Type-1 BTS: A type-1 BTS uses a basic motif that has been identified in E. coli [26] and has mutually inhibitory interaction and positive autoregulators. In a circuit with a double-negative feedback loop, proteins A and protein B inhibit or repress each other. Positive autoregulation is a type of feedback in which proteins directly activate the transcription of their own genes. Under the right circumstances, there could be a stable steady state in which A is ‘‘ON’’ and B is ‘‘OFF’’ or B is ‘‘ON’’ and A is ‘‘OFF.’’ This bistability is maintained through positive autoregulation.
2. Type-2 BTS: Only a small number of transcription factors with a positive autoregulation ability have been reported. From the viewpoint of dynamic properties, positive autoregulation has
the same functional meaning that a positive feedback loop (double-positive feedback or double-negative feedback) does [36]. We thus defined two mutually inhibitory nodes with a positive feedback loop between them as a type-2 BTS. 3. Type-3 BTS: A theoretical study of modeling genetic switches
with positive feedback loops [37] revealed that mutual inhibition is maintained even if a molecule that signals information intervenes between the molecules constituting a switch. We defined two nodes that inhibit each other through other genes (mediators) as a type-3 BTS. Although it is theoretically possible that a positive feedback loop can be formed even if the intervening molecules are identical, in the present study we excluded this possibility.
It is possible that double-negative feedback can be a bistable toggle switch when both nodes have positive feedback loops. Two BTSs can share their mutual inhibition configurations as positive feedback loops and can form network configurations.
Next, bistable toggle switches defined above was extracted from large-scale databases (ResNet 3.0, Ariadne Genomics Inc.) containing data for interaction networks. We detected 6585 pairs of bistable toggle switches, and these switch nodes formed a large network. Four-hundred and forty-two genes are involved in these BTS pairs, and the hubs of switch nodes in the network are clearly visible because of their high degree of connectivity (Fig. 3). A complete list of the BTS pairs is provided in Protocol S1, and a Cytoscape session file is provided in Protocol S2. It should be noted that this network was constructed using text mining and that the molecular details of each interaction were not verified. It is nevertheless a reasonable starting point, and whether or not a listed BTS actually exhibits bistability can be further examined using microarray data.
Tests using mRNA microarray data
ArrayExpress microarray data were used to further examine the states of the BTS pairs. It is obvious that a BTS has four possible states: ‘‘ON/ON,’’ ‘‘ON/OFF,’’ ‘‘OFF/ON,’’ and ‘‘OFF/OFF.’’ Mathematical analysis of bistability for the chosen parameter condition demonstrated that the probability of ‘‘ON/OFF’’ and ‘‘OFF/ON’’ states is high, that of ‘‘ON/ON’’ is low, and that of ‘‘OFF/OFF’’ is extremely low [38]. This is the reason we focused on the BTSs that demonstrated ‘‘ON/OFF’’ or ‘‘OFF/ON’’ states.
The ArrayExpress experimental categories and the mean number of corresponding BTS pairs with a significant ON/OFF change are shown in Fig. 4. In the set of 6585 candidate BTSs the number of pairs with a significant ON/OFF change ranged from 0 to 1927 (mean = 298.6), while in a set of 6585 randomly selected gene pairs the number of pairs with a significant ON/OFF change ranged from 0 to 273 (mean = 72.1).
The switching of a molecule’s function to the ON state generally means the molecule’s intrinsic function related to intracellular molecular systems has become stronger, whereas switching to the OFF state means it has become weaker. The ON state of a molecule is produced not only by an increase in the absolute amount of that molecule but also by actions such as activation due to phosphorylation-induced transformation of the molecule’s three-dimensional structure or to translocation of the molecule to an location where it can carry out its function properly.
In these studies using mRNA expression data from microarrays, the toggling of a BTS pair was defined as an instance in which a sample’s mRNA level for one of that pair’s molecules increased (relative to a control) and the mRNA level for the other of that pair’s molecule decreased (relative to the same control).
Normal Disease states
Progression Progression
A
B
Figure 1. State transitions in network dynamics and disease
progression.A: A network in a healthy state is robust against a range
of perturbations, so it can continue to maintain a healthy state. With the onset of a disease, however, the network transitions to a new steady state that is also often robust against perturbations, making the disease state persistent. B: These state transitions might be driven by bistable switch networks. The nodes represent genes and the edges between them represent the pairing of bistable toggle switches. Red and blue nodes correspond to ON (upregulated) and OFF (downregulated) states.
doi:10.1371/journal.pcbi.1000851.g001
Author Summary
A notable finding is that when mRNA levels were compared between induced pluripotent stem (iPS) cells and donor controls, more than 1000 BTS pairs demonstrated significant changes in the ON/OFF states. The high frequency of these changes in iPS cells is reasonable in that an iPS cell is in an undifferentiated state committed to differentiation to a particular lineage, in which many BTSs might be involved [39]. iPS cells have been generated from mouse and human somatic cells by using retroviruses or lentiviruses to introduce Oct3/4 and Sox2 with either Klf4 and c-Myc or Nanog and Lin28 [40]. These factors have been reported to result in bistability when they combine with other factors and form mutual-activation and mutual-inhibition motifs [41–43]. Lung cancer
Lung cancer is the leading cause of cancer-related deaths [44], and tobacco smoking is the strongest etiological factor associated with lung cancer. Prior studies have demonstrated that smoking creates a field of molecular injury throughout the airway epithelium exposed to cigarette smoke [45].
Figure 5A depicts the toggling of BTS ON/OFF states inferred from time-dependent data (ArrayExpress ID: GEOD-10700 and E-GEOD-10718) for the mRNA expression in normal human bronchial epithelial cells exposed to cigarette smoke for 24 hours. Toggling began at 2 hours (Fig. 5B) and was observed most frequently at 4 hours (Fig. 5C). SOCS3 (suppressor of cytokine signaling 3) was observed early, while BTSs related to HMOX1 (heme oxygenase 1), CSF2 (colony stimulating factor 2), and SPP1 (secreted phosphopro-tein 1) were observed throughout the 24-h period.
SOCS3 inhibits cytokine signaling via the JAK(Janus kinase)/ STAT(signal transducers and activators of transcription) pathway.
Recent research has demonstrated that the activation of SOCS3 in the lung occurs during the acute inflammatory response [46]. Frequent hypermethylation in the CpG islands of the functional SOCS3 promoter has been found in lung-cancer tissue samples to correlate with its transcription silencing [47]. The OFF states of EGF (epidermal growth factor) and MAPK8 (mitogen-activated protein kinase 8) were linked to the ON states of CSF2 and HMOX1, which became the main players at four or more hours of exposure. CSF2 and HMOX1 were connected through several genes in the OFF state, including IL13 (interleukin 13), IFNG (interferon gamma), and FN1 (fibronectin 1), which are related to inflammatory responses and wound healing.
Figure 6 illustrates the state of BTS toggling for a comparison of mRNA expression (ArrayExpress ID: E-GEOD-10072) in non-small cell lung carcinoma (NSCLC) patients with a history of smoking (Fig. 6A) along with those currently smoking (Fig. 6B) with mRNA expression seen in normal lung tissue. The bold black frames surround molecules that are also in the BTS molecules whose toggling is shown in Fig. 5A.
ON/OFF patterns of FN1-SPP1 (Fig. 6A) and IGF1-SPP1 (Fig. 6B) were observed in the data gathered in experiments exposing normal human bronchial epithelial cells to cigarette smoke. SPP1 is a secreted integrin-binding glycoprotein that is overexpressed in various tumors and has been reported to be involved in tumorigenesis and metastasis. High expression of SPP1 is a significantly unfavorable prognostic factor for the survival of patients with NSCLC [48].
In addition, although some EDN1(endothelin-1)-related BTS pairs and SHC1(Src homology 2 domain containing transforming protein)-related BTS pairs are shared in lung cancer tissue in current and former smokers, a considerable number of differing
Type
Schema
Mutual
inhibition
Autoregulation
1
Direct
interaction
Positive
autoregulation
2
Direct
interaction
Positive feedback
loop
3
Indirect
interaction
Positive
autoregulation
or
positive feedback
loop
Figure 2. Motifs of bistable toggle switches.A type-1 bistable toggle switch (BTS) contains two genes with positive autoregulation. Each gene
mutually inhibits the other’s expression. The two genes in the type-2 BTS also suppress each other’s expression. Each gene has double positive or negative feedback with the other gene, so the same function as a type-1 BTS may be exhibited. A type-3 BTS was constructed on the basis of a theoretical study on the modeling of genetic switches with positive feedback loops. The blue, green, and orange nodes respectively correspond to switch genes, mediators, and genes constituting a feedback loop. Positive (upregulated) interactions are indicated by green lines and negative (downregulated) interactions are indicated by red lines.
patterns are evident. This suggests that the mechanisms for carcinogenesis differ depending on the lengths of time that current and former smokers have smoked. EDN1, which is a hypoxia-inducible angiogenic growth factor for surrounding epithelial and endothelial cells, plays an important role in cancer-stromal interactions and tumor progression, and its expression is related to poor prognosis in NSCLC [49].
Small molecules that can put these BTS pairs into normal ON/ OFF states might be useful in preventing the progression of lung cancer in both current and former smokers.
Hepatocellular carcinoma
Hepatocellular carcinoma (HCC) is a primary cancer that originates in hepatocytes and typically follows cirrhosis or
chronic-hepatitis virus infections [50], and the most significant risk factors for HCC are chronic infections with either hepatitis B virus or hepatitis C virus (HCV).
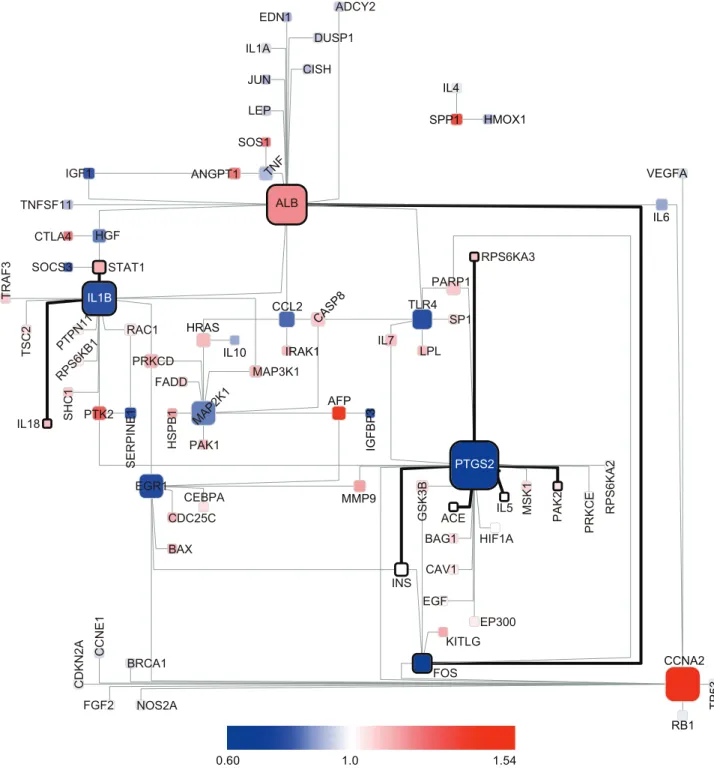
Figure 7 is a BTS toggling graph in which mRNA expression data (ArrayExpress ID: E-GEOD-6764, [51]) for tissues from patients with HCV-induced dysplasia and HCC are compared with mRNA expression data for normal liver tissue. The molecules surrounded by bold lines are BTSs for which toggling was observed when comparing dysplastic liver tissue (cirrhotic tissue and dysplastic nodules), a precursor of liver cancer, with normal liver tissue. The two tissue types share many BTSs associated with PTGS2 (prostaglandin-endoperoxide synthase 2; COX-2) and IL1B (interleukin 1, beta). It has been demonstrated that the expression pattern of PTGS2, a key enzyme of the CDK4 CSF2 CDC42 CDK2 CXCR4 EPAS1 CSF3 CXCR3 HSPA4 HSPB1 FADD FASLG IGFBP1 IGFBP4 IDE IFNA1 CASP7 CASP1 CALCA BRCA1 CCL11 CAT CASP10 CASP9 CD28 CD8A CD4 CCR5 CDC2 CD86 CD80 CD40LG SFTPA1 SST STAT3 THBD TNFSF11 TSC2 VIP GAB1 HMOX1 NTRK1 ANGPT2 BDNF BIRC2 BIRC3 BIRC4 BIRC5 LIF JAK1 MET MAP2K4 OXT NFKBIA PLD2 PLAUR PRL PPARG PTK2B PTEN RAC1 PTPN5 SAG RHOA FGF1 FOS ERBB2 ESR1 DUSP1 EP300 CRH CXCL12 IL1R1 IL2RB IGF2 IL10 GNAQ GNRH1 GATA4 GHRL HIF1A CD40 CCND1 BAX BDK AFP TERF2IP RPS6KB1 CISH CDC25C CAV1 BCL2L1 BCAR1 AVP AGTR2 IGFBP3 SREBF1 BCL2 BRAF CNTF IL1B IL8 MAPK3 RAF1 MAP2K2 NGFB PTK2 RPS6KA2 EGFR HGF HTATIP MAP2K1 AGTR1 ADCYAP1 IGF1 CCL5 NOS2A MMP9 TGFB1 PARP1 FN1 EBP IL1A GH1 APP NPY CYP2E1 CEBPA HRAS FGF2 FAS CREB1 LPL IL4 IL1F8 ICAM1 ADIPOQ ADCY2 VEGFA SHC1 CCL2 CASP8 ALB ADRBK1 GRB2 KNG1 EDN1 EGR1 PTGS2 REN POMC PTGIS TNF TP53 SRC STAT1 AKT1 ANGPT1 ACE AGT MAPK8 MAPK14 NPPA MYC PPARA OSM PRKCD PRKCA IL6 IL3 JUN INS MAP3K1 LEP MAPK1 MAP3K5 CDKN1A CSF1 EGF GSK3B IFNG IGF1R IL13 IL2 ABL1 CASP3 RUNX2 TNFRSF1B SMAD4 PTGDS SNAP23 LEF1 IRF8 IRF4 MYOG PTPN1 SKP2 RARA MMP12 KRAS MAP3K11 LEPR TIMP1 MAPK11 MDM4 MMP2 NGFR P2RX7 PAX5 WASL RET PTCH1 RPS6KA1 PXN RAD51 SERPINB2 SFTPD SRF MAP3K2 TYK2 TNPO1 PLAT FLT1 FGF7 FGF4 MSK1 FST SLPI MMP3 GDNF PIK3CA SPI1 GATA1 GATA2 TRAF6 HSPA8 RAPGEF1 RPS6KA3 TGFB3 SHOC2 TIMP2 NR1H3 TCF1 TRAF3 IKBKB PTH LY96 SAA2 IL17A IRF3 CXCL2 CSK RELA NPPB FOSL1 CRP JUNB IL6ST KSR1 IQGAP1 MSMB LCP1 EDNRA DUSP6 GHRH FGFR1 ELA2 ELN PTHLH RELB NRG1 TGFBR2 EIF4E EIF4EBP1 F10 FRAP1 PRKCE INHBA JAK2 ILK INDO IL18 IL5 THPO THBS1 TGFA TAC1 SYK STAT5A SPP1 SP1 SOS1 SOCS3 SMAD7 SMAD2 RIPK2 PTPN11 PSEN1 APOA1 ATF2 SLC2A4 TLR2 SMAD3 APAF1 TLR4 PGF KLK3 RB1 PLAU PLCG1 PML PDPK1 PLA2G1B NTRK2 PAK1 NR3C1 NTF3 MDM2 MIF IL15 IRS1 IRS2 KITLG CEBPB CTGF CTLA4 ETS1 TRAF2 VCAM1 AKT2 B2M TNFRSF1A TNFRSF11B TNFSF10 TP73 ATM ATF3 BAK1 BAG1 APOE HCK MM9 TERT EPOR HBEGF F7 TNIP1 S100B FYN MYOD1 GHR CDKN1B CDK6 CDH1 CD44 VAV1 STAT6 ICOS IL7
HAND2IFNB1CD14CDK7ELK1SLC12A9RBL1WEE1PCNALYNCHEK2SCT CRKCHUKGALCEBPGCHEK1IER2RBL2BMP4
SHH BMP7 CCNA2 CIITA EPO NOS3 PLA2G10 SERPINE1 SGK STAT4 TNFRSF10B BCL6 PRDM1 BMP2 SMAD5 IRAK1 IGFBP5 SELE KDR CCL4 TBX21 PSMD9 CCNE1 CASP6 TGFB2 CCK CBL CD46 CD22 HNF4A GATA3 CDK9 CDKN2A CASP2 CASP4 DAXX E2F1 CTNNB1 CUL1 TNC BCKDHA CYCS MAD1L1 BCL2L11 BID WT1 GA17 NFKB1 MYB MMP14 MAP2K7 SELL REL PAK2 NR2C2 JAK3 IRF1 HAND1 GADD45A MAP2K6 MAP2K3 LCK KIT
Figure 3. Cytoscape visualization of network composed of bistable toggle switch pairs.Four-hundred and forty-two genes are involved in
6585 bistable toggle switch pairs. Nodes are shown in sizes proportional to their connectivity, making the hubs of switch nodes clearly visible. The Cytoscape session file for this network is available in Protocol S2.
prostaglandin metabolism, is closely correlated with the differen-tiation grade of HCC [52]. Nonsteroidal anti-inflammatory drugs targeting PTGS2 have been shown to inhibit the proliferation of cultured hepatocellular cancer cells by inducing cell-cycle arrest [53].
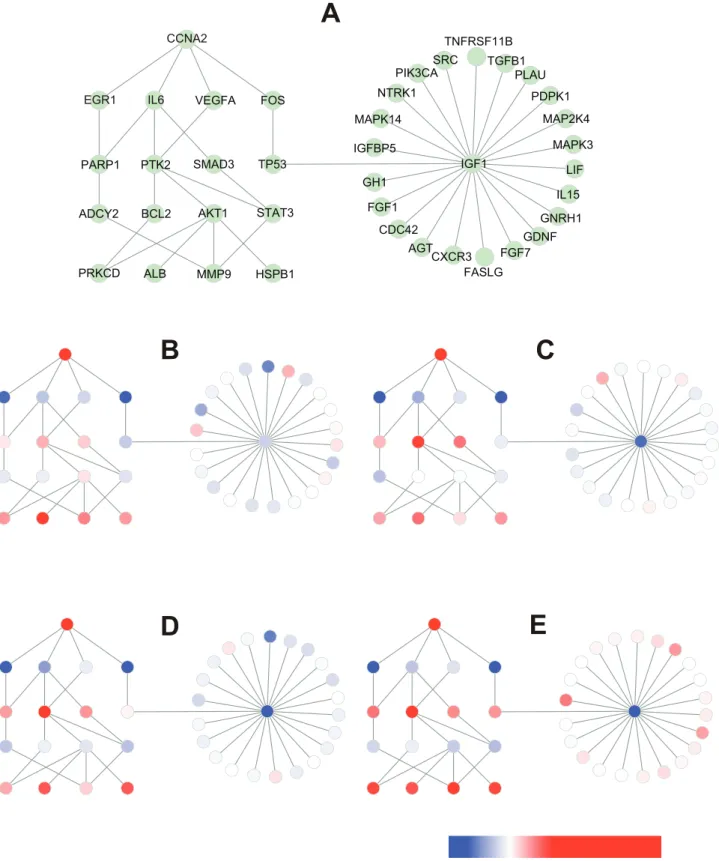
When HCC tissue was compared with healthy liver tissue, toggling was most evident for CCNA2(cyclin A2)–related BTSs (Fig. 7) We therefore analyzed how the toggling of CCNA2-related BTSs rippled out to other BTS pairs during the malignant transition of HCC (Fig. 8).
CCNA2 activates CDC2 or CDK2 kinases and regulates the cell cycle positively by promoting G1/S and G2/M transitions in both the G1 and G2 phases of the cell cycle [54], while EGR1 (early growth response gene 1) has suppresses transformation [55]. The upregulation of CCNA2 and downregulation of EGR1 might thus play a key role in the dysregulation of normal growth in HCC carcinogenesis [56]. The downregulation of IL6 (interleukin 6) is involved in dysregulation of the immune response in early carcinogenesis.
After the toggling of CCNA2-related BTSs but still in the early stage of carcinogenesis, the OFF state of IL6 is related to the ON states of PTK2 and SMAD3 (SMAD family member 3). PTK2 and SMAD3 play important roles in cell growth and the activation of intracellular signal transduction pathways, suggesting that cell proliferation might accelerate during this stage.
Toggling of PTK2(ON)-BCL2(OFF) was observed in advanced and very advanced stages. BCL2 (B-cell CLL/lymphoma 2) suppresses apoptosis, and the downregulation of BCL2 might be involved in the acceleration of apoptosis in cancer cells.
Notably, the ON/OFF state of the TP53-IGF1 BTS was changed from ‘‘OFF-OFF’’ to ‘‘ON(TP53)–OFF(IGF1)’’ in advanced HCC. And in very advanced HCC, almost all IGF1-related BTS pairs demonstrated ‘‘ON(other)–OFF(IGF1)’’ patterns.
In the very advanced stage, many IGF1(insulin-like growth factor-1)-related BTS pairs demonstrated significant ON/OFF changes. The liver is the main source of IGF1, and the development of HCC is accompanied by significantly reduced serum IGF1 levels [57]. The downregulation of IGF1 and upregulation of a set of another pair of genes might affect a wide variety of cellular functions.
Discussion
We constructed bistable switch networks, compared their ON/ OFF states with those of control (healthy) samples, and found that their states changed with disease progression and differed between patient subtypes. Since most disease states exhibit a certain level of resilience against therapeutic intervention, each can be considered to be homeostatic to some extent. This homeostasis implies the robust status of a dynamical network and could not be maintained without mechanisms that drive a network to maintain a certain state. One such mechanism is a bistable switch, so we should look for sets of bistable switch circuits in large-scale protein interaction networks.
Our analysis revealed that BTS states change with disease progression, and the implications of this are far reaching. For example, it might be possible to prevent or delay disease Figure 4. ArrayExpress experimental categories for microarray datasets and mean number of BTS pairs with significant ON/OFF
change.There were few BTS pairs with significant changes for ‘‘lifestyle’’ and many with significant changes for ‘‘cancer.’’ Note the higher number of
A
B
C
D
E
0.79 1.0 1.67
CD8A
ATF3
MYC
IGFBP3
LEP
RAC1
CCL4
RHOA
SFTPA1
AGTR2
PTK2
STAT5A FASLG CCL2
HSPB1
CISH
HMOX1 IL13
LIF
IRS1 GATA3 CD40LG
GH1 MAPK8
EGF
TNFRSF1A
TLR2 SOCS3 CTLA4 PTPN11
MAP2K1
PPARG
IFNG
CSF2 MAP3K5
TGFBR2
THBD CSF1
TNF
CYCS
PPARA
FOS
CCNA2 CCND1
BRCA1
SMAD7
RAF1
CDC2
E2F1
FN1
IL1B NPPA
TSC2
IGFBP1 CDKN1A JUN
THBS1
STAT1 IGF1
PRL
AKT1 BCL2 SPP1 IL1R1
INS
GAL SST
PRKCD
HRAS
CEBPA
EGR1 PTGS2
EP300 TGFB1
MMP9 MMP3
progression by perturbing one or more such switches. Such switches may be novel drug-target candidates for controlling disease progression. Analysis of the ON/OFF states of genes constituting bistable circuits revealed similarities between disease subtypes.
While our analysis has provided insightful information, it has shortcomings. First, the network topologies were based on commercial databases created using a text-mining system. This means that the details of the molecular interactions were not verified. The development of a more accurate interaction database would enable more precise and accurate analysis of bistable network behaviors and of the contributions of switch circuits to those behaviors. Second, the analysis was based solely on network topologies—no parametric features were considered. Although topological analysis enabled us to identify circuits exhibiting bistable behavior, whether circuits exhibiting bistable behavior apparently exhibit bistable behavior depends on the kinetic parameters associated with each interaction [58].
Using microarray data, we determined that the pairs of genes in the circuits we identified are polarized into ON and OFF states. Two mutually inhibitory nodes polarized into ON and OFF states do not function as a bistable switch if both genes are ON or OFF. This is why we focused on BTSs, which demonstrated ‘‘ON/ OFF’’ or ‘‘OFF/ON’’ states. We should, however, note that the ‘‘ON/ON’’ states of some BTSs play important roles in mammalian embryogenesis [59], T-cell differentiation [60], and visual-system specification [61].
Cluster analysis of transcriptome data in microarrays is useful for classifying disease characteristics according to differences in expression patterns. Although several disease types that are difficult to classify morphologically have been classified using this approach, the rules underlying the cluster structure of the data are unclear, and the importance of each of the molecules in a cluster cannot be determined with a reasonable degree of certainty. The analysis of changes in gene-expression levels can also be used to create a list of molecules whose levels increase or decrease significantly over time or whose levels differ significantly between healthy and diseased tissues. Although examinations of gene interrelations using gene-ontology classification and analysis of the classification results using network diagrams have led to a greater degree of understanding of the changes in molecular networks, it is difficult to infer the meanings of biological interactions between molecules.
Our proposed method (i.e., focusing on BTS ON/OFF changes) takes as the starting point the interactions between molecules. This makes it easy to infer biological meaning and makes it possible to analyze time-dependent data for time periods corresponding to that of disease progression (from hours to years). In addition, while conventional methods sometimes neglect molecules that are downregulated, our method places equal importance on both increases and decreases in expression.
DNA microarray technology makes it possible to study the expression of thousands of genes at the same time, but much of the microarray data consists of low signal intensities that can produce erroneous gene expression ratios between control and experimen-tal samples [62]. The distribution of the ratio of two random
variables approaches a Cauchy, or Lorentzian, distribution, which has longer tails than Gaussian distributions [63,64]. In our results, far more BTS pairs had significant toggling scores than did random gene pairs, but a considerable number of random gene pairs did show significant ON/OFF changes. We should therefore consider the possibility of random error in the analysis of BTS pairs.
We used the transcriptome of normal tissue as the control in our analyses. This means that the identification of the molecular ON/ OFF states inherent to normal tissue was unclear. Even if the ON/ OFF state of a molecular pair for a certain switch is important for a particular tissue, if this state is retained in the diseased tissue, we would be unable to detect it in the present study because the ON and OFF states are not mutually exclusive. Therefore, molecules exhibiting even the slightest change are emphasized while those showing no change are ignored. We aim to overcome this drawback by identifying what types of ON/OFF changes occur in switches when embryonic stem (ES) cells or iPS cells undergo differentiation.
Since proteins are responsible for cell function, the ON/OFF state of a molecule must be determined at the protein level when searching for molecular-network structures mediating cell func-tions. Because there are more than 20 control steps along the way from mRNA to functional proteins [65], the reported expression levels of mRNA do not always agree with those of proteins—their translated products [66]. And even if there were a quantitative correlation between the levels of mRNA and functional protein, the efficiency of the translation process would be greatly affected by factors such as structural change and protein localization. Proteomics data for proteins in different cellular contexts is useful but is available for only some proteins. Transcriptome data analysis is the only method currently available for examining molecular networks on a large scale, but when testing the quality of BTS pairs in the future we will use all the relevant available data for the target proteins. Furthermore, to ensure bistability, the hysteresis phenomena must be confirmed when a perturbation has vanished. By conducting time-scale experiments in both directions when applying and removing perturbations, we should be able to further test the quality of BTS pairs.
Despite its shortcomings, the approach presented here provides useful insights into the states of biological networks, insights that may lead to discovery of novel drug targets and therapeutic interventions.
Materials and Methods
Preparation of basic interaction datasets
The lists of molecular interactions were constructed using the Ariadne Genomics ResNet human protein interaction database (ver. 3.0) compiled, using MedScan [67] natural language processing technology, from more than 13,000,000 PubMed abstracts and 43 publicly available full-text journals. The database contains data on over 200,000 objects (proteins and small molecules) and over 100,000 interactions.
The interactions can be divided into two major classes: direct physical interactions (binding, protein modifications, and promot-er binding) and indirect regulatory intpromot-eractions (regulation,
Figure 5. Changes in ON/OFF states of BTSs for time series data for human normal bronchial epithelial cells exposed to smoke.A:
A
PTK2 SHC1ADCY2 CASP8
GH1
EDN1
RAF1 PAK1MAPK8
MAPK14MAPK1MAP2K1 IL13
FGF1
EGF
AVP
TP53
ICAM1
CSF2
SOCS3
CD44 BCL2
RHOA
FOS
IL18
S100B
CD40LG SPP1
RPS6KA2
CSF3
TLR2 HGF
SERPINE1 EGR1
GSK3B FN1
IL6
TNFSF10 BRCA1
TGFB1
GA17
LPL
CTGF
ALB
EP300 SMAD7
PTGS2
PLA2G10
HIF1A
ATF2
TLR4
NOS2A
IGF1
GDNF IFNG
PRL
NFKBIA
B
1.0
0.82
1.38
MYC MET
PTPN6
THBD
THBS1
FOSL1
IL3
ALB
EGR1
GRB2 IL6
NRG1
PTEN
PTK2
CXCL12 SHC1
CASP3 MAPK3
IFNG
JAK3
GDNF FN1
CASP8 IGF1
PPARA
FGF1
FGF2
NR3C1
TGFB1 SPP1
ADRBK1
RPS6KA2CHEK2 TP73
BAG1
CAV1 CDC42
CDH1
Figure 6. Changes in ON/OFF states of BTSs for lung cancer.The state of BTS toggling determined by comparing mRNA expression data (ArrayExpress ID: E-GEOD-10072) for normal lung tissue with that for lung-cancer patients with a history of smoking (former smokers) (Fig. 6A) and that for lung-cancer patients still smoking (current smokers) (Fig. 6B). The nodes and genes surrounded by bold black frames are those also shown in Fig. 5A. The nodes and edges surrounded by bold green frames are found in the former smokers as well as the current smokers. The nodes represent genes and the edges between them represent the pairing of bistable toggle switches. The colors of nodes were automatically assigned as a continuous color gradient from red for ON (upregulated) to blue for OFF (downregulated) according to relative gene-expression levels of the nodes. doi:10.1371/journal.pcbi.1000851.g006
0.60 1.0 1.54
ADCY2 EDN1
DUSP1 IL1A
CISH JUN
LEP
SOS1
ANGPT1 TNF
ALB IGF1
TNFSF11 HGF
SOCS3 CTLA4
STAT1
IL1B
TRAF3
TSC2 PTPN11
RPS6KB1
SHC1
IL18
RAC1
PRKCD
PTK2
SERPINE1
FADD
HSPB1 PAK1 MAP2K1
MAP3K1
EGR1
CEBPA
BAX CDC25C
NOS2A FGF2
CCNE1
BRCA1
CDKN2A
FOS
EP300 KITLG EGF
CAV1 INS
BAG1 HIF1A
ACE
GSK3B
PTGS2
IL5 MSK1
PAK2
PRKCE
RPS6KA2
IL7 LPL
SP1 PARP1 TLR4
RPS6KA3
IL6 VEGFA IL4
SPP1 HMOX1
IGFBP3
AFP
MMP9
CASP8
IRAK1 CCL2
IL10 HRAS
CCNA2
TP53
RB1
Figure 7. Changes in ON/OFF states of BTSs in dysplastic liver tissue and hepatocellular carcinoma.BTS toggling graph comparing the
mRNA expression data (ArrayExpress ID: E-GEOD-6764) of normal liver tissue with that of precancerous and cancerous liver tissue. The nodes and edges surrounded by the bold lines are BTSs for which toggling was observed when comparing dysplastic liver tissue, a precursor of liver cancer, with normal liver tissue. The nodes represent genes and the edges between them represent the pairing of bistable toggle switches. The colors of nodes were automatically assigned as a continuous color gradient from red for ON (upregulated) to blue for OFF (downregulated) according to relative gene-expression levels of the nodes.
A
B
C
D
E
0.68 1.0 1.78
CCNA2
EGR1 IL6 VEGFA FOS
PARP1 PTK2 SMAD3 TP53
ADCY2 BCL2 AKT1 STAT3
PRKCD ALB MMP9 HSPB1
TNFRSF11B
TGFB1 PLAU
PDPK1
MAP2K4
MAPK3
LIF
IL15 IGF1
SRC PIK3CA
NTRK1
MAPK14
IGFBP5
GH1
FGF1
CDC42
AGT CXCR3
FASLG FGF7
GDNF GNRH1
Figure 8. Rippling of toggling of CCNA2-related BTS during malignant transition of HCC.Fig. 8A: A network of CCNA2-related BTS pairs
selected from the data used in Fig. 7A. Fig. 8B–E: The nodes represent genes and the edges between them represent the pairing of bistable toggle switches. The colors of nodes were automatically assigned as a continuous color gradient from red for ON (upregulated) to blue for OFF (downregulated) according to relative gene-expression levels of the nodes. B: very early HCC, C: early HCC, D: advanced HCC, E: very advanced HCC. Note that the ON/OFF status of TP53-IGF1 was changed in advanced HCC.
expression regulation, direct regulation, molecular transport regulation, and molecular synthesis regulation). MedScan also extracted information on the relation direction and the effect on the target molecule. The ‘‘Effect’’ attribute has three possible values: ‘‘positive,’’ ‘‘negative,’’ and ‘‘unknown.’’ The BTS pairs were extracted from the database on the basis of five rules. (1) Nodes are limited to genes and proteins only.
(2) Edges are limited to ‘‘Regulation,’’ ‘‘Expression,’’ and ‘‘DirectRegulation.’’
(3) ‘‘Unknown’’ edges in the ‘‘Effect’’ attribute are omitted. (4) Edges extracted from fewer than three references are omitted. (5) If there is a positive and negative attribute in the same
direction, the edge is extracted from additional references. We extracted 19,178 relationships involving 3,682 genes (basic interaction datasets).
Extraction of candidate bistable toggle switches
Using basic interaction datasets, we extracted possible network motifs for toggle switches. We defined these motifs as follows.
The type-1 BTS contains two genes that have positive autoregulation and inhibit each other’s expression. The type-2 BTS also contains two genes that suppress each other’s expression, but each gene also has a positive or negative loop with the other gene. One of the four subtypes of type-2 BTSs (corresponding to the four possible combinations of double positive and/or negative feedback) shows the same function as the type-1 BTS. The type-3 BTS was based on a theoretical study of the modeling of genetic switches with positive feedback loops [37]. The BTS motifs are illustrated in Fig. 2, and we extracted 6585 BTSs (see supporting Table 1).
Analysis of toggling
We used mRNA microarray data to examine the changes in the ON/OFF states of BTS candidates. CEL format files or tab-limited text files were downloaded via ArrayExpress (http://www. ebi.ac.uk/arrayexpress/), which is a public repository provided by the European Bioinformatics Institute [68]. We only used microarray data obtained from experiments with humans and with platforms of Affymetrix U133A&B (631 sets) and HG-U133Plus2.0 (404 sets). These data were normalized and summarized using the robust multichip analysis method [69] implemented in the Affymetrix Expression Console software.
The toggling of a BTS pair was defined as instances in which the mRNA levels of a sample increased for one molecule of the pair and decreased for the other. To remove background noise, we calculated the toggling score using
toggling score~ðSW1 sample value=SW1 control valueÞ =ðSW2 sample value=SW2 control valueÞ,
where SW1 and SW2 are the two molecules in alphabetical order. Changes in the ON/OFF states were considered significant when the toggling score was more than two standard deviations greater than the mean of all the toggling scores.
Network visualization
For pathway visualization, we used Cytoscape (Version 2.6.3), which is widely used open-source software for visualization and analysis of networks [70]. The nodes in the visualized BTS network represent genes, the edges between nodes represent the pairing of bistable toggle switches, and the color of nodes were automatically assigned as a continuous color gradient from red for ON (upregulated) to blue for OFF (downregulated) according to relative gene-expression levels of the nodes.
Supporting Information
Protocol S1 List of BTS pairs SW1 and SW2 are the two
molecules comprising a BTS pair in alphabetical order.
Found at: doi:10.1371/journal.pcbi.1000851.s001 (0.16 MB XLS)
Protocol S2 Cytoscape session file for Figure 3.
Found at: doi:10.1371/journal.pcbi.1000851.s002 (0.09 MB ZIP) Acknowledgments
We are grateful to Dr. Y. Hamada (Sony Corporation) for preparing the basic interaction datasets, Mr. J. Suzuki (Tokyo Institute of Technology) for assisting us with the data extraction, and Dr. S. Ueda (Otsu Municipal Hospital) for providing us with the microarray data. We also thank Dr. K. Tabuchi for his useful comments and discussion.
Author Contributions
Conceived and designed the experiments: TS SM HK. Performed the experiments: TS. Analyzed the data: TS SM. Contributed reagents/ materials/analysis tools: TS SM. Wrote the paper: TS HK.
References
1. Sontag ED (2007) Monotone and near-monotone biochemical networks. Syst Synth Biol 1: 59–87.
2. Kauffman S, Peterson C, Samuelsson B, Troein C (2004) Genetic networks with canalyzing Boolean rules are always stable. Proc Natl Acad Sci USA 101: 17102–17107.
3. Milo R, Shen-Orr S, Itzkovitz S, Kashtan N, Chklovskii D, et al. (2002) Network motifs: simple building blocks of complex networks. Science 298: 824– 827.
4. Shen-Orr SS, Milo R, Mangan S, Alon U (2002) Network motifs in the transcriptional regulation network of Escherichia coli. Nat Genet 31: 64–68. 5. Tyson JJ, Chen KC, Novak B (2003) Sniffers, buzzers, toggles and blinkers:
dynamics of regulatory and signaling pathways in the cell. Curr Opin Cell Biol 15: 221–231.
6. Wolf DM, Arkin AP (2003) Motifs, modules and games in bacteria. Curr Opin Microbiol 6: 125–134.
7. Isaacs FJ, Hasty J, Cantor CR, Collins JJ (2003) Prediction and measurement of an autoregulatory genetic module. Proc Natl Acad Sci USA 100: 7714–7719. 8. McAdams HH, Arkin A (1997) Stochastic mechanisms in gene expression. Proc
Natl Acad Sci USA 94: 814–819.
9. Ptashne M (1992) A genetic switch; phage lambda and higher organisms. Blackwell Science.
10. Novick A, Weiner M (1957) Enzyme Induction as an all-or-none phenomenon. Proc Natl Acad Sci USA 43: 553–566.
11. Ozbudak EM, Thattai M, Lim HN, Shraiman BI, Van Oudenaarden A (2004) Multistability in the lactose utilization network of Escherichia coli. Nature 427: 737–740.
12. Vilar JM, Guet CC, Leibler S (2003) Modeling network dynamics: the lac operon, a case study. J Cell Biol 161: 471–476.
13. Bagowski CP, Ferrell JE, Jr. (2001) Bistability in the JNK cascade. Curr Biol 11: 1176–1182.
14. Bhalla US, Ram PT, Iyengar R (2002) MAP kinase phosphatase as a locus of flexibility in a mitogen-activated protein kinase signaling network. Science 297: 1018–1023.
15. Ferrell JE, Jr. (1996) Tripping the switch fantastic: how a protein kinase cascade can convert graded inputs into switch-like outputs. Trends Biochem Sci 21: 460–466. 16. Ferrell JE, Jr. (1997) How responses get more switch-like as you move down a
protein kinase cascade. Trends Biochem Sci 22: 288–289.
17. Ferrell JE, Jr., Machleder EM (1998) The biochemical basis of an all-or-none cell fate switch in Xenopus oocytes. Science 280: 895–898.
19. Huang CY, Ferrell JE, Jr. (1996) Ultrasensitivity in the mitogen-activated protein kinase cascade. Proc Natl Acad Sci USA 93: 10078–10083.
20. Markevich NI, Hoek JB, Kholodenko BN (2004) Signaling switches and bistability arising from multisite phosphorylation in protein kinase cascades. J Cell Biol 164: 353–359.
21. Lai K, Robertson MJ, Schaffer DV (2004) The sonic hedgehog signaling system as a bistable genetic switch. Biophys J 86: 2748–2757.
22. Cross FR, Archambault V, Miller M, Klovstad M (2002) Testing a mathematical model of the yeast cell cycle. Mol Biol Cell 13: 52–70.
23. Pomerening JR, Sontag ED, Ferrell JE, Jr. (2003) Building a cell cycle oscillator: hysteresis and bistability in the activation of Cdc2. Nat Cell Biol 5: 346–351. 24. Sha W, Moore J, Chen K, Lassaletta AD, Yi CS, et al. (2003) Hysteresis drives
cell-cycle transitions in Xenopus laevis egg extracts. Proc Natl Acad Sci USA 100: 975–980.
25. Reynolds AR, Tischer C, Verveer PJ, Rocks O, Bastiaens PI (2003) EGFR activation coupled to inhibition of tyrosine phosphatases causes lateral signal propagation. Nat Cell Biol 5: 447–453.
26. Gardner TS, Cantor CR, Collins JJ (2000) Construction of a genetic toggle switch in Escherichia coli. Nature 403: 339–342.
27. Kobayashi H, Kaern M, Araki M, Chung K, Gardner TS, et al. (2004) Programmable cells: interfacing natural and engineered gene networks. Proc Natl Acad Sci USA 101: 8414–8419.
28. Kramer BP, Viretta AU, Daoud-El-Baba M, Aubel D, Weber W, et al. (2004) An engineered epigenetic transgene switch in mammalian cells. Nat Biotechnol 22: 867–870.
29. Sabouri-Ghomi M, Ciliberto A, Kar S, Novak B, Tyson JJ (2008) Antagonism and bistability in protein interaction networks. J Theor Biol 250: 209–218. 30. Bagowski CP, Besser J, Frey CR, Ferrell JE, Jr. (2003) The JNK cascade as a
biochemical switch in mammalian cells: ultrasensitive and all-or-none responses. Curr Biol 13: 315–320.
31. Laslo P, Spooner CJ, Warmflash A, Lancki DW, Lee HJ, et al. (2006) Multilineage transcriptional priming and determination of alternate hematopoi-etic cell fates. Cell 126: 755–766.
32. Ferrell JE, Jr. (2002) Self-perpetuating states in signal transduction: positive feedback, double-negative feedback and bistability. Curr Opin Cell Biol 14: 140–148.
33. Hasty J, McMillen D, Isaacs F, Collins JJ (2001) Computational studies of gene regulatory networks: in numero molecular biology. Nat Rev Genet 2: 268–279. 34. Laurent M, Kellershohn N (1999) Multistability: a major means of differenti-ation and evolution in biological systems. Trends Biochem Sci 24: 418–422. 35. Smolen P, Baxter DA, Byrne JH (2000) Mathematical modeling of gene
networks. Neuron 26: 567–580.
36. Guantes R, Poyatos JF (2008) Multistable decision switches for flexible control of epigenetic differentiation. PLoS Comput Biol 4: e1000235.
37. Kobayashi T, Chen L, Aihara K (2003) Modeling genetic switches with positive feedback loops. J Theor Biol 221: 379–399.
38. Cao Y, Liang J (2008) Optimal enumeration of state space of finitely buffered stochastic molecular networks and exact computation of steady state landscape probability. BMC Syst Biol 2: 30.
39. Chatterjee A, Kaznessis YN, Hu WS (2008) Tweaking biological switches through a better understanding of bistability behavior. Curr Opin Biotechnol 19: 475–481.
40. Okita K, Nakagawa M, Hyenjong H, Ichisaka T, Yamanaka S (2008) Generation of mouse induced pluripotent stem cells without viral vectors. Science 322: 949–953.
41. Boyer LA, Mathur D, Jaenisch R (2006) Molecular control of pluripotency. Curr Opin Genet Dev 16: 455–462.
42. Chickarmane V, Troein C, Nuber UA, Sauro HM, Peterson C (2006) Transcriptional dynamics of the embryonic stem cell switch. PLoS Comput Biol 2: e123.
43. Niwa H (2007) How is pluripotency determined and maintained? Development 134: 635–646.
44. Chari R, Lonergan KM, Ng RT, MacAulay C, Lam WL, et al. (2007) Effect of active smoking on the human bronchial epithelium transcriptome. BMC Genomics 8: 297.
45. Sridhar S, Schembri F, Zeskind J, Shah V, Gustafson AM, et al. (2008) Smoking-induced gene expression changes in the bronchial airway are reflected in nasal and buccal epithelium. BMC Genomics 9: 259.
46. Gao H, Ward PA (2007) STAT3 and suppressor of cytokine signaling 3: potential targets in lung inflammatory responses. Expert Opin Ther Targets 11: 869–880.
47. He B, You L, Uematsu K, Zang K, Xu Z, et al. (2003) SOCS-3 is frequently silenced by hypermethylation and suppresses cell growth in human lung cancer. Proc Natl Acad Sci USA 100: 14133–14138.
48. Boldrini L, Donati V, Dell’Omodarme M, Prati MC, Faviana P, et al. (2005) Prognostic significance of osteopontin expression in early-stage non-small-cell lung cancer. Br J Cancer 93: 453–457.
49. Boldrini L, Gisfredi S, Ursino S, Faviana P, Lucchi M, et al. (2005) Expression of endothelin-1 is related to poor prognosis in non-small cell lung carcinoma. Eur J Cancer 41: 2828–2835.
50. Davis GL, Dempster J, Meler JD, Orr DW, Walberg MW, et al. (2008) Hepatocellular carcinoma: management of an increasingly common problem. Proc (Bayl Univ Med Cent) 21: 266–280.
51. Wurmbach E, Chen YB, Khitrov G, Zhang W, Roayaie S, et al. (2007) Genome-wide molecular profiles of HCV-induced dysplasia and hepatocellular carcinoma. Hepatology 45: 938–947.
52. Bae SH, Jung ES, Park YM, Kim BS, Kim BK, et al. (2001) Expression of cyclooxygenase-2 (COX-2) in hepatocellular carcinoma and growth inhibition of hepatoma cell lines by a COX-2 inhibitor, NS-398. Clin Cancer Res 7: 1410–1418.
53. Baek JY, Hur W, Wang JS, Bae SH, Yoon SK (2007) Selective COX-2 inhibitor, NS-398, suppresses cellular proliferation in human hepatocellular carcinoma cell lines via cell cycle arrest. World J Gastroenterol 13: 1175–1181.
54. Wheeler LW, Lents NH, Baldassare JJ (2008) Cyclin A-CDK activity during G1 phase impairs MCM chromatin loading and inhibits DNA synthesis in mammalian cells. Cell Cycle 7: 2179–2188.
55. Krones-Herzig A, Mittal S, Yule K, Liang H, English C, et al. (2005) Early growth response 1 acts as a tumor suppressor in vivo and in vitro via regulation of p53. Cancer Res 65: 5133–5143.
56. Hao MW, Liang YR, Liu YF, Liu L, Wu MY, et al. (2002) Transcription factor EGR-1 inhibits growth of hepatocellular carcinoma and esophageal carcinoma cell lines. World J Gastroenterol 8: 203–207.
57. Elsammak MY, Amin GM, Khalil GM, Ragab WS, Abaza MM (2006) Possible contribution of serum activin A and IGF-1 in the development of hepatocellular carcinoma in Egyptian patients suffering from combined hepatitis C virus infection and hepatic schistosomiasis. Clin Biochem 39: 623–629.
58. Qiao L, Nachbar RB, Kevrekidis IG, Shvartsman SY (2007) Bistability and oscillations in the Huang-Ferrell model of MAPK signaling. PLoS Comput Biol 3: 1819–1826.
59. Niwa H, Toyooka Y, Shimosato D, Strumpf D, Takahashi K (2005) Interaction between Oct3/4 and Cdx2 determines trophectoderm differentiation. Cell 123: 917–929.
60. Wang ES, Szabo SJ, Schwartberg PL, Glimcher LH (2005) T helper cell fate specified by kinase-mediated interaction of T-bet with GATA-3. Science 307: 430–433.
61. Schwarz M, Cecconi F, Bernier G, Andrejewski N, Kammandel B, et al. (2000) Spatial specification of mammalian eye territories by reciprocal transcriptional repression of Pax2 and Pax6. Development 127: 4325–4334.
62. Asyali MH, Shoukri MM, Demirkaya O, Khabar KS (2004) Assessment of reliability of microarray data and estimation of signal thresholds using mixture modeling. Nucleic Acids Res 32: 2323–2335.
63. Hinkley DV (1969) On the ratio of two correlated normal random variables. Biometrika 56: 635–639.
64. Brody JP, Williams BA, Wold BJ, Quake SR (2002) Significance and statistical errors in the analysis of DNA microarray data. Proc Natl Acad Sci USA 99: 12975–12978.
65. Cochella L, Green R (2005) Fidelity in protein synthesis. Curr Biol 15: R536–540.
66. Xu Y, Chen SY, Ross KN, Balk SP (2006) Androgens induce prostate cancer cell proliferation through mammalian target of rapamycin activation and post-transcriptional increases in cyclin D proteins. Cancer Res 66: 7783–7792. 67. Novichkova S, Egorov S, Daraselia N (2003) MedScan, a natural language
processing engine for MEDLINE abstracts. Bioinformatics 19: 1699–1706. 68. Parkinson H, Kapushesky M, Shojatalab M, Abeygunawardena N, Coulson R,
et al. (2007) ArrayExpress—a public database of microarray experiments and gene expression profiles. Nucleic Acids Res 35: D747–750.
69. Irizarry RA, Hobbs B, Collin F, Beazer-Barclay YD, Antonellis KJ, et al. (2003) Exploration, normalization, and summaries of high density oligonucleotide array probe level data. Biostatistics 4: 249–264.
![Figure 7 is a BTS toggling graph in which mRNA expression data (ArrayExpress ID: E-GEOD-6764, [51]) for tissues from patients with HCV-induced dysplasia and HCC are compared with mRNA expression data for normal liver tissue](https://thumb-eu.123doks.com/thumbv2/123dok_br/18415041.360235/4.918.89.791.87.778/figure-toggling-expression-arrayexpress-patients-dysplasia-compared-expression.webp)