Fine-Scale Cartography of Human Impacts
along French Mediterranean Coasts: A
Relevant Map for the Management of
Marine Ecosystems
Florian Holon1,2*, Nicolas Mouquet2, Pierre Boissery3, Marc Bouchoucha4, Gwenaelle Delaruelle1, Anne-Sophie Tribot1, Julie Deter1,2
1Andromède Océanologie, 7 place Cassan, 34280 Carnon, France,2Institut des Sciences de l’Evolution (ISEM)—UMR 5554 CNRS—IRD—UM, Campus de l’Université de Montpellier, 34095 Montpellier cedex 5, France,3Agence de l’Eau Rhône-Méditerranée-Corse, Délégation de Marseille, Immeuble le Noailles, 62 La Canebière, 13001 Marseille, France,4Laboratoire Ifremer Environnement Ressources Provence-Azur-Corse, Centre Méditerranée—Zone Portuaire de Brégaillon—CS20 330–83507 La Seyne-sur-Mer Cedex, France
Abstract
Ecosystem services provided by oceans and seas support most human needs but are threatened by human activities. Despite existing maps illustrating human impacts on marine ecosystems, information remains either large-scale but rough and insufficient for stakeholders (1 km² grid, lack of data along the coast) or fine-scale but fragmentary and heterogeneous in methodology. The objectives of this study are to map and quantify the main pressures exerted on near-coast marine ecosystems, at a large spatial scale though in fine and relevant resolution for managers (one pixel = 20 x 20 m). It focuses on the French Mediterranean coast (1,700 km of coastline including Corsica) at a depth of 0 to 80 m. After completing and homogenizing data presently available under GIS on the bathymetry and anthropogenic pressures but also on the seabed nature and ecosystem vulnerability, we provide a fine modeling of the extent and impacts of 10 anthropogenic pressures on marine habitats. The considered pressures are man-made coastline, boat anchoring, aquaculture, urban effluents, industrial effluents, urbanization, agriculture, coastline erosion, coastal population and fishing. A 1:10 000 continuous habitat map is pro-vided considering 11 habitat classes. The marine bottom is mostly covered by three habi-tats: infralittoral soft bottom,Posidonia oceanicameadows and circalittoral soft bottom.
Around two thirds of the bottoms are found within medium and medium high cumulative impact categories. Seagrass meadows are the most impacted habitats. The most impor-tant pressures (in area and intensity) are urbanization, coastal population, coastal erosion and man-made coastline. We also identified areas in need of a special management inter-est. This work should contribute to prioritize environmental needs, as well as enhance the development of indicators for the assessment of the ecological status of coastal systems. It
a11111
OPEN ACCESS
Citation:Holon F, Mouquet N, Boissery P, Bouchoucha M, Delaruelle G, Tribot A-S, et al. (2015) Fine-Scale Cartography of Human Impacts along French Mediterranean Coasts: A Relevant Map for the Management of Marine Ecosystems. PLoS ONE 10(8): e0135473. doi:10.1371/journal.pone.0135473
Editor:Carlo Nike Bianchi, Università di Genova, ITALY
Received:April 20, 2015
Accepted:July 22, 2015
Published:August 12, 2015
Copyright:© 2015 Holon et al. This is an open access article distributed under the terms of the Creative Commons Attribution License, which permits unrestricted use, distribution, and reproduction in any medium, provided the original author and source are credited.
Data Availability Statement:All the data underlying the findings in our study are freely available within the paper, its Supporting Information file and onwww. medtrix.fr(IMPACT project).
could also help better apply and coordinate management measures at a relevant scale for biodiversity conservation.
Introduction
Oceans and seas are very important for human well-being; their ecosystems provide among the most important ecosystem services: provision of food, natural shoreline protection against storms and floods, water quality maintenance, support of tourism and other cultural benefits, and maintenance of basic global life support systems [1]. The challenge lies in keeping these resources in a sustainable state of use, which is the main objective of the European Union's Marine Strategy Framework Directive (MSFD, 2008/56/EC) by achieving Good Environmental Status (GES) of EU's marine waters. Yet marine ecosystems and marine resources are under severe anthropogenic threats: population growth, land use change and habitat loss, overfishing and destructive fishing methods, illegal fishing, invasive species, climate change, pollution, increased demand for food and a shift in food preference [2]. The human impact is so great that no region can be considered virgin territory [3–5]. Protecting marine biodiversity and the essential ecosystem services it supports is considered a top priority by different authorities: the scientific community, resource managers, national and international policy agreements, including the MSFD and the Convention on Biological Diversity [6]
In this context, it is essential to analyze species and habitat distribution, environmental vari-ables and human threats but also their correlations. Spatial distribution of anthropogenic pres-sures is particularly important because it is the basis of numerous other studies: ecological indicators development, species distribution analysis, design of marine reserves and of conser-vation plans. In this context, large-scale (continental, worldwide) studies are now commonly conducted while local studies (regional) are lacking [7–9]. Naturally, generalization often leads to an extrapolation of the spatial and temporal scales at which reliable predictions can be made because by definition large-scale models are not able to fully account for fine-grained complex-ity [10,11]. Moreover, large-scale predictions and their limitations may be particularly hard to understand and to use for regional managers and local policy makers focusing on specific inter-ests (i.e.<1km² grid cells). There is thus a paradox between the international scale of political
will and the local scale of biodiversity conservation, but also a gap between global analyses and what can really be done in the field [12]. Consequently, there is a need to provide managers and stakeholders with local fine-scale information.
In order to fill this gap, fine-scale mapping efforts are multiplying in Europe especially in France [13–15], Spain [16–18], Italy [12,19–21] or Greece [22,23] or along the Baltic sea [24]. Because of the high costs to acquire such data, these fine-scale maps are generally funded in order to respond to specific and local objectives (the study of protected areas, a specific habitat [25] or particular features [26], environmental impact assessment [27]). Consequently, they mostly remain local (often a bay) and thus fragmentary (in space but also for the considered habitats and/or pressures) and heterogeneous in their methodology [12]. Moreover they are often available with difficulty: grey literature [15] or communications during conferences [28] instead of publications (but see [29]). All of this can be an obstacle to understand the impact of pressures on coastal marine habitats and thus to make decision at a local and regional scale. Fine-scale (15 x 15 m grid cells) spatial models have been recently developed in order to link multiple pressures with various coastal ecosystem status within a marine protected area [30]. The implementation into geographical information systems (GIS) allows a predictive approach Marc Bouchoucha by Ifremer (http://www.ifremer.fr/),
Gwenaelle Delaruelle and Anne-Sophie Tribot by Andromède Océanologie and Julie Deter by the University of Montpellier (http://www.umontpellier.fr/) and Andromède Océanologie. The funders had no role in study design, data collection and analysis, decision to publish, or preparation of the manuscript. Andromède Océanologie, a commercial funder, provided support in the form of salaries for authors (FH, GD, A-ST and JD), but did not have any additional role in the study design, data collection and analysis, decision to publish, or preparation of the manuscript. The specific roles of these authors are articulated in the "author contributions" section.
of the consequences of different management alternatives [30–32]. This represents an impor-tant decision support tool for choosing efficient management solutions in the face of complex interactions and high uncertainty. Information concerning pressure distribution (presence/ absence of relevant human activities, weighted distance of these activities) have been here suc-cessfully used in order to map potential impacts [33–36]. These data are so useful for local managers that they should exist all along the coast. A map of the diverse coastal marine habi-tats, of coastal pressures and impacts on these habitats extended to the entire coast would have an interest for the local managers and stakeholders but also for regional and national authori-ties. It would permit to feed the overall think on the coastal use but also highlight conservation and management priorities, compare different sites and management ways and assess the water body quality.
The objective of this work is to map and quantify, at a large spatial scale though in fine and relevant resolution for managers, the main drivers and pressures triggering changes within coastal marine ecosystems. In order to reach these objectives, localization of the different pres-sures exerted and their impacts is needed as much as maps of marine ecosystems. Among numerous seas listed on Earth, Mediterranean presents the particularity of being a biodiversity hotspot facing numerous and strong threats [37–40]. While maps of cumulative human impacts on marine ecosystems exist at the scale of the Mediterranean and Black sea and even at worldwide scale [5,40–42], this information could be completed along the coast. For instance, the resolution used by Micheli et al. [41] within the Mediterranean and Black sea is 1 km² pixels and no data is associated with the first pixels close to the coast, where most anthropogenic pressures are concentrated.
Interested in data that could be of real use to local managers and stakeholders, we sampled data from a homogeneous environmental policy context and thus focused on a unique country: France with its 1700 km of Mediterranean coastline, including Corsica. Our goals were to (1) provide the first complete marine coastal habitat map of the French Mediterranean coast (including Corsica), and (2) to quantify and map cumulative impacts to provide the data needed (one pixel = 20 x 20 m) to help the development of an effective marine policy. On these bases, we identified the most and least impacted areas (water bodies), the top threats affecting coastal waters, and the areas representing top priorities for ecosystem-based management and conservation efforts. The cumulative impact map obtained will be useful for local decision makers and thus complementary to large-scale previous works [41].
Materials and Methods
Marine habitats
The study considers the entire French Mediterranean coastline (including Corsica) included within the 46 water bodies of homogeneous water according to the Water Framework Directive (WFD,2000/60/EC) [43]. Interested in costal-based impacts, we particularly focus on the shal-low part: between 0 and -80 m. After a bibliographic synthesis, we gathered and homogenized data on habitat maps; these data were collected by Andromède Océanologie, Agence de l'Eau RMC;Conservatoire du Littoral, DREAL PACA; EGIS EAU, ERAMM, GIS POSIDONIE, IFREMER, Institut océanographique Paul Ricard, Nice Côte d'Azur, TPM, Programme CAR-THAM—Agence des Aires Marines Protégées, ASCONIT Consultants, COMEX-SA, EVE-MAR, IN VIVO, Sintinelle, Stareso, Programme MEDBENTH, Université de Corse (EQEL), Ville de St Cyr-sur-mer, Ville de Cannes, Ville de Marseille, Ville de St Raphaël, Ville de St Tro-pez (S1–S3Figs).
led between 2010 and 2014 using first aerial or satellite photography (in order to measure the spatial extent of habitats in shallow waters) and a multi-beam echo-sounder GeoSwath Plus (Kongsberg Geoacoustics LTD) survey (to draw the bathymetry). Then, a side-scan sonar sur-vey (used in more turbid and deeper (<-15 m) waters) was led. By ensonifying a swath of
sea-bed and measuring the amplitude of the backscattered return signals, an image of the seasea-bed was built up with information on the morphology and substrate content. We used a Klein Sys-tem 3900 with a frequency comprised between 445 and 900 kHz. After that, sonar information was post-treated to determine the potential presence and coverage of underwater habitat repre-sentation. All of these data allow achieving a preliminary cartography of benthic habitats.
Numerous uncertainties still remained after this preliminary cartography work. Direct observations (“ground-truth points”) were thus needed through diving sessions (around 1600 dives between 0 and -80 m all along the coastline between 2010 and 2014). They included clas-sic dives and“towed dives”that allowed the sampling of 20 920 ground-truth points. During
“towed dives”, the diver was actively able to maneuver a“towboard”to maintain a relative con-stant elevation above the seabed. The towboard was equipped with an underwater GPS trans-ducer providing the accurate position and exact depth of the diver in real-time to the surface operator. The diver equipped with an integrated communication system transmitted a large quantity of information on benthic habitats (community of organisms which lived on, in, or near the seabed, state of the habitat, occurrence of impacts on the habitat). Occasional explor-ing dives aimed, by means ofin situobservation, to clarify data. These dives allowed to recog-nize the nature of the seabed and to characterize benthic populations. Field work was
organized in cooperation with the French water agency (public authority) which gave permis-sion to conduct the work. Field work was also declared to the authorities responsible of the concerned marine parks. The field studies did not involve endangered or protected species.
A final continuous habitat map (scale = 1:10 000 between 0 and–80 m and 1:25 000 beyond in the case of deeper water bodies) was realized comprising eleven habitat classes:Cymodocea nodosaseagrass,Zostera marinaandnoltii. seagrass,Posidonia oceanicaseagrass, dead matte association, infralittoral shingle association, infralittoral soft bottoms, photophilous algae asso-ciation, coralligenous assemblages, circalittoral soft bottoms, artificial habitats, offshore rocks. Ecosystem data were finally converted into presence/absence 20 x 20 m pixel layers (in order to be adapted to the pixel size related to the anthropogenic pressures, see below); the habitat cor-responding to each pixel was defined by the major habitat observed within the grid (percent cover>50%).
Anthropogenic pressures
Micheli et al. [21] because their control appeals for high-level decisions. In addition to this, cli-mate drivers are not considered among the MSFD’s good environmental status descriptors [47]. Ten different pressures (based on quantitative data) were considered: (1) man-made coastline (big harbours / harbours / artificial beaches, ports of refuge / pontoons, groynes, land-fills and seawalls areas), (2) boat anchoring (number and size of boats observed during sum-mer), (3) aquaculture (total area of the farms), (4) urban effluents (capacity, output), (5) industrial effluents (chemical oxygen demand), (6) urbanization (land cover), (7) agriculture (land cover), (8) coastline erosion (land cover), (9) coastal population (size and density consid-ering the inhabitants-residents) and (10) fishing (traditional and recreational fishing areas) [seeS1 Textfor details]. Even if continuous pressures (e.g. wastewater) are generally distin-guished from discrete pressures (e.g a groyne building), low resilience of marine ecosystems (especiallyPosidonia oceanicabeds and coralligenous reefs; [48,49]) allow the combination of both pressures within the same methodology.
Data concerning the origin and intensity of these pressures are available in published data-bases: MEDAM [50], CORINE land cover [51], INSEE [52], MEDOBS data [53] but were also provided by Agence de l’Eau RMC and Ifremer completed with an analysis of satellite-aerial pictures and unpublished data (Andromède Océanologie). Models of the spatial extent of the pressures were built using ArcGIS 10 (ESRI) with a 20-m distance matrix. We applied a pres-sure curve (typey = ae-bx) considering the distance to the source with a negative exponential shape ranging between 100% (origin) and 0% (no more impact) to each type of pressure. We included the bathymetry to model the spread of each pressure based on literature synthesis and our expert knowledge. Details and parameters of each modeled pressure are given inS1 Text.
Cumulative human impacts
We used a cumulative impact model following Halpern et al. [5,25] and Micheli et al. [21]. First, we assembled spatial datasets forn= 10 anthropogenic pressures (valueDi) (seeS1 Text)
andm= 11 habitats (valueEj). Secondly, all pressure layers were then log[X+1]-transformed
and rescaled between 0–1 to allow direct comparisons. The sum of the different pressures per pixel was calculated. Then, cumulative impacts scores (IC) for each 20 x 20 m pixel were
calcu-lated according to Micheli et al. [21] and Halpern et al. [5]:
IC¼
Xn
i¼1 Xm
j¼1
DiEjmi;j
WhereDiis the value of an anthropogenic pressure at locationi,Ejis the presence or
absence of habitatjandμi,jis the impact weight of anthropogenic pressureIand habitatj[5].
Like Micheli et al. [21], values of impact weights were deduced from Halpern et al. [25]. Cumulative impact to individual ecosystems (IE) was calculated as follows:
IE¼
Xn
i¼1
DiEjmi;j
and impact of individual pressures across all ecosystem types (ID) was calculated as follows:
ID¼
Xm
i¼1
DiEjmi;j
To simplify visualization, impacts were classified in six categories depending onICvalues:
very high (Ic>10); high (8<Ic<10); medium high (2.1<Ic<8); medium (0.6<Ic<2.1); low
French Mediterranean coasts, for each marine habitat and for each water body (water bodies are here used for their interest in marine policy and as spatial references). Pixels free from any pressure (all pressures equal to null values) were not further considered.
Results
Marine habitats
The final continuous map of marine habitat (1:10 000 between 0 and -80 m and 1:25 000 beyond) consists of 5 785 972 pixels and covers 373 206 ha (Table 1):Cymodocea nodosa sea-grass (506 ha),Zostera marinaandnoltiiseagrass (572 ha),Posidonia oceanicaseagrass (70 641 ha), dead matte association (5 693 ha), infralittoral shingle association (211 ha), infralit-toral soft bottoms (102 451 ha), photophilous algae association (12 617 ha), coralligenous assemblages (2 661 ha), circalittoral soft bottoms (177 483 ha), artificial habitats (233 ha), off-shore rocks (138 ha). Maps (one pixel = 10 x 10 m) are freely available onwww.medtrix.frin DONIA expert (data hosted by Medtrix are freely available for logged-in people (create account on the homepage by clicking on « register ») via the“connection”tab), see. an example of map concerning the gulf of St Tropez inS1 File). A total of 231 606 ha is considered in this study after removing 141 600 ha not concerned by any of the pressures taken into account; the removed areas are located along the deepest limits (deeper than–100 m) of the water bodies. Most (92%) of the mapped marine bottom is covered with three habitats: infralittoral soft bot-toms (38%),P.oceanicameadows (28%) and circalittoral soft bottom (25%).
Anthropogenic pressures
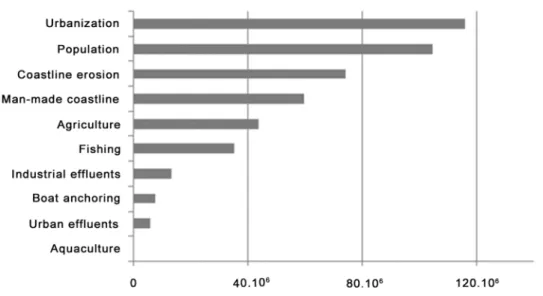
Maps concerning each of the ten pressures are available onwww.medtrix.frin IMPACT project (see box 1 and examples of maps concerning the golfe of St Tropez inS1 File). Five pressures concern more than 40% of the considered area: urbanization (70%), coastal population (54%), coastal erosion (47%), man-made coastline (43%) and agriculture (41%). Pressures showing the highest cumulated value are urbanization, coastal population and man-made coastline (Fig 1). Urbanization is the most important pressure exerted on all habitats except on coralligenous assemblages, circalittoral soft bottoms and offshore rocks where fishing prevails and on artifi-cial habitats where man-made coastline predominates (Fig 2). All pressures affect every habitat except forZostera marinaandnoltiimeadows which are not impacted by aquaculture, urban
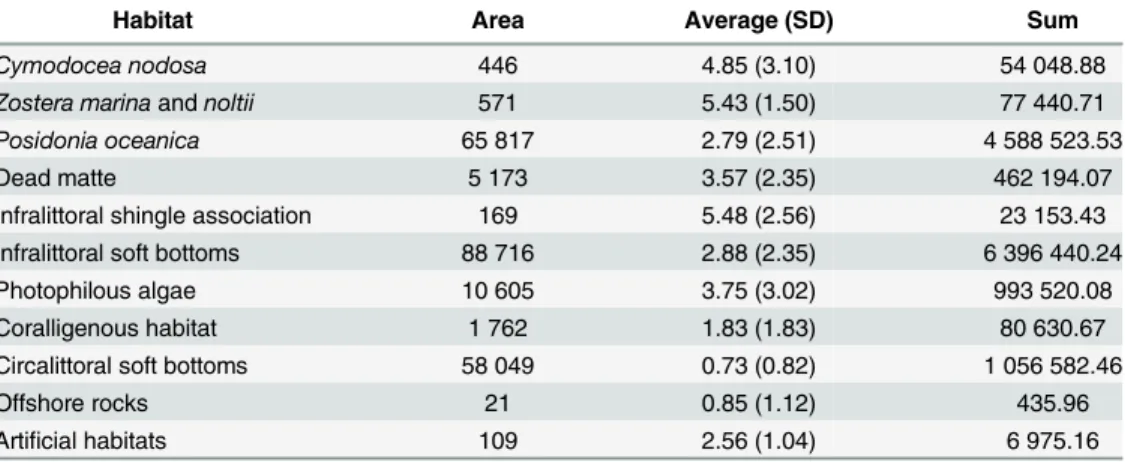
Table 1. Analysis of the cumulative impact scores per marine habitat.Average, standard deviation (SD) and sum of the cumulative impact scores (IC) obtained by each 20 x 20 m cell composing each marine habitat
(j). Areas of the habitats are indicated in ha.
Habitat Area Average (SD) Sum
Cymodocea nodosa 446 4.85 (3.10) 54 048.88
Zostera marinaandnoltii 571 5.43 (1.50) 77 440.71
Posidonia oceanica 65 817 2.79 (2.51) 4 588 523.53
Dead matte 5 173 3.57 (2.35) 462 194.07
Infralittoral shingle association 169 5.48 (2.56) 23 153.43
Infralittoral soft bottoms 88 716 2.88 (2.35) 6 396 440.24
Photophilous algae 10 605 3.75 (3.02) 993 520.08
Coralligenous habitat 1 762 1.83 (1.83) 80 630.67
Circalittoral soft bottoms 58 049 0.73 (0.82) 1 056 582.46
Offshore rocks 21 0.85 (1.12) 435.96
Artificial habitats 109 2.56 (1.04) 6 975.16
effluents, agriculture and fishing, and offshore rocks which are not affected by anchoring, aqua-culture and industrial effluents (Fig 2).
Cumulative human impacts
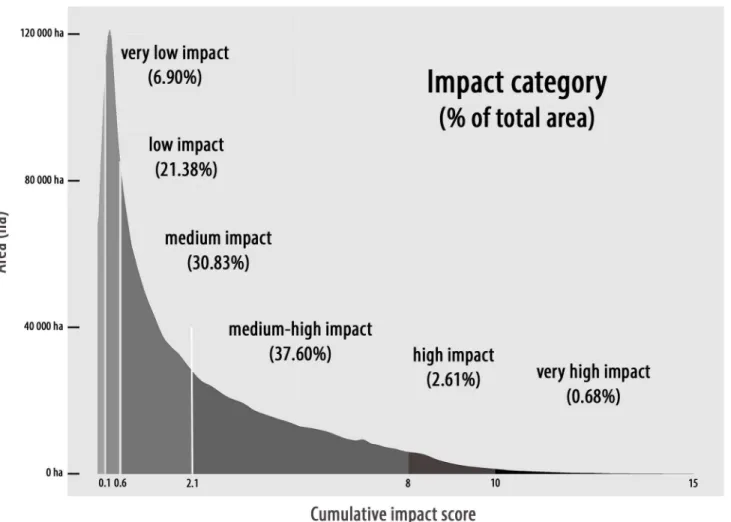
Analysis per habitat. Cumulated impact scores range between 0 and 15 (Fig 3andS1
File). The highest sums of cumulated impact scores (Ic) are observed on infralittoral soft
bot-toms andP.oceanicameadows. The strongest meanIcrange between 4.85 and 5.48
(medium-Fig 1. Total cumulated value (sum of all 20 x 20 m cell values concerning a pressure) of each individual pressure (no unit).
doi:10.1371/journal.pone.0135473.g001
Fig 2. Repartition of the total cumulated value of each pressure in function of the habitats.Each pie chart indicates the repartition (in percent) of the
total cumulated value (sum of all 20 x 20 m cell values concerning a pressure) of each individual pressure (name indicated in the white rectangles) in function of the habitats.
Fig 3. Cumulative impact scores (IC) depicting the area (in ha) and the percent of total area (in parentheses) that falls within each impact category. doi:10.1371/journal.pone.0135473.g003
Table 2. Analysis of the cumulative impact categories per marine habitat.Percent of each marine habitat area affected by the different cumulative
impact categories: very high impact (Ic>10); high impact (8–10); medium-high impact (2.1–8); medium impact (0.6–2.1); low impact (0.1–0.6); and very low impact (<0.1). Areas are indicated in ha.
Habitat Area Percent of area affected by the different cumulative impact categories
Very low Low Medium Med-high High Very high
Cymodocea nodosa 446 4.18 5.62 8.36 61.37 12.42 8.05
Zostera marinaandnoltii 571 0.00 0.00 0.03 96.01 3.97 0.00
Posidonia oceanica 65 817 3.78 15.03 32.62 43.67 3.43 1.47
Dead matte 5 173 2.52 5.96 23.41 62.90 5.02 0.19
Infralittoral shingle association 169 1.97 1.02 7.72 68.65 19.35 1.30
Infralittoral soft bottoms 88 716 4.20 13.62 29.31 49.67 3.02 0.18
Photophilous algae 10 605 5.26 13.55 18.31 52.37 6.79 3.72
Coralligenous habitat 1 762 6.43 25.04 37.06 31.18 0.28 0.00
Circalittoral soft bottoms 58 049 15.25 43.58 34.50 6.67 0.00 0.00
Offshore rocks 21 9.94 46.39 33.92 9.75 0.00 0.00
Artificial habitats 109 0.22 7.12 16.03 76.63 0.00 0.00
high impact): they are observed on infralittoral shingle association,Zostera marinaandnoltii
andCymodocea nodosameadows.Icpresents the highest variance onCymodocea nodosa
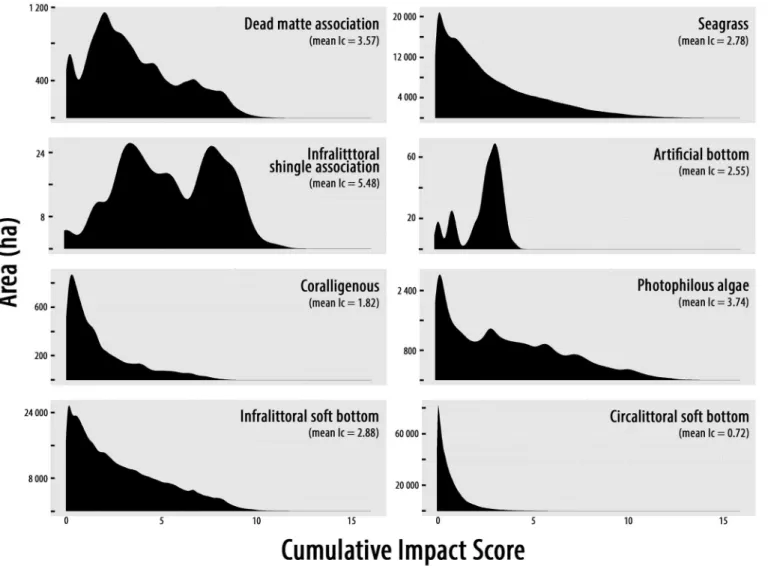
meadows and photophilous algae (Table 1). All marine habitats are mostly subjected to medium high impacts except for coralligenous assemblages subjected to medium impacts, and circalittoral soft bottoms as well as offshore rocks concerned by low impacts (Table 2,Fig 4). Dead matte, infralittoral shingle association and artificial habitats are less subject to anIc
infe-rior to medium-high (Fig 4). Around 3.3% of habitats undergo high or very highIc(especially
P.oceanicameadows). On the contrary, 28.3% of habitats are associated with low or very low
Icespecially circalittoral soft bottoms, infralittoral soft bottoms, thenP.oceanicameadows (Table 2). The meanIcis the highest between 0 and -15 m depth for almost all habitats (except
circalittoral soft bottoms and offshore rocks absent beyond -15 m depth).
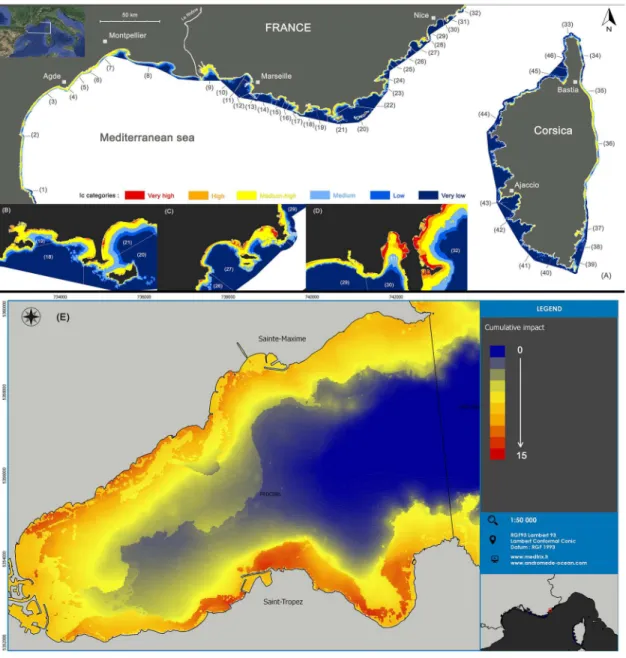
Spatial analysis per water body. Concerning water bodies (localization presented in
Fig 5), the highest sums of cumulated impact scores (sum of the score of each 20 x 20 m cell) are observed within water bodies 36 and 2, two of the biggest water bodies of the area (Table 3). The highest meanIccorrespond to medium-high impact values; they are observed among the
smallest water bodies: average = 7.14 within water body 31 (also presenting the highest Fig 4. Distribution of cumulative impact scores (IC) for each habitat
variance) and average = 5.82 within water body 40 (Table 3). All water bodies are mostly sub-jected to medium-high impacts (average ranging between 2.1 and 8,Fig 3andTable 3). All water bodies (except two: 13 and 33 located around the Calanques of Marseille and the North-ern cape of Corsica) contain areas with high or very highIc(Table 3). On the contrary, all
water bodies contain areas associated with low or very lowIcespecially water bodies 8, 14, 15,
33, 34, 41, 42, 44 and 46 located in Corsica, within the Calanques of Marseille and within the Western part of the Rhône (Fig 5andTable 3).
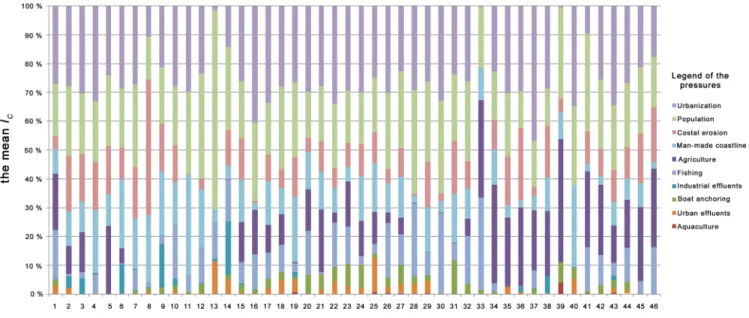
Regarding the anthropogenic pressures, urbanization is the major pressure affecting all water bodies except for 5, 7, 41, 12, 13, 14, 27, 32, 38 (for which population is the major pres-sure); 39, 40, 33, 34 (for which agriculture is the major prespres-sure); 9, 11 (for which man-made Fig 5. Spatial distribution of cumulative impact scores.(A) Spatial distribution of cumulative impact scores (IC) and localization of coastal water bodies.
(B, C, D) Zooms showing how water bodies are more or less impacted (ICcategories). (E) Detailed map of the Golfe of St Tropez showing how the golfe is
impacted (quantitativeICscores) Several cities are indicated by small squares.
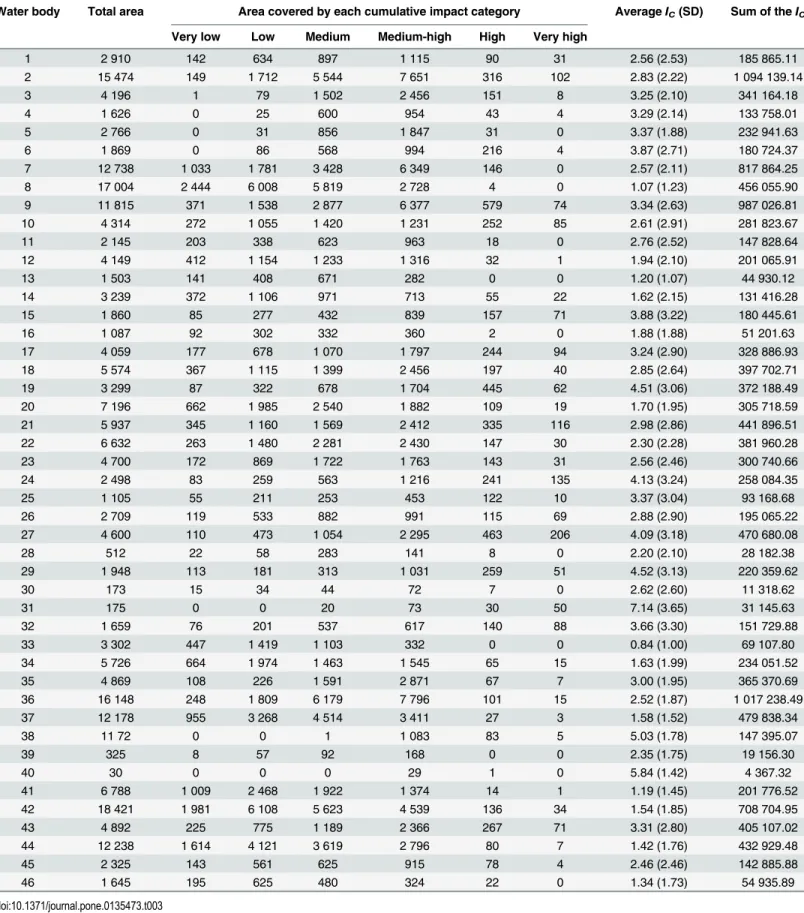
Table 3. Analysis of the pressures per water body.For each water body, the table describes its total area, its area covered by each cumulative impact score (IC) category (very low, low, medium, medium-high, high, very high impact), the average and standard deviation (SD) ofICand the sum of theIC
obtained by each 20 x 20 m cell composing the water body. Coastal water bodies are numbered from West to East. Areas are indicated in ha.
Water body Total area Area covered by each cumulative impact category AverageIC(SD) Sum of theIC
Very low Low Medium Medium-high High Very high
1 2 910 142 634 897 1 115 90 31 2.56 (2.53) 185 865.11
2 15 474 149 1 712 5 544 7 651 316 102 2.83 (2.22) 1 094 139.14
3 4 196 1 79 1 502 2 456 151 8 3.25 (2.10) 341 164.18
4 1 626 0 25 600 954 43 4 3.29 (2.14) 133 758.01
5 2 766 0 31 856 1 847 31 0 3.37 (1.88) 232 941.63
6 1 869 0 86 568 994 216 4 3.87 (2.71) 180 724.37
7 12 738 1 033 1 781 3 428 6 349 146 0 2.57 (2.11) 817 864.25
8 17 004 2 444 6 008 5 819 2 728 4 0 1.07 (1.23) 456 055.90
9 11 815 371 1 538 2 877 6 377 579 74 3.34 (2.63) 987 026.81
10 4 314 272 1 055 1 420 1 231 252 85 2.61 (2.91) 281 823.67
11 2 145 203 338 623 963 18 0 2.76 (2.52) 147 828.64
12 4 149 412 1 154 1 233 1 316 32 1 1.94 (2.10) 201 065.91
13 1 503 141 408 671 282 0 0 1.20 (1.07) 44 930.12
14 3 239 372 1 106 971 713 55 22 1.62 (2.15) 131 416.28
15 1 860 85 277 432 839 157 71 3.88 (3.22) 180 445.61
16 1 087 92 302 332 360 2 0 1.88 (1.88) 51 201.63
17 4 059 177 678 1 070 1 797 244 94 3.24 (2.90) 328 886.93
18 5 574 367 1 115 1 399 2 456 197 40 2.85 (2.64) 397 702.71
19 3 299 87 322 678 1 704 445 62 4.51 (3.06) 372 188.49
20 7 196 662 1 985 2 540 1 882 109 19 1.70 (1.95) 305 718.59
21 5 937 345 1 160 1 569 2 412 335 116 2.98 (2.86) 441 896.51
22 6 632 263 1 480 2 281 2 430 147 30 2.30 (2.28) 381 960.28
23 4 700 172 869 1 722 1 763 143 31 2.56 (2.46) 300 740.66
24 2 498 83 259 563 1 216 241 135 4.13 (3.24) 258 084.35
25 1 105 55 211 253 453 122 10 3.37 (3.04) 93 168.68
26 2 709 119 533 882 991 115 69 2.88 (2.90) 195 065.22
27 4 600 110 473 1 054 2 295 463 206 4.09 (3.18) 470 680.08
28 512 22 58 283 141 8 0 2.20 (2.10) 28 182.38
29 1 948 113 181 313 1 031 259 51 4.52 (3.13) 220 359.62
30 173 15 34 44 72 7 0 2.62 (2.60) 11 318.62
31 175 0 0 20 73 30 50 7.14 (3.65) 31 145.63
32 1 659 76 201 537 617 140 88 3.66 (3.30) 151 729.88
33 3 302 447 1 419 1 103 332 0 0 0.84 (1.00) 69 107.80
34 5 726 664 1 974 1 463 1 545 65 15 1.63 (1.99) 234 051.52
35 4 869 108 226 1 591 2 871 67 7 3.00 (1.95) 365 370.69
36 16 148 248 1 809 6 179 7 796 101 15 2.52 (1.87) 1 017 238.49
37 12 178 955 3 268 4 514 3 411 27 3 1.58 (1.52) 479 838.34
38 11 72 0 0 1 1 083 83 5 5.03 (1.78) 147 395.07
39 325 8 57 92 168 0 0 2.35 (1.75) 19 156.30
40 30 0 0 0 29 1 0 5.84 (1.42) 4 367.32
41 6 788 1 009 2 468 1 922 1 374 14 1 1.19 (1.45) 201 776.52
42 18 421 1 981 6 108 5 623 4 539 136 34 1.54 (1.85) 708 704.95
43 4 892 225 775 1 189 2 366 267 71 3.31 (2.80) 405 107.02
44 12 238 1 614 4 121 3 619 2 796 80 7 1.42 (1.76) 432 929.48
45 2 325 143 561 625 915 78 4 2.46 (2.46) 142 885.88
46 1 645 195 625 480 324 22 0 1.34 (1.73) 54 935.89
coastline is the major pressure); 8 (for which coastal erosion is the major pressure) (Fig 6). The relative influence of agriculture is higher for water bodies 33 to 46 (Corsica), while that of industrial effluents is higher within water bodies 9 and 14 (Fos-sur-mer and Eastern part of Marseille), and urban effluents are relatively more important between the Eastern part of Mar-seille and Nice (Fig 6).
Discussion
Fine-scale mapping of coastal habitats and pressures
This study presents the first large-scale (1700 km of coastline) continuous map of coastal Medi-terranean marine habitats. It confirms the importance of areas covered by seagrass [13,54,55] and completes the coralligenous habitat distribution recently mapped [56]. Marine habitat maps are important for marine ecology and essential for managing organizations [57–59]. More importantly, the fine scale (one pixel = 20 x 20 m and even 10 m x 10 m on Medtrix) and the large area (231 606 ha) covered are available at a relevant scale for the implementation of management and conservation measuresin natura. The initial stage of a management plan is the description of the natural components of the environment and of potential pressures and threats they are faced with. This is essential for both the identification of management priorities and the design of action plans [57,60], but also for helping managers develop dialogue with other stakeholders. Three major types of spatial information are lacking in the Mediterranean, compared to other regions such as Australia and the USA: bathymetry, habitats, and species biodiversity distribution [61]. Our results are thus important and should be completed for the rest of the Mediterranean especially for the Eastern part where information is particularly lacking.
Fig 6. Contribution (in %) of the different pressures to the mean cumulative impact score (IC) of each water body.Water bodies are classified from
West to East. No unit forIC.
A heterogeneous spatial distribution of pressures
The map of cumulative human impacts highlights the widespread but heterogeneous distribu-tion of pressures and their resulting impacts along the Mediterranean French coast. Around two thirds (68.5%) of the areas are found within medium and medium high categories, an order of magnitude similar to the one found within the French national territory waters (52.9%; [41]) and within the entire Mediterranean and Black sea (65.9% subject to medium cumulative impact [41]). Further direct comparisons with previous findings [42,62] are diffi-cult because they have considered a larger offshore waters area and have not presented data on coastal waters. However, at several sites, visual comparison between maps produced by both studies suggests that near-coastal and offshore situations seem to be concordant and comple-ment one another. For example, comparing to Micheli et al’sIc[41] or Coll et al’s coastal-based
impacts [39,42,62], the Eastern part of the Rhône shows large-scale problems with strongIcin
shallow (present results) and offshore waters [41], or well-preserved Northern Corsica and Camargue (Western part of the Rhône) are subjected to weakIcvalues whatever the study and
thus distance from the coast. High and very high priority areas highlighted by Giakoumi et al [42] are large and roughly include several points West of Montpellier, extend from Marseille to Nice, a small western part of the Rhône and areas at along the North Western and the South-Western coast of Corsica. Interest areas with low or very lowIcas defined by this present study
are covered by these priority areas except two: West of Montpellier where averageIcis
medium-high and the Northern Corsican cape where averageIcare the smallest of Corsica.
Despite the small local differences observed (due to the finer scale and/or the greater diversity of habitats considered in the present study) the high concordance observed between the find-ings make the results stronger and suggest that coastal impacts keep on spreading offshore. Concerning shallow near-coastal areas that were not included in previous studies [41,63], we confirm that pressures are mostly concentrated between 0 and -15 m where the most sensitive marine habitats are also developing; seagrass meadows for example show important regressions at this bathymetric level, especially because of artificial coastlines [64,65].
The most important pressures (considering both area and intensity) are urbanization, coastal population, coastal erosion and man-made coastline, which are directly related to coastal developments and territorial planning. Our results might help stakeholders prioritize their policy actions. Two regions should particularly draw attention: the bay of Villefranche-sur-mer (close to Nice) and Bonifacio (Southern cape of Corsica), respectively water bodies 31 and 40 presenting the highest meanIcand variance. Urbanization is broadly the major pressure
Corsica had the highest French demographic growth since 2006 (1.3% / year compared to 0.6%/year at national level—INSEE data) especially around the two coastal cities of Ajaccio and Bastia. Corsica’s coastal population pressure should thus particularly be monitored.
Our results show that two areas are particularly preserved from the analyzed anthropogenic pressures and should thus deserve particular attention and protection in the future: the Calan-ques of Marseille and the Northern cape of Corsica. Moreover, these regions present medium to high levels of biodiversities [39,40,66] and aesthetics [67]. The strong interest of these sites is indeed taken into account as a national marine park was created in the Calanques of Marseille in 2012 [68] and a project is under consideration within the Northern cape of Corsica since summer 2014 [69].
Threatened habitats
Because of the methodology, highIcare associated with numerous pressures. Almost all
habi-tats are affected by all pressures except the closest or the furthest from the coast (Zostera marinaandnoltiimeadows, offshore rocks). This highlights the importance of coordination for action plans focusing on pressures threatening coastal marine habitats.
Principally derived from other damaged habitats, a relatively weak proportion of dead matte and artificial habitats are logically subjected to low cumulative impacts in comparison with other habitats. Indeed, dead matte is the biological remains of deadP.oceanicameadows and artificial habitat is a man-made habitat replacing natural ones. However, these habitats should not be abandoned because they are interesting substrates for restoration measures. For example, seedlings ofP.oceanicatransplanted on dead matte show a higher survival rate than on sand or shingle substrate [70,71]. Artificial structures may also be directly (artificial reefs, green infrastructures), or indirectly (i.e. colonization of pipelines) used for biodiversity man-agement. For instance, several ongoing projects aiming at using artificial habitats (harbours, seawalls, groynes) to boost biodiversity might be more successful if local pressures are not too high [72,73].
Infralittoral shingle association is also largely submitted to medium and high cumulative impacts but for other reasons: it covers a relatively small area and it is localized at shallow depths (shingles carried by rivers are localized near the coastline) and where pressures are strong (major cities are located along the rocky coast). Finally, the most important cumulative pressures occur within the largest habitat, which is also the most sensitive: seagrass meadows. Seagrass meadows have to be a priority for management and conservation plans, being among the most efficient ecosystems considering the ecosystem services provided per surface unit [74]. Despite different protection measuresP.oceanicameadows already beneficiate from (European Habitats Directive, Barcelona Convention, Bern Convention), they are still strongly damaged [64,75,76].
The deepest habitats (coralligenous habitat, circalittoral soft bottoms and offshore rocks) are relatively less subjected to pressures (among the ones considered for this study) than the other habitats because they are generally more distant from the coast. Although many pres-sures are known to impact these habitats [27,77], we show that they are mostly threatened by fishing in the present study. Even non-industrial fishing practices (traditional, recreational, spearfishing) can cause rapid and substantial negative effects as well as represent an important part of the total fish catches (30% for example on the French Atlantic coasts) [78,79]. Despite the importance of this pressure, particularly on coralligenous habitats, very little actions have been taken to limit this recognized threat (mediumIc) [49] while outputs could be controlled
Utility for management despite several limitations
According to Giakoumi et al [42],“a prerequisite to quantification of threats and effective implementation of conservation actions is the acquirement of fine scale spatial data”. Maps of marine habitats and of pressures that can impact these habitats are the basic knowledge neces-sary for management work (see the first paragraph of discussion). Developing and measuring indicators of water quality or of ecological status of habitats, also needs to locate and assess the pressures acting locally; these are generally roughly estimated [80–82] and our maps of pres-sures and cumulative impacts might help to refine these works. Knowing precisely where are sensitive habitats and how they are impacted is essential before the deployment of adequate mitigation measures [42]. Our work will also make easier the measurement of management action efficiency; for example once anchoring is targeted as the major impacting pressure in an area, managers can choose how and where they want to contend with: mooring prohibition, mooring buoys, access to maps for boaters (i.e. Donia application [44]). Our work may help stakeholder to prioritize their means: protect areas where cumulative impacts are low or very low or try to act on“controllable”pressures where cumulative impacts are medium to high. Finally, these maps are like photos of the state of the coast at attime and might be done again in five to six years in order to see the eventual changes, compare similar sites and test the effi-ciency of different management choices.
Lastly, when interpreting the results, it is important to consider the data limitations and uncertainties inherent in this work. First, we assumed a linear relationship between pressure intensity and impact on habitat and ignored thus the existence of thresholds that certainly do exist. Like previous studies [41,42,62], we skipped the thresholds because there is a lack of information about them. Similarly, for the same reasons our analyses did not include eventual synergy or antagonism between pressures acting at the same place. Secondly, maps represent what we know in 2014; it is thus possible that some pressure or habitat is invisible on the maps because the information was unavailable at this time. Moreover, available data were collected during an extended period of time (four years) so they represent an average situation (besides without any seasonal variation) even if local managers easily communicate us their feed-back on the maps now available on line. Then detailed information are hard to access and thus data could be refined if they became available: use a finer grid size (presently 20 x 20 m) for pres-sures and avoid to degrade the presently available information for habitats (1:10 000 map), use more precise denominations for habitats (i. e. levels within habitat types, plant densities for
P.oceanica, data on species assemblages). Similarly, in perspective, numerous new pressures may be added if the data (raw data or model outputs) are available: climate change, alien spe-cies, industrial fishing (including trawling), diving activities or marine traffic for example.
Conclusion
of habitats and pressures with ecological modeling will prove particularly useful because“ long-term and large-area ecological processes are particularly poorly understood; and yet, in a num-ber of areas, issues and well-defined policies have not been sufficiently developed”[2]. In par-ticular, field data concerning ecosystem responses to pressures and thus the relationship between cumulative impact scores and ecosystem condition should now be considered a top priority [41].
Supporting Information
S1 Fig. Origin of the data used for marine habitat mapping on the Western part of the
French Mediterranean coast (Languedoc-Roussillon French region).The study considers
the coastline included within the water bodies. We particularly focus on the shallow part: between 0 and -80 m. After a bibliographic synthesis, we gathered and homogenized data on habitat maps. Gaps were completed with the program DONIA with a fine scale (1:10 000 map) between 0 and -80 m and a lower resolution (1:25 000) beyond.
(TIF)
S2 Fig. Origin of the data used for marine habitat mapping on the Eastern part of the
French Mediterranean coast (Provence Alpes Côte d’Azur French region).The study
con-siders the coastline included within the water bodies. We particularly focus on the shallow part: between 0 and -80 m. After a bibliographic synthesis, we gathered and homogenized data on habitat maps. Gaps were completed with the program DONIA with a fine scale (1:10 000 map) between 0 and -80 m and a lower resolution (1:25 000) beyond.
(TIF)
S3 Fig. Origin of the data used for marine habitat mapping on the Eastern part of the
French Mediterranean coast (Corsica French region).The study considers the coastline
included within the water bodies. We particularly focus on the shallow part: between 0 and -80 m. After a bibliographic synthesis, we gathered and homogenized data on habitat maps. Gaps were completed with the program DONIA with a fine scale (1:10 000 map) between 0 and -80 m and a lower resolution (1:25 000) beyond.
(TIF)
S1 Text. Details and parameters of each anthropogenic pressure. (DOCX)
S1 File. Examples of detailed maps obtained during the study for the different
anthropo-genic pressures, marine habitats, cumulative impact scores (IC) and cumulative impact
cat-egories.The Gulf of St Tropez is taken as an example. All the detailed maps are available:
www.medtrix. (PDF)
Acknowledgments
Author Contributions
Conceived and designed the experiments: FH NM PB JD. Performed the experiments: FH. Analyzed the data: FH NM JD. Contributed reagents/materials/analysis tools: FH PB MB GD AST. Wrote the paper: FH NM PB MB AST JD.
References
1. Millennium Ecosystem Assessment (MEA). Ecosystem and Human Well-Being: General Synthesis. 1st ed. Washington D.C.: Island Press; 2005.
2. The united nations environment programme (UNEP). Marine and coastal ecosystems and human
well-being: a synthesis report based on the findings of the Millennium Ecosystem Assessment. UNEP; 2006.
3. Jackson JB, Kirby MX, Berger WH, Bjorndal KA, Botsford LW, Bourque BJ, et al. Historical overfishing
and the recent collapse of coastal ecosystems. Science. 2001; 293: 629–637. doi:10.1126/science. 1059199PMID:11474098
4. Stachowitsch M. Research on intact marine ecosystems: A lost era. Mar Pollut Bull. 2003; 46: 801–805. doi:10.1016/S0025-326X(03)00109-7PMID:12837297
5. Halpern BS, Walbridge S, Selkoe KA, Kappel CV, Micheli F, D’Agrosa C, et al. A global map of human impact on marine ecosystems. Science. 2008; 319: 948–952. doi:10.1126/science.1149345PMID: 18276889
6. United Nations Environment Programme (UNEP). Convention on biological diversity [Internet]. 2014. Accessed 15 March 2015. Available:https:/www.cbd.int/
7. Pereira HM, Scharlemann JPW, Al E. Essential biodiversity variables. Science (80-). 2013; 339: 277–278. doi:10.1126/science.1229931
8. Thuiller W, Lavergne S, Roquet C, Boulangeat I, Lafourcade B, Araujo MB. Consequences of climate change on the tree of life in Europe. Nature. 2011; 470: 531–534. doi:10.1038/nature09705PMID: 21326204
9. Le Saout S, Hoffmann M, Shi Y, Hughes A, Bernard C, Brooks TM, et al. Conservation. Protected areas and effective biodiversity conservation. Science. 2013; 342: 803–5. doi:10.1126/science.1239268 PMID:24233709
10. Buisson L, Thuiller W, Casajus N, Lek S, Grenouillet G. Uncertainty in ensemble forecasting of species distribution. Glob Chang Biol. 2010; 16: 1145–1157. doi:10.1111/j.1365-2486.2009.02000.x
11. Scherrer D, Körner C. Infra-red thermometry of alpine landscapes challenges climatic warming
projec-tions. Glob Chang Biol. 2010; 16: 2602–2613. doi:10.1111/j.1365-2486.2009.02122.x
12. Rovere A, Casella E, Vacchi M, Parravicini V, Firpo M, Ferrari M, et al. Coastal and marine geomorphol-ogy between Albenga and Savona (NW Mediterranean Sea, Italy). J Maps. 2014; 11: 278–286. doi:10. 1080/17445647.2014.933134
13. Pasqualini V, Pergent-Martini C, Clabaut P, Pergent G. Mapping ofPosidonia oceanicausing Aerial
Photographs and Side Scan Sonar: Application off the Island of Corsica (France). Estuar Coast Shelf Sci. 1998; 47: 359–367. doi:10.1006/ecss.1998.0361
14. Bonhomme P, Bonhomme D, Boudouresque CF, Cadiou G, Charbonnel E. Monitoring of the lower limit ofPosidonia oceanicameadows at Port-Cros Island, Provence, Mediterranean Sea. 2010; 103: 87–103.
15. Holon F, Boissery P, Delaruelle G. Les dessous de la mer méditerranée—Cartographie de la méditerra-née française au 1/10000ème. Publi int Agence de l’eau RMC. 2014. Available:http://www.eaurmc.fr/ fileadmin/documentation/brochures_d_information/Mer_Mediterranee/Livret_Surfstat-WEB.pdf
16. Ruíz JM, Marín A, Calvo JF, Ramírez-Diaz L. Interactions between a floodway and coastal construc-tions in Aguila bay (Southeastern Spain). Ocean Coast Manag. 1993; 19: 241–262. doi: 10.1016/0964-5691(93)90044-Y
17. Barberá C, Moranta J, Ordines F, Ramón M, de Mesa A, Díaz-Valdés M, et al. Biodiversity and habitat mapping of Menorca Channel (western Mediterranean): Implications for conservation. Biodivers Con-serv. 2012; 21: 701–728. doi:10.1007/s10531-011-0210-1
18. Martín-García L, González-Lorenzo G, Brito-Izquierdo IT, Barquín-Diez J. Use of topographic predic-tors for macrobenthic community mapping in the Marine Reserve of La Palma (Canary Islands, Spain). Ecol Modell. 2013; 263: 19–31. doi:10.1016/j.ecolmodel.2013.04.005
20. Rovere A., Ferraris F, Parravicini V, Navone A., Morri C, Bianchi CN. Characterization and evaluation of a marine protected area:“Tavolara—Punta Coda Cavallo”(Sardinia, NW Mediterranean). J Maps. 2013; 9: 279–288. doi:10.1080/17445647.2013.778081
21. Zupo V, Mazzella L, Buia MC, Gambi MC, Lorenti M, Scipione MB, et al. A small-scale analysis of the spatial structure of a Posidonia oceanica meadow off the Island of Ischia (Gulf of Naples, Italy): Rela-tionship with the seafloor morphology. Aquat Bot. 2006; 84: 101–109. doi:10.1016/j.aquabot.2005.08. 006
22. Rousakis G, Karageorgis AP, Georgiou P. Geological structure and seabed morphology of the Stoupa submarine groundwater discharge system, Messinia, Greece. Environ Earth Sci. 2013; 71: 5059–5069. doi:10.1007/s12665-013-2910-1
23. Georgiadis M, Papatheodorou G, Tzanatos E, Geraga M, Ramfos A, Koutsikopoulos C, et al. Coralli-gene formations in the eastern Mediterranean Sea: Morphology, distribution, mapping and relation to fisheries in the southern Aegean Sea (Greece) based on high-resolution acoustics. J Exp Mar Bio Ecol. Elsevier B.V.; 2009; 368: 44–58. doi:10.1016/j.jembe.2008.10.001
24. Korpinen S, Meidinger M, Laamanen M. Cumulative impacts on seabed habitats: An indicator for
assessments of good environmental status. Mar Pollut Bull. Elsevier Ltd; 2013; 74: 311–319. doi:10. 1016/j.marpolbul.2013.06.036
25. Rovere A, Parravicini V, Firpo M, Morri C, Bianchi NC. Combining geomorphologic, biological and
accessibility values for marine natural heritage evaluation and conservation. Aquat Conserv Mar Freshw Ecosyst. 2011; 21: 541–552. doi:10.1002/aqc.1214
26. Bonacorsi M, Pergent-Martini C, Clabaut P, Pergent G. Coralligenous“atolls”: Discovery of a new mor-photype in the Western Mediterranean Sea. Comptes Rendus—Biol. 2012; 335: 668–672.
27. Gatti G, Montefalcone M, Rovere A, Parravicini V, Morri C, Albertelli G, et al. Seafloor integrity down the harbor waterfront: the coralligenous shoals off Vado Ligure (NW Mediterranean). Adv Oceanogr Limnol. 2012; 3: 51–67. doi:10.1080/19475721.2012.671190
28. Proceedings of Carhamb'ar. Cartographie des habitats marins benthiques : de l’acquisitionàla restitu-tion. Brest, 26–28 March 2013. Available:http://www.carhambar.org/Actes-du-colloque
29. Rovere A, Parravicini V, Vacchi M, Montefalcone M, Morri C, Bianchi CN, et al. Geo-environmental car-tography of the Marine Protected Area“Isola di Bergeggi”(Liguria, NW Mediterranean Sea). J Maps. 2010; 6: 505–519. doi:10.4113/jom.2010.1137
30. Parravicini V, Rovere A, Vassallo P, Micheli F, Montefalcone M, Morri C, et al. Understanding relation-ships between conflicting human uses and coastal ecosystems status: A geospatial modeling approach. Ecol Indic. Elsevier Ltd; 2012; 19: 253–263. doi:10.1016/j.ecolind.2011.07.027
31. Vacchi M, Montefalcone M, Parravicini V, Rovere A, Vassallo P. Spatial models to support the manage-ment of coastal marine ecosystems : a short review of best practices in Liguria, Italy. 2014; 172–180.
32. Bianchi CN, Parravicini V, Montefalcone M, Rovere A, Morri C. The challenge of managing marine bio-diversity: A practical toolkit for a cartographic, territorial approach. Diversity. 2012; 4: 419–452. doi:10. 3390/d4040419
33. Petrosillo I, Zaccarelli N, Zurlini G. Multi-scale vulnerability of natural capital in a panarchy of social-eco-logical landscapes. Ecol Complex. Elsevier B.V.; 2010; 7: 359–367. doi:10.1016/j.ecocom.2010.01. 001
34. Stelzenmüller V, Lee J, South A, Rogers SI. Quantifying cumulative impacts of human pressures on the marine environment: A geospatial modelling framework. Mar Ecol Prog Ser. 2010; 398: 19–32. doi:10. 3354/meps08345
35. Mensa JA., Vassallo P, Fabiano M. Marinas: A simple tool for the environmentally sound management of small marinas. J Environ Manage. 2011; 92: 67–77. doi:10.1016/j.jenvman.2010.08.003PMID: 20833466
36. Eastwood PD, Mills CM, Aldridge JN, Houghton CA, Rogers SI. Human activities in UK offshore waters: An assessment of direct, physical pressure on the seabed. ICES J Mar Sci. 2007; 64: 453–463. doi:10. 1093/icesjms/fsm001
37. Occhipinti-Ambrogi A. Global change and marine communities: alien species and climate change. Mar Pollut Bull. 2007; 55: 342–352. PMID:17239404
38. Danovaro R, Corinaldesi C, D’Onghia G, Galil B, Gambi C, Gooday AJ, et al. Deep-sea biodiversity in the Mediterranean Sea: The known, the unknown, and the unknowable. PLoS One. 2010; 5: e11832. doi:10.1371/journal.pone.0011832PMID:20689848
39. Coll M, Piroddi C, Steenbeek J, Kaschner K, Ben Rais Lasram F, Aguzzi J, et al. The Biodiversity of the
40. Coll M, Piroddi C, Albouy C, Ben Rais Lasram F, Cheung WWL, Christensen V, et al. The Mediterra-nean Sea under siege: spatial overlap between marine biodiversity, cumulative threats and marine reserves: The Mediterranean Sea under siege. Glob Ecol Biogeogr. 2011; 21: 465–480. doi:10.1111/j. 1466-8238.2011.00697.x
41. Micheli F, Halpern BS, Walbridge S, Ciriaco S, Ferretti F, Fraschetti S, et al. Cumulative human impacts on mediterranean and black sea marine ecosystems: assessing current pressures and opportunities. PLoS One. 2013; 8: e79889. doi:10.1371/journal.pone.0079889PMID:24324585
42. Giakoumi S, Sini M, Gerovasileiou V, Mazor T, Beher J, Possingham HP, et al. Ecoregion-Based Con-servation Planning in the Mediterranean: Dealing with Large-Scale Heterogeneity. PLoS One. 2013; 8. doi:10.1371/journal.pone.0076449
43. Ministère de l’Écologie du Développement Durable et de l'Énergie. Mise en oeuvre de la DCE et poli-tique locale de l’eau [Internet]. 2011. Available:http://www.statistiques.developpement-durable.gouv.fr/ lessentiel/article/240/1108/dce-masses-deau-superficielles-souterraines.html
44. Andromède Oceanologie, Agence de l’eau RMC. Donia, Un outil innovant et communautaire d’assis-tance au mouillage pour préserver les herbiers sous-marins. In: Andromede Edition [Internet]. 2014. Available:http://www.donia.fr/
45. Digout D, UNEP/GRID-Arendal. DPSIR framework for state of environment reporting. Vital Water Graphics; 2005.
46. Halpern BS, Selkoe KA, Micheli F, Kappel CV. Evaluating and ranking the vulnerability of global marine ecosystems to anthropogenic threats. Conserv Biol. 2007; 21: 1301–15. doi:10.1111/j.1523-1739. 2007.00752.xPMID:17883495
47. European Commission. Our Oceans, Seas and Coasts [Internet]. 2015. Available:http://ec.europa.eu/ environment/marine/good-environmental-status/index_en.htm
48. Almela ED, MarbàN, Álvarez E, Santiago R, Martínez R, Duarte CM. Patch dynamics of the Mediterra-nean seagrass Posidonia oceanica: Implications for recolonisation process. Aquat Bot. 2008; 89: 397–403. doi:10.1016/j.aquabot.2008.04.012
49. Ballesteros E. Mediterranean coralligenous assemblages: a synthesis of present knowledge. Oceanogr
Mar Biol An Annu Rev. 2006; 44: 123–195.
50. Medam French Mediterranean Coasts. Inventory and Impact of Reclamations from the Sea. In: Medam
French Mediterranean Coasts. Inventory and Impact of Reclamations from the Sea. 2014. Accessed 15 march 2015. Available:http://www.medam.org/
51. European Environment Agency. CORINE Land Cover 2006 [Internet]. 2006. Available:http://www.
statistiques.developpement-durable.gouv.fr/donnees-ligne/li/1825.html
52. Insee. Institut national de la statistique et des études économiques [Internet]. 2012. Available:http:// www.insee.fr/fr/default.asp
53. Andromede Oceanologie, RMC Agence de l’eau. Medtrix [Internet]. 2015. Available:www.medtrix.fr
54. Campagne CS, Salles J-M, Boissery P, Deter J. The seagrass Posidonia oceanica: ecosystem
ser-vices identification and economic evaluation of goods and benefits. Mar Pollut Bull. 2015; In press. doi: 10.1016/j.marpolbul.2015.05.061
55. Montefalcone M, Rovere A, Parravicini V, Albertelli G, Morri C, Bianchi CN. Evaluating change in
sea-grass meadows: A time-framed comparison of Side Scan Sonar maps. Aquat Bot. Elsevier B.V.; 2013; 104: 204–212. doi:10.1016/j.aquabot.2011.05.009
56. Martin CS, Giannoulaki M, De Leo F, Scardi M, Salomidi M, Knitweiss L, et al. Coralligenous and maërl
habitats: predictive modelling to identify their spatial distributions across the Mediterranean Sea. Sci Rep. 2014; 4: 1–8. doi:10.1038/srep05073
57. Musard O, Le Dû-blayo L, Francour P, Beurier J. Underwater seascapes. From geographical to
ecologi-cal perspectives. 1st ed. Springer; 2014.
58. Boström C, Pittman SJ, Simenstad C, Kneib RT. Seascape ecology of coastal biogenic habitats: Advances, gaps, and challenges. Mar Ecol Prog Ser. 2011; 427: 191–217. doi:10.3354/meps09051
59. Pittman SJ, Kneib RT, Simenstad CA. Practicing coastal seascape ecology. Mar Ecol Prog Ser. 2011; 427: 187–190. doi:10.3354/meps09139
60. Cheminée A, Feunteun E, Clerici S, Cousin B, Francour P. Management of infralittoral habitats. Towards a Seascape Scale Approach. In Musard O, Le Dû-blayo L, Francour P, Beurier J (Eds). Under-water seascapes. From geographical to ecological perspectives. 1st ed. Springer; 2014.
62. Coll M, Piroddi C, Albouy C, Ben Rais Lasram F, Cheung WWL, Christensen V, et al. The Mediterra-nean Sea under siege: Spatial overlap between marine biodiversity, cumulative threats and marine reserves. Glob Ecol Biogeogr. 2012; 21: 465–480. doi:10.1111/j.1466-8238.2011.00697.x
63. Halpern BS, Walbridge S, Selkoe KA, Kappel C V., Micheli F, D’Agrosa C, et al. A Global Map of Human Impact on Marine Ecosystems. Science (80-). 2008; 319: 948–952. doi:10.1126/science. 1149345
64. MarbàN, Díaz-Almela E, Duarte CM. Mediterranean seagrass (Posidonia oceanica) loss between 1842 and 2009. Biol Conserv. 2014; 176: 183–190. doi:10.1016/j.biocon.2014.05.024
65. Holon F, Delaruelle G, Descamp P, Boissery P, Deter J. Medtrix: a cartographic database concerning marine ecology and anthropogenic pressures along the Mediterranean coast. Proceedings of the Medi-terranean Symposium on marine key habitats, 2014. Available:http://www.rac-spa.org/sites/default/ files/symposium/proc_5_vegetation_final.pdf
66. Mouillot D, Albouy C, Guilhaumon F, Ben Rais Lasram F, Coll M, Devictor V, et al. Protected and threat-ened components of fish biodiversity in the mediterranean sea. Curr Biol. 2011; 21: 1044–1050. doi: 10.1016/j.cub.2011.05.005PMID:21658949
67. Tribot A-S. Diversité et perception de l’esthétisme du coralligène méditerranéen. Master thesis, Univer-sity of Montpellier. 2014.
68. Parc National des Calanques [Internet]. 2015. Available:www.calanques-parcnational.fr
69. Ministère de l'écologie et du Développement Durable et de l'Energie (MEDDE). Communiqué de presse du MEDDE du 27 juillet 2014 [Internet]. 2014. Available:http://www.aires-marines.fr/L-Agence/ Organisation/Missions-d-etude-de-parc/Cap- Corse/Documentation/Communique-et-dossier-de-presse-Segolene-ROYAL-ministre-de-l-Ecologie- installe-le-comite-de-pilotage-de-la-mission-d-etude-du-parc-naturel-marin-au-nord-d
70. Molenaar H, Meinesz A. Vegetative Reproduction in Posidonia oceanica: Survival and Development of Transplanted Cuttings According to Different Spacings, Arrangements and Substrates. Bot Mar. 1995;
71. Balestri E, Piazzi L, Cinelli F. Survival and growth of transplanted and natural seedlings of Posidonia
oceanica (L.) Delile in a damaged coastal area. J Exp Mar Bio Ecol. 1998; 228: 209–225. doi:10.1016/ S0022-0981(98)00027-6
72. Lotze HK, Coll M, Magera AM, Ward-Paige C, Airoldi L. Recovery of marine animal populations and
ecosystems. Trends Ecol Evol. Elsevier Ltd; 2011; 26: 595–605. doi:10.1016/j.tree.2011.07.008
73. Boissery P. Restauration du milieu marin méditerranéen, état des travaux en cours et perspectives. Rapp Agence l‘eau Rhône Méditerranée Corse. 2014; 2014. Available:http://www.eaurmc.fr/ fileadmin/documentation/brochures_d_information/Mer_Mediterranee/BAT_guide_restauration-WEB. pdf
74. Costanza R, d’Arge R, de Groot R, Farber S, Grasso M, Hannon B, et al. The value of the world’s eco-system services and natural capital. Nature. 1997; 387: 253–260. doi:10.1038/387253a0
75. Boudouresque CF, Bernard G, Pergent G, Shili A, Verlaque M. Regression of Mediterranean sea-grasses caused by natural processes and anthropogenic disturbances and stress: a critical review. Bot Mar. 2009; 52: 395–418. doi:10.1515/BOT.2009.057
76. Boudouresque CF, Bernard G, Bonhomme P, Charbonnel E, Diviacco G, Meinesz A, et al. Protection and conservation ofPosidonia oceanicameadows. RAC/SPA R and, editor. 2012. Available:http://
www.rac-spa.org/sites/default/files/doc_vegetation/ramoge_en.pdf
77. Bavestrello G, Cerrano C, Zanzi D, Cattaneo-Vietti R. Damage by fishing activities to the Gorgonian coralParamuricea clavatain the Ligurian Sea. Aquat Conserv Mar Freshw Ecosyst. 1997; 7: 253–262.
78. Frisch AJ, Cole AJ, Hobbs JP, Rizzari JR, Munkres KP. Effects of Spearfishing on Reef Fish Popula-tions in a Multi-Use Conservation Area. PLoS One. 2012; 7. doi:10.1371/journal.pone.0051938
79. Rocklin D, Levrel H, Drogou M, Herfaut J, Veron G. Combining telephone surveys and fishing catches self-report: The French sea bass recreational fishery assessment. PLoS One. 2014; 9. doi:10.1371/ journal.pone.0087271
80. Deter J, Descamp P, Ballesta L, Boissery P, Holon F. A preliminary study toward an index based on coralligenous assemblages for the ecological status assessment of Mediterranean French coastal waters. Ecol Indic. Elsevier Ltd; 2012; 20: 345–352. doi:10.1016/j.ecolind.2012.03.001
81. Gobert S, Sartoretto S, Rico-Raimondino V, Andral B, Chery A, Lejeune P, et al. Assessment of the ecological status of Mediterranean French coastal waters as required by the Water Framework Direc-tive using the Posidonia oceanica. Mar Pollut Bull. 2009; 58: 1727–1733. doi:10.1016/j.marpolbul. 2009.06.012PMID:19700176