Original Article
http://doi.org/10.1590/2317-6431-2016-1832
Audiol Commun Res. 2017;22:e1832 1 | 4
ISSN 2317-6431
Auditory steady-state evoked potentials at carrier
frequencies above 4000 Hz
Potencial evocado auditivo de estado estável em frequências
portadoras acima de 4000 Hz
Aline Tenório Lins Carnaúba1, Pedro de Lemos Menezes2, Ilka do Amaral Soares2, Kelly Cristina Lira de
Andrade1, Otávio Gomes Lins3
ABSTRACT
Introduction: The auditory steady-state evoked potentials (ASSEPs) has been identified as a promising technique for assessing hearing in patients who do not cooperate spontaneously in determining auditory thresholds. Although studies report decreased performance at carrier frequencies above 4000 Hz , technical advancements to determine its clinical utility is necessary because the use of these frequencies can contribute to a better audiological diagnosis. Purpose: Aimed to analyze the general auditory steady-state response at carrier frequencies above 4000Hz. Methods: Evaluation of ASSEPs combined and isolated at the intensities of 50 SLPpe and 80 SLPpe at the carrier frequencies 6000 Hz to 8000 Hz, with the signal acquisition and analysis system MASTER. Results: Analysis of variance (two-way ANOVA), which found decreased amplitudes when related to the intensity and the stimulus conditions. Conclusion: It was possible to evaluate the carrier frequencies 6000 Hz and 8000 Hz, either alone or combined. There were no interactions between the carrier frequencies 6000 Hz to 8000 Hz in both forms of presentation (combined and isolated) and intensity, for the sample.
Keywords: Auditory evoked potentials; Hearing; Audiometry
RESUMO
Introdução: O potencial evocado auditivo de estado estável (PEAEE) tem sido apontado como uma técnica promissora para avaliar a audição de pacientes que não cooperam espontaneamente na determinação dos limiares auditivo. Embora estudos relatem desempenho diminuído nas frequências portadoras acima de 4000 Hz, são necessários avanços técnicos para determinar a sua utilidade clínica, pois o uso dessas frequências pode contribuir para um melhor diagnóstico audiológico.
Objetivo: Analisar os potenciais evocados auditivos de estado estável, em frequências portadoras acima de 4000 Hz. Métodos: A avaliação dos PEAEE foi realizada de forma isolada e combinada, nas intensidades de 50 dBNPSpe e 80 dBNPSpe, nas frequências portadoras de 6000 e 8000 Hz, com o sistema de aquisição e análise MASTER. Resultados: Foi realizada análise de variância (ANOVA two-way), em que se encontrou diminuição das amplitudes, quando relacionadas às intensidades e às condições do estímulo. Conclusão: Foi possível avaliar as frequências portadoras de 6000 e 8000 Hz, tanto de forma isolada, quanto combinada. Não houve interações entre as frequências portadoras de 6000 Hz e 8000 Hz, quanto à forma de apresentação (combinada e isolada) e intensidade, para a amostra estudada.
Palavras-chave: Potenciais evocados auditivos; Audição; Audiometria
Study conducted at the Laboratory of Hearing and Technology (LATEC), Universidade Estadual de Ciências da Saúde de Alagoas – UNCISAL – Maceió (AL), Brazil. (1) Post-graduate Program (Doctorate) in Biotechnology in Health, Northeast Network of Biotechnology (RENORBIO), Universidade Federal de Alagoas – UFAL – Maceió (AL), Brazil.
(2) Universidade Estadual de Ciências da Saúde de Alagoas – UNCISAL – Maceió (AL), Brazil. (3) Universidade Federal de Pernambuco – UFPE – Recife (PE), Brazil.
Conflict of interests: No
Authors’ contribution: ATLC main researcher, study conception and design, scheduling, literature survey, data collection and analysis, drafting of the article, and submission of the version to be published; PLM advisor, study conception and design, data analysis, scheduling, editing, and final approval; IAS advisor, study conception and design, scheduling, data analysis, editing, and final approval; KCLA assistant researcher, literature survey, data collection and drafting of the article; OGL advisor, study conception and design, scheduling, data analysis, editing, and final approval.
Corresponding author: Aline Tenório Lins Carnaúba. E-mail: [email protected]
Carnaúba ATL, Menezes PL, Soares IA, Andrade KCL, Lins OG
Audiol Commun Res. 2017;22:e1832 2 | 4
INTRODUCTION
Assessment of auditory steady-state evoked potentials (ASSEPs) is widely indicated as a tool to determine electro-physiological thresholds, allowing the objective detection of responses, using statistical analysis. With modulation frequen-cies of 80 Hz or more, ASSEP proved to be a reliable method to estimate electrophysiological thresholds(1,2).
However, there is still no consensus regarding the clinical diagnostic protocols used. Furthermore, reports of conducting ASSEPs with carrier frequencies above 4000 Hz are scarce. Studies have reported a decline in amplitude and performance in determining electrophysiological thresholds when carrier frequencies below 500 Hz(3)and above 4000 Hz(4) were used.
Previous research has suggested a qualitative model of carrier frequencies following the U pattern, possibly reflected on the minimum auditory curve. For this operational model, a decrease in amplitude and accuracy in determining thresholds was observed when the carrier frequency declined or rose beyond the ideal range (500 Hz to 4000 Hz), that is, towards audiometric extremes(3,4,5,6,7).
To better define the operational model, this study assessed carrier frequencies above 4000 Hz, determining whether or not there is a systematic difference in ASSEP accuracy and amplitude.
As such, to standardize results, the technique needs proto-cols that can be reproduced in clinical populations. The primary aim of this study was to analyze auditory steady-state evoked potentials at carrier frequencies above 4000 Hz. The specific objective was to determine whether there is a relationship be-tween carrier frequencies of 6000 Hz and 8000 Hz in terms of the form of presentation (combined and separate) and intensity.
METHODS
This cross-sectional, prospective, organizational and analytical study was approved by the Research Ethics Committee of the Universidade Federal de Pernambuco, un-der protocol number 165.922. All the participants gave their informed consent.
The sample included ten individuals (20 ears), selected ac-cording to the following inclusion criteria: age between 18 and 45 years and auditory thresholds less than or equal to 20 dBNA, with differences in frequencies between ears less than or equal to 10 dB. Excluded were those who were exposed to occupa-tional or leisure noise, had undergone middle and/or inner ear surgery, suffered from more than three middle ear infections, used ototoxic drugs, exhibited hormonal alterations, ringing in the ears, vertigo, dizziness or other cochleovestibular disorders.
Participants were initially screened by completing a medical history and auditory function questionnaire. Next, the follow-ing procedures were applied: otoscopy, pure-tone threshold audiometry and steady-state auditory evoked potentials.
The ASSEP examination was applied using the Multiple Auditory Steady-State Response (MASTER®) technique. The electrode region was prepared with 70% alcohol and abrasive paste (Nuprep®) was used for exfoliation. Next, disposable electrodes (3M®) were placed on the right clavicle (ground elec-trode) at Cz (active elecelec-trode) and below the hairline (reference electrode). Assessments were conducted only when impedance between electrodes connected to the skin was less than 5kΩ.
The volunteers were comfortably seated in a reclinable chair, in dorsal decubitus, to allow adequate muscle relaxation. They kept their eyes closed during the examination and were not sedated.
Up to 32 scans were averaged to obtain a value of p<0.05. When the expected significance level was reached, it was confirmed in at least two subsequent stimuli. The automatic rejection of outliers was established at 40nV and collection was interrupted when a high rate of stimuli was rejected.
We used a pure tone, at a frequency of 6000 and 8000 Hz, and modulated at a range between 80 Hz and 85 Hz. The stimuli were presented continuously through TDH 39 P audiometric earphones.
Carrier frequencies of 6000 Hz and 8000 Hz were assessed separately (binaural stimulation of a single frequency) and in combination (simultaneous and binaural stimulation of multiple frequencies - 6000 Hz + 8000 Hz), at intensities of 50 SLPpe and 80 SLPpe.
To interpret the findings, we considered the presence of a response to statistical identification of the spectral peak, at the modulation frequency of carrier stimulation, with the amplitude statistically higher than that of background noise on the Fast Fourier Transform (FFT). Significance was calculated using T2 and F statistical tests, conducted by the MASTER system.
Statistical method
The data were tabulated and processed by Predictive Analytics Software 22.0 (PASW® STATISTIC). Data were described as a tabular and graphical representation of the means, standard deviations and percentiles.
To determine the interaction between carrier frequencies of 6000 Hz and 8000 Hz, in terms of stimulation (separate or combined), amplitudes were evaluated using analysis of variance (two-way ANOVA).The values were considered significant forp≤0.05.
RESULTS
Ten patients (20 ears) of both sexes, aged 27.3±2.26 years, were assessed. All the subjects exhibited ASSEP at the fre-quencies investigated.
Auditory steady-state evoked potentials
Audiol Commun Res. 2017;22:e1832 3 | 4
amplitudes by frequency, intensity and condition is demons-trated in Figure 3.
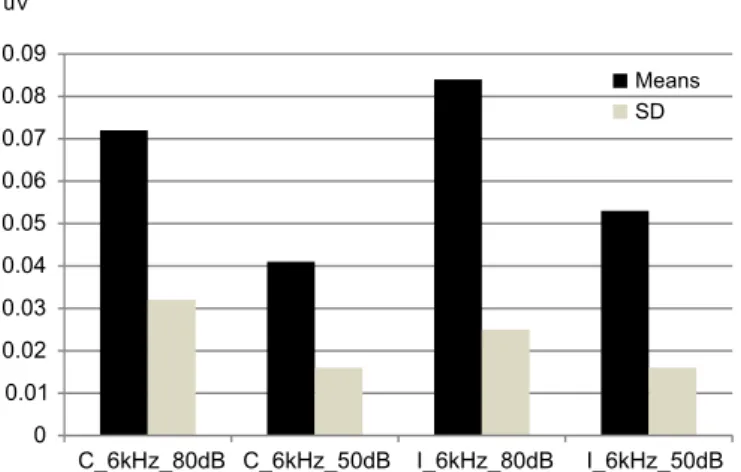
There was a slight difference in response amplitudes in re-lation to intensity and stimure-lation, but there were no significant effects or interactions involving the frequencies.
DISCUSSION
ASSEPs can be recorded separately (a single stimulus is presented to one or both ears) or in combination (two or more stimuli are presented to one or both ears). Although clinical data for the combined presentation are more limited(8,9,10), they
can potentially provide more information over a short period of time, thereby accelerating test time(11,12,13). If there are no
interactions between responses when several stimuli are pre-sented, the time to obtain them is reduced by the number of stimuli presented simultaneously(14). Even if there is a reduction
in amplitude (interactions), combined, rather than separate presentation may still be more effective.
Authors report that ASSEP amplitudes are lower due to interactions and that more scans should be averaged to detect these responses(13,14), which was not done in the present study.
Despite the slight decline in amplitudes, when a combined presentation was used, there were no interactions (based on the ANOVA test) or increase in the number of scans.
Research has shown that combined presentation in adults does not cause a decrease in amplitude when the stimuli are presented at 60 dB NPS or lower, in one or both ears, provi-ded that the carrier frequencies are separated by at least one octave(11,12,15).
The present study demonstrated that it is not necessary to establish one octave between carrier frequencies to obtain ASSEPs, and that there is no statistical difference in response amplitude. However, some studies report that significant inte-ractions occur between responses for 75-80 dB NPS, such that the amplitudes at the combined presentation decrease to 52-58 % when the stimulus is presented separately(11,16,17).This was not
observed in the present study, since the amplitudes remained unchanged, for both the separate and combined presentations.
The study of carrier frequencies of 6000 Hz and 8000 Hz was an innovative aspect for the national literature, since it demonstrated the viability of assessing frequencies, both se-parately and in combination, without the need to be separated by one octave. These measures are potentially interesting for a more detailed investigation of electrophysiological thresholds.
CONCLUSION
It was possible to assess carrier frequencies of 6000 Hz and 8000 Hz, both separately and in combination. There were no significant interactions between carrier frequencies of 6000 Hz and 8000 Hz for the sample studied, only a decline in amplitude when they were presented in combination.
REFERENCES
1. Ishida IM, Stapells DR. Multiple-ASSR interactions in adults with sensorineural hearing loss. Int J Otolaryngol. 2012;2012:ID802715. https://doi.org/10.1155/2012/802715
Figure 3. Ratio of amplitudes by frequency, intensity and condition
Subtitle: C = condition combined; I = condition isolated; SD = standard deviation
Figure 2. Means and standard deviation of amplitudes by intensity and condition (isolated or combined) at the frequency of 8000 Hz
Subtitle: C = condition combined; I = condition isolated; SD = standard deviation
Carnaúba ATL, Menezes PL, Soares IA, Andrade KCL, Lins OG
Audiol Commun Res. 2017;22:e1832 4 | 4
2. Korczak P, Smart J, Delgado R, Strobel TM, Bradford C. Auditory steady-state responses. J Am AcadAudiol. 2012;23(3):146-70. https://doi.org/10.3766/jaaa.23.3.3
3. Kaf WA, Durrant JD, Sabo DlL, Boston JR, Taubman LB, Kovacyk K. Validity and accuracy of electric response audiometry using the auditory steady-state response: Evaluation inan empirical design. Int J Audiol. 2006;45(4):211-23. https://doi. org/10.1080/14992020500377907
4. Petitot C, Colet L, Durrant JD. Auditory steady-state responses (ASSR): effects of modulation and carrier frequencies. Int J Audiol. 2005;44(10):567-73. https://doi.org/10.1080/14992020500258560 5. Tlumak AI, Durrant JD, Collet L. 80 Hz auditory steady-state
responses (ASSR) at 250 Hz and 12000 Hz. Int J Audiol. 2005;46(1):26-30. https://doi.org/10.1080/14992020601078008 6. Dimitrijevic A, John MS, Van Roon P, Picton TW. Human auditory
steady state responses to tones independently modulated in both frequency and amplitude. Ear Hear. 2001;22(2):100-11.
7. Ross B, Borgmann C, Draganova R, Roberts LE, Pantev C. A high-precision magnetoencephalographic study of human auditory steady-state responses to amplitude modulated tones. J AcoustSoc Am. 2000;108(2):679-91.https://doi.org/10.1121/1.429600
8. Stapells DR. Frequency-specific threshold assessment in young infants using the transient ABR and the brainstem ASSR. In: Seewald RC, Tharpe AM. Comprehensive handbook of pediatric audiology. San Diego: Plural; 2011. p 409-48.
9. Tlumak I, Rubinstein E, Durrant JD. Meta-analysis of variables that affect accuracy of threshold estimation via measurement of the auditory steady-state response (ASSR).Int J Audiol. 2007;46(11):692-710.https://doi.org/10.1080/14992020701482480
10. Cone B, Dimitrijevic A. The auditory steady-state response. In: Katz J, Medwetsky L, Burkard R, Hood L. Handbook of clinical audiology. Baltimore:Lippingcott,Williams&Wilkins; 2009. p. 322-50.
11. John MS, Lins OG, Boucher BL, Picton TW. Multiple auditory steady-state responses (MASTER): stimulus and recording parameters. Audiol. 1998;37(2):59-82.
12. Herdman T, StapellsDR.Thresholds determined using the monotic and dichotic multiple auditory steady-state response technique in normal-hearing subjects. ScandAudiol. 2001;30(1):41-9.https://doi. org/10.1080/010503901750069563
13. John MS, Purcell DW, Dimitrijevic A, Picton TW. Advantages and caveats when recording steady-state responses to multiple simultaneous stimuli. J AmAcadAudiol. 2002;13(5):246-59. 14. Picton TW, John MS, Dimitrijevic A, Purcell DW. Human auditory
steady-state responses. Int J Audiol. 2003;42(4):177-219.https://doi. org/10.3109/14992020309101316
15. Lins OG, Picton TW. Auditory steady-state responses to multiple simultaneous stimuli. ElectroenClin Neuro. 1995;96(5):420-32. https://doi.org/10.1016/0168-5597(95)00048-W
16. Wood LL. Multiple brainstem auditory steady-state response interactions for different stimuli [thesis]. Vancouver: The University of British Columbia; 2009.