Radiol Bras. 2016 Nov/Dez;49(6):351–357 351
Quantitative computed tomography analysis of the airways
in patients with cystic fibrosis using automated software:
correlation with spirometry in the evaluation of severity
*
Análise quantitativa por tomografia computadorizada das vias aéreas, usando programa automático, em pacientes com fibrose cística: avaliação da gravidade em correlação com a espirometria
Koenigkam-Santos M, Cruvinel DL, Menezes MB, Teixeira SR, Vianna EO, Elias Júnior J, Martinez JAB. Quantitative computed tomography analysis of the airways in patients with cystic fibrosis using automated software: correlation with spirometry in the evaluation of severity. Radiol Bras. 2016 Nov/Dez: 351–357.
Abstract
R e s u m o
Objective: To perform a quantitative analysis of the airways using automated software, in computed tomography images of patients with cystic fibrosis, correlating the results with spirometric findings.
Materials and Methods: Thirty-four patients with cystic fibrosis were studied—20 males and 14 females; mean age 18 ± 9 years— divided into two groups according to the spirometry findings: group I (n = 21), without severe airflow obstruction (forced expiratory volume in first second [FEV1] > 50% predicted), and group II (n = 13), with severe obstruction (FEV1 ≤ 50% predicted). The following tracheobronchial tree parameters were obtained automatically: bronchial diameter, area, thickness, and wall attenuation.
Results: On average, 52 bronchi per patient were studied. The number of bronchi analyzed was higher in group II. The correlation with spirometry findings, especially between the relative wall thickness of third to eighth bronchial generation and predicted FEV1, was better in group I.
Conclusion: Quantitative analysis of the airways by computed tomography can be useful for assessing disease severity in cystic fibrosis patients. In patients with severe airflow obstruction, the number of bronchi studied by the method is higher, indicating more bronchiectasis. In patients without severe obstruction, the relative bronchial wall thickness showed a good correlation with the predicted FEV1.
Keywords: Cystic fibrosis; Tomography, X-ray computed; Airway remodeling/physiology.
Objetivo: Realizar a análise quantitativa das vias aéreas utilizando programa automático, em imagens de tomografia computadorizada de pacientes com fibrose cística, correlacionando com a espirometria.
Materiais e Métodos: Foram estudados 34 pacientes com fibrose cística – 20 masculinos e 14 femininos; idade de 18 ± 9 anos –, divididos em dois grupos segundo a espirometria: grupo I (n = 21) – sem obstrução grave ao fluxo aéreo (volume expiratório forçado no primeiro segundo [VEF1] > 50% previsto); grupo II (n = 13) – com obstrução grave (VEF1 ≤ 50% previsto). Foram automaticamente obtidos: diâmetro, área, espessura e atenuação da parede da árvore traqueobrônquica.
Resultados: Na média, foram estudados 52 brônquios por paciente. O número de brônquios analisados foi maior no grupo II. A corre-lação com a espirometria foi melhor no grupo I, principalmente entre a espessura relativa da parede da terceira a oitava geração brôn-quica e o VEF1 previsto.
Conclusão: A análise quantitativa das vias aéreas em imagens de tomografia computadorizada pode ser útil na avaliação da gravidade da doença na fibrose cística. Nos pacientes com obstrução grave ao fluxo aéreo, o número de brônquios estudados pelo método é maior, indicando mais bronquiectasias. Nos pacientes sem obstrução grave, a espessura relativa da parede dos brônquios tem boa correlação com o VEF1 previsto.
Unitermos: Fibrose cística; Tomografia computadorizada; Análise quantitativa.
* Study conducted at the Hospital das Clínicas da Faculdade de Medicina de Ribeirão Preto da Universidade de São Paulo (HCFMRP-USP), Ribeirão Preto, SP, Brazil.
1. PhD, MD, Radiologist, Collaborating Professor at the Center for Imaging Sci-ences and Medical Physics of the Hospital das Clínicas da Faculdade de Medicina de Ribeirão Preto da Universidade de São Paulo (HCFMRP-USP), Ribeirão Preto, SP, Brazil.
2. MD, Radiology Specialist at the Center for Imaging Sciences and Medical Phys-ics of the Hospital das Clínicas da Faculdade de Medicina de Ribeirão Preto da Universidade de São Paulo (HCFMRP-USP), Ribeirão Preto, SP, Brazil.
3. PhD, MD, Attending Pulmonologist in the Pulmonology Sector of the Depart-ment of Clinical Medicine of the Faculdade de Medicina de Ribeirão Preto da Universidade de São Paulo (FMRP-USP), Ribeirão Preto, SP, Brazil.
4. PhD, MD, Attending Radiologist at the Center for Imaging Sciences and Medical
Marcel Koenigkam Santos1, Danilo Lemos Cruvinel2, Marcelo Bezerra de Menezes3, Sara Reis Teixeira4,
Elcio de Oliveira Vianna5, Jorge Elias Júnior6, José Antonio Baddini Martinez5
Physics of the Hospital das Clínicas da Faculdade de Medicina de Ribeirão Preto da Universidade de São Paulo (HCFMRP-USP), Ribeirão Preto, SP, Brazil.
5. PhD, MD, Pulmonologist, Professor in the Pulmonology Sector of the Depart-ment of Clinical Medicine of the Faculdade de Medicina de Ribeirão Preto da Universidade de São Paulo (FMRP-USP), Ribeirão Preto, SP, Brazil.
6. PhD, MD, Radiologist, Professor at the Center for Imaging Sciences and Medi-cal Physics of the Hospital das Clínicas da Faculdade de Medicina de Ribeirão Preto da Universidade de São Paulo (HCFMRP-USP), Ribeirão Preto, SP, Brazil.
Mailing address: Dr. Marcel Koenigkam Santos. Centro de Ciências das Imagens e Física Médica do Hospital das Clínicas da Faculdade de Medicina de Ribeirão Preto da Universidade de São Paulo. Avenida Bandeirantes, 3900, Campus Uni-versitário Monte Alegre. Ribeirão Preto, SP, Brazil, 14049-900. E-mail: marcelk46@ yahoo.com.br.
INTRODUCTION
Cystic fibrosis (CF) is a chronic autosomal recessive dis-ease that affects the epithelial cells of multiple organs, espe-cially the respiratory tract and exocrine pancreas, and is the leading cause of death from inherited disease in white popu-lations. Multiple genetic mutations have been associated with this disease, which in the lungs result in deficient chloride secretion and increased absorption of sodium by airway epi-thelial cells. Patients with CF present with secretions of greater viscosity, with impaired mucociliary clearance, chronic obstruction, and persistent, recurrent bacterial in-fections, factors that lead to a bronchopulmonary disease with high morbidity and mortality. Chronic inflammation of the airways leads to deformity and dilation of the bron-chi, together with thickening of the bronchial wall. The re-sulting bronchiectasis, in turn, predisposes to chronic bacte-rial infection, creating a vicious cycle of tissue damage(1–3). Although there is still no cure, improvements in the treat-ment of patients with CF have led to a significant increase in life expectancy, which is now approximately 40 years in most developed countries(4).
Imaging tests play a very important role not only in di-agnosis but also in the clinical follow-up of CF-related bron-chopulmonary disease and are used in assessing the severity of the disease, characterizing its regional distribution, and detecting complications (infectious and noninfectious), as well as for monitoring the response to treatment. Currently, high-resolution multidetector computed tomography (MDCT) is considered the best imaging method for the morphologi-cal characterization of bronchial and pulmonary changes, being able to evaluate distal airways and with better accu-racy than that of plain radiography and magnetic resonance imaging(5,6). MDCT has been even suggested as a valid method for the characterization of outcomes in clinical tri-als and therapeutic interventions(7,8).
The main features of CF on CT scans are bronchial dilation and deformity (bronchiectasis), bronchial wall thick-ening, accumulation of secretion (mucoid impaction and small airway opacities), atelectasis, and changes in pulmo-nary attenuation secondary to bronchial obstruction and hy-povolemia(8). Although various visual grading systems (scores) for imaging tests have been described to monitor the disease more objectively, such systems have been little used in clinical practice, mainly due to the complexity of their application(9). Pulmonary function tests, especially spirometry, are used in the clinical follow-up of patients with CF. Regardless of the disease pattern (obstructive or restric-tive), forced expiratory volume in first second (FEV1) is con-sidered the most important parameter, representing a prog-nostic marker and predictor of mortality(10). However, we know that pulmonary function tests are not sensitive to early changes in the airways and lung parenchyma, as well as be-ing unable to show regional and compartmentalized distri-bution of the disease, characteristics that can have implica-tions in targeted therapies(11).
In view of the therapeutic improvement and survival gain of patients with CF, resulting in a prolonged period of se-rial follow-up, it is necessary to find parameters that are re-liable and reproducible; that is, quantitative and objective for proper assessment of disease severity and treatment re-sponse. Recent studies have demonstrated that quantitative analysis of the airways on MDCT images using dedicated software is able to identify CF-related morphological changes that correlate well with functional parameters(12,13).
The aim of this study was to quantitatively assess mor-phological changes in airways on MDCT scans, using a com-puter program with fully automated analysis capabilities in a population of patients with CF being followed clinically at our hospital, correlating the results with those of spirometry.
MATERIALS AND METHODS Patients
This study was approved by the local research ethics com-mittee. Because this was a retrospective study based on tests already carried out in patients in whom those tests were clini-cally indicated for the monitoring/assessment of CF, a waiver of informed consent was granted.
We retrospectively analyzed the electronic medical records and MDCT scans of patients (children and adults) with CF who were followed clinically at our referral hospi-tal. Spirometry and CT were ordered as part of the routine clinical evaluation of these patients, so that there was no record of the investigation of acute exacerbation, infection, or suspicion of other acute complications. We analyzed the records of patients with symptoms and signs typical of CF, a family history of the disease, and diagnostic confirmation (mainly by determination of sweat chloride levels). We in-cluded consecutive patients whose spirometry and MDCT scans had been performed at our facility, in the same devices, within a four-week period. We excluded cases in which the spirometry or CT examinations were of poor technical qual-ity, considered inadequate for diagnosis and analysis. Most spirometry tests were performed with a KoKo spirometer (PDS Instrumentation, Inc., Louisville, CO, USA), although a Vitatrace VT 130 spirometer (Pró Médico Ltda., Rio de Janeiro, Brazil) was employed in six cases (all children). The performance of the tests and characteristics of the apparatus were in accordance with the American Thoracic Society stan-dards for spirometry.
Patients were divided into two groups according to the presence or absence of severe airflow obstruction(14), based on the measurement of FEV1 as a percentage of the predicted value (FEV1%) obtained in spirometry after bronchodilator use: group I—patients without severe airflow obstruction (FEV1% > 50); and group II—patients with severe airflow obstruction (FEV1% ≤ 50).
Chest CT
underwent high-resolution CT without intravenous admin-istration of iodinated contrast, scanning across the chest in the caudocranial direction, with volumetric acquisition of 1-mm slices at full inspiration. Other typical parameters of acquisition were a tube voltage of 120 kVp; a reference tube current of 110–130 mAs; a gantry rotation time of 0.3–0.7 s; and an ideal exposure to radiation of < 5 mSv. Volumet-ric acquisitions were reconstructed with a soft/standard fil-ter and with a hard filfil-ter, with 1-mm slices and a 1-mm re-construction interval.
Obtaining airway measurements
Quantitative analysis of the airways on CT images was performed using the Yacta program, version 2.0(15), installed on a computer in the image processing lab of our depart-ment and connected to the network servers of the hospital. Therefore, the images are sent directly from the scanner to be analyzed by the program.
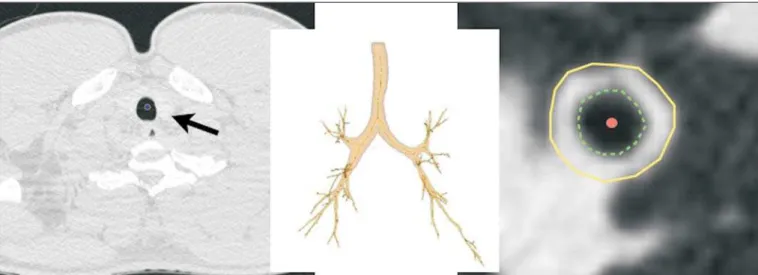
The Yacta program works automatically, not requiring the intervention of a user at any stage of the process. Image analysis takes 4–9 minutes after submission for processing. Initially, Yacta segments (i.e., anatomically separates) the airways, the right lung, the left lung, and the lung lobes, based on a computerized algorithm for the recognition of struc-tures, densities, and anatomical thresholds. A center line is calculated, within the airway, from the trachea to the distal bronchi and is used as a reference for measurements in the true transverse plane of the bronchus (perpendicular to the line axis). After the transverse plane of the bronchus has been identified, different algorithms can be used for recognition of inner and outer borders, as well as to calculate the caliber and wall thickness of the bronchus, the most widely used being the full-width-at-half-maximum determination and the inte-gral-based method. In this study we used the inteinte-gral-based method (Figure 1), which has been shown to be more reli-able for anatomical measurements(13,15).
The following measurements of the airways were ob-tained: the number of bronchi analyzed; the overall airway diameter (distance between the outer borders of the bron-chus, in mm); area of the lumen (area between the inner borders, in mm2
); wall thickness (distance between the in-ner and outer edges, in mm); relative wall thickness (RWT) of the bronchus (ratio of wall thickness to overall diameter, in %); RWT of the third to eighth bronchial generation (RWT3–8); and maximum attenuation of the bronchial wall (maximum density points between the inner and outer edge, in Hounsfield units). All of these measures are obtained for
n bronchi of the segmented tracheobronchial tree, and the program calculates an average for the entire tree, although it also identifies the values according to the order of bron-chial generation.
Statistical analysis
All data were organized and analyzed on a personal com-puter with a spreadsheet program (Microsoft Excel 2011) and a statistical analysis program (GraphPad Prism 5.0). The Shapiro-Wilk test was used in order to verify the normal distribution of the variables. We used unpaired t-tests to compare the data between groups I and II, at a significance level of 95% (p < 0.05). Correlations between airway mea-sures and spirometric parameters were assessed with Pearson’s correlation coefficient.
RESULTS
We evaluated 34 patients with CF (14 females and 20 males), with a mean age of 18 ± 9 years (range, 7–43 years). Group I comprised 21 patients, and group II comprised 13 patients. The mean age of the patients was significantly lower in group I than in group II (14.3 ± 6 versus 23.9 ± 10.5 years). Table 1 summarizes the spirometry results. Groups I and II showed significant differences in pulmonary function mea-sures, including FEV1, FEV1%, forced vital capacity (FVC,
Table 1—Spirometry results of CF patients.
All patients Group I Group II
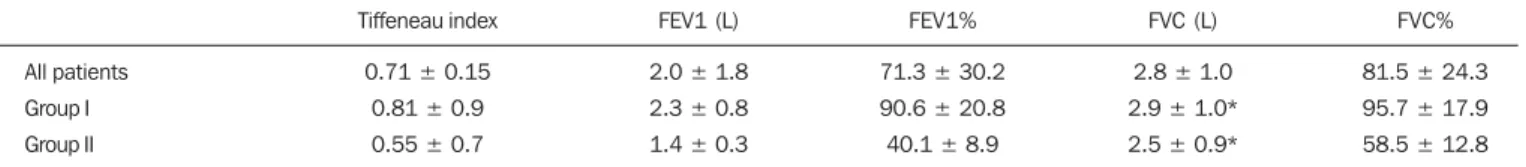
Tiffeneau index
0.71 ± 0.15 0.81 ± 0.9 0.55 ± 0.7
FEV1 (L)
2.0 ± 1.8 2.3 ± 0.8 1.4 ± 0.3
FEV1%
71.3 ± 30.2 90.6 ± 20.8 40.1 ± 8.9
FVC (L)
2.8 ± 1.0 2.9 ± 1.0* 2.5 ± 0.9*
FVC%
81.5 ± 24.3 95.7 ± 17.9 58.5 ± 12.8
FEV1, forced expiratory volume in first second; FEV1%, FEV1 in percentage of predicted; FVC, forced vital capacity; FVC%, FVC in percentage of predicted; Tiffeneau index, FEV1/FVC.
* Only the values of FVC did not differ significantly different between groups I and II (p = 0.25).
Figure 2. Examples of two CF pa-tients, one from group I (A, FEV1% = 69.6) and another from group II (B, FEV1% = 34.5). Coronal CT scans with a lung window show greater bron-chiectasis in the group II patient. The three-dimensional figures representing the automated bronchial segmentation illustrate that the number of bronchi found and analyzed was greater in the group II patient than in the group I pa-tient (91 vs. 49).
in liters) and as a percentage of the predicted value), and the Tiffeneau index (FEV1/FVC ratio). Only FVC values did not differ significantly between groups I and II (p = 0.25). The Yacta program was able to segment and analyze the scans of all 34 patients included in the study, obtaining quan-titative airway measures. On average, we studied 52 bronchi per patient. Considering all patients, we found that the mean overall diameter of the bronchi was 7.8 mm, the mean bron-chial wall thickness was 2.2 mm, and the RWT was 83% (RWT3–8 of 85%). Table 2 summarizes the CT-acquired airway measurements after automated analysis. When
com-paring groups I and II, we found that the only variable show-ing a statistical difference between groups was the number of bronchi evaluated (Figure 2), which was higher in group II (p < 0.01).
coefficient. Observing correlation coefficient values between the groups, we noted a trend toward better correlation of mea-sures in group I. Table 3 shows the Pearson’s correlation coefficients for the two groups with respect to FEV1%.
DISCUSSION
We studied a sample of 34 patients diagnosed with CF who had undergone MDCT and spirometry at our hospital, using a fully automated quantitative analysis program to mea-sure airways in high-resolution CT images of the chest. The program was able to analyze a large number of bronchi in all of the patients studied and to identify changes related to CF. In patients with severe airflow obstruction, a greater
number of bronchi were evaluated, reflecting greater bron-chiectasis in these patients. In patients without severe air-flow obstruction, we found a good correlation between RWT3–8 and FEV1%.
The technological evolution of CT equipment, with the development of the multidetector technique, has made it pos-sible to achieve high-resolution volumetric acquisition of images of the entire chest during a single breath-hold. The current image quality allows detailed assessment of the morphology of the lung parenchyma and airways down to the subsegmental level(16). In the assessment of bronchopul-monary diseases, many studies have demonstrated that CT is superior to other diagnostic tools in that it is able to iden-tify changes earlier, being more sensitive in detecting subtle changes, and allows the regional/compartmental assessment of the disease(17). In CF, for example, it has been demon-strated that CT is able to detect progression of bronchopul-monary changes in patients without significant changes in the parameters of pulmonary function tests(18).
Compared with the traditional qualitative analysis of im-aging tests, quantitative evaluation is more objective, less dependent on the reader/evaluator, and has better reproduc-ibility. Primarily in the study of chronic obstructive pulmo-nary disease and asthma, the quantitative analysis of CT scans, done automatically or semi-automatically, has shown good accuracy and good correlation with functional tests(19– 22). In attempts to standardize imaging evaluation of CF,
various visual grading systems (scores) have been devised for use in plain radiography, CT, and MRI. However, those systems have been little used in clinical practice, mainly due to the complexity of their application and the differences among them(23). Recent studies have demonstrated that quantitative analysis of the airways is also able to detect changes in CF(12,13).
In the present study, we evaluated MDCT images ob-tained for 34 patients with CF. The program used was able to segment and perform a fully automated analysis of the airways in all cases, evaluating an average of 52 bronchi per patient. Although the first studies of quantitative analyses of the airways described the measurements in one or only a few bronchi, performed manually or semiautomatically(24), au-tomated evaluation of a large number of bronchi, as per-formed in the present study, allows a more accurate and re-producible analysis of airway disease, considering the lobar and segmental distribution of the disease and the different bronchial generations.
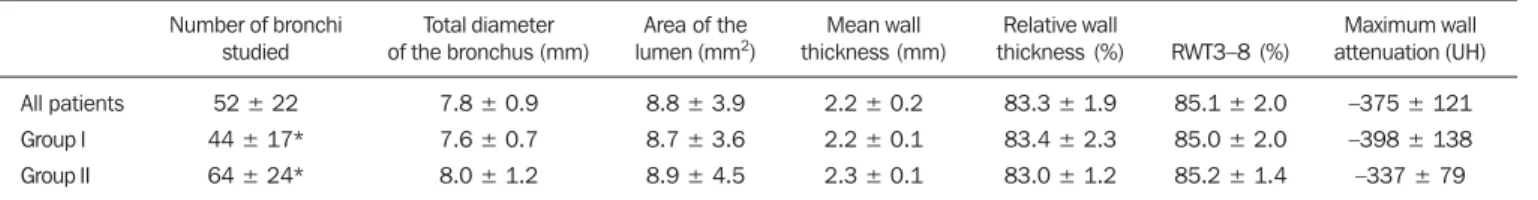
Table 2—Results of the quantitative analysis of airways on MDCT images of CF patients.
All patients Group I Group II
Number of bronchi studied
52 ± 22 44 ± 17* 64 ± 24*
Total diameter of the bronchus (mm)
7.8 ± 0.9 7.6 ± 0.7 8.0 ± 1.2
Area of the lumen (mm2)
8.8 ± 3.9 8.7 ± 3.6 8.9 ± 4.5
Mean wall thickness (mm)
2.2 ± 0.2 2.2 ± 0.1 2.3 ± 0.1
Relative wall thickness (%)
83.3 ± 1.9 83.4 ± 2.3 83.0 ± 1.2
RWT3–8 (%)
85.1 ± 2.0 85.0 ± 2.0 85.2 ± 1.4
Maximum wall attenuation (UH)
–375 ± 121 –398 ± 138 –337 ± 79
RWT3–8, relative wall thickness of the third to eighth bronchial generation.
* The only variable that showed statistically significant differences between groups I and II was the number of bronchi studied (p < 0.01).
Table 3—Correlation coefficients for comparisons between MDCT-acquired quan-titative measurements of the airways and FEV1%.
Measure
Number of bronchi Overall diameter Area of the lumen Wall thickness Relative wall thickness
Relative wall thickness of the third to eight generation Maximum wall attenuation
Group I
–0.35 –0.03 –0.06 –0.25 –0.27 –0.62*
–0.23 Group II
0.12 0.05 –0.16 0.16 0.22 0.29 0.21 Correlation coefficient
* The correlation between RWT3–8 and FEV1% was stronger in group I than in group II, and the difference between the two groups was statistically significant (p
< 0.01).
Figure 3. Graphic illustrating the correlation between the RWT3–8 measured by CT and the FEV1% in group I patients (R = –0.62; p < 0.01).
FEV1%
R
W
T
3
The caliber and wall thickness of bronchi diminish pro-gressively along the tracheobronchial tree, from the main bronchi toward the peripheral bronchioles; that is, the higher the order of bronchial generation is, the smaller is the bron-chial caliber and the greater is the thickness of the airway. The normal bronchial wall thickness is 0.2–0.3 mm for subsegmental bronchi and 1.0–1.5 mm for lobar/segmental bronchi. The normal bronchial caliber is 5–8 mm for seg-mental bronchi, whereas it is = 1 mm for subsegseg-mental bron-chi and bronbron-chioles(13,25). The size and thickness of the bron-chial walls are related to airflow limitation in obstructive diseases(19). For example, a bronchial wall thickness ≥ 1.75 mm in segmental bronchi is associated with an increased risk of acute exacerbations in patients with chronic obstructive pulmonary disease(26). Among normal individuals, the mean RWT of the bronchial wall is < 50%, varying with age and the order of bronchial generation studied(13,27). In the present study, the program employed in the automated analysis of the airways was able to identify and objectively measure the CF-related dilation and thickening of the bronchial walls. Among the 34 CF patients evaluated here, the mean bron-chial diameter was 7.8 mm, the mean bronbron-chial wall thick-ness was 2.2 mm, and the mean RWT was 83%.
In our comparison between patients with and without severe airflow obstruction, the only quantitative airway vari-able that showed a significant difference was the number of bronchi analyzed. Wielpütz et al.(13) reported that the num-ber of bronchi studied was greater in CF patients than in controls. The loss of physiological tapering of the airways is related to the development of bronchiectasis and allows the automated program to advance further in the segmentation by identifying and measuring a greater number of bronchi. The relationship of this variable (greater number of auto-matically identified bronchi) with the presence of severe air-flow obstruction in patients with CF has not been previously described in the literature.
Although we found no significant differences between the two groups of CF patients in terms of the various airway measurements, those measurements correlated well with the spirometric parameters. The main finding was that we iden-tified good correlation between RWT3–8 and FEV1% in the patients without severe airflow obstruction (R = –0.62), that correlation being statistically significant and stronger than the correlation identified in the patients with severe airflow obstruction. Although there is as yet no consensus in the medical literature as to the most appropriate airway mea-sures to be studied on CT images(28), our study shows that determining the RWT of the bronchi can be more advanta-geous than is the determination of other measures. The lin-ear measures of bronchial caliber, area of the bronchial lu-men, and bronchial thickness vary according to the order of bronchial generation and anthropometric parameters (sex, age, height, and weight), whereas RWT is a proportional measure and probably tends to be more constant in this popu-lation, regardless of other constitutional variables.
Discard-ing the first and second bronchial generations (main and lobar bronchi), we focused our analysis on the small airways (subsegmental bronchi), where the initial and most impor-tant changes in obstructive pulmonary disease occur(29). The weaker correlation between tomography measurements and spirometric parameters in the group of patients with severe airflow obstruction suggests that the presence of changes other than bronchiectasis, such as mucoid impaction, atelecta-sis, and parenchymal destruction, contributes to the func-tional impairment associated with the disease. These changes are not evaluated by the program for the automated analysis of the airways on CT images.
This study has limitations. The spirometry tests were not all performed in the same device and by the same techni-cian, which would be the ideal situation in order to avoid any bias related to the performance of the test. We did not use spirometric monitoring of inspiration during the perfor-mance of CT scans, which could confirm the acquisition of images at full inspiration, especially in younger patients. The degree of inspiration can affect quantitative measures of the lungs and airways on CT images. Despite the advanced al-gorithm implemented by the automated program, the analy-sis of bronchi of the distal segments also creates a relative selection bias because it preferably detects the airways that are dilated. Other limitations of computational analysis of the airways are inherent to CT imaging, because small dif-ferences in attenuation values and discrete changes in the lumen can complicate correct the identification of the bron-chial borders and the differentiation between wall thicken-ing and partial obstruction by mucus or adjacent structures. Morphological analysis of distal bronchi to the ninth bron-chial generation is not possible with the MDCT techniques currently available(30). It should also be borne in mind that the generations of segmented airways based on automated bifurcations are not exactly equal to anatomical generations. As for the functional correlation, we did not analyze values of forced expiratory flow, a measure that can show initial obstructive change of the airway. For some patients, we did not have access to plethysmography-acquired lung volumes, which could also be correlated with the parameters obtained by CT. Finally, we did not adjust airway measures for pa-tient height and weight, which, especially in comparisons involving adults and children, could increase the accuracy of the analysis.
CONCLUSION
REFERENCES
1. Wine JJ. The genesis of cystic fibrosis lung disease. J Clin Invest. 1999;103:309–12.
2. Mall M, Grubb BR, Harkema JR, et al. Increased airway epithelial Na+ absorption produces cystic fibrosis-like lung disease in mice. Nat Med. 2004;10:487–93.
3. Gibson RL, Burns JL, Ramsey BW. Pathophysiology and manage-ment of pulmonary infections in cystic fibrosis. Am J Respir Crit Care Med. 2003;168:918–51.
4. Dodge JA, Lewis PA, Stanton M, et al. Cystic fibrosis mortality and survival in the UK: 1947-2003. Eur Respir J. 2007;29:522–6. 5. Eichinger M, Heussel CP, Kauczor HU, et al. Computed
tomogra-phy and magnetic resonance imaging in cystic fibrosis lung disease. J Magn Reson Imaging. 2010;32:1370–8.
6. Puderbach M, Eichinger M, Gahr J, et al. Proton MRI appearance of cystic fibrosis: comparison to CT. Eur Radiol. 2007;17:716–24. 7. Brody AS, Molina PL, Klein JS, et al. High-resolution computed tomography of the chest in children with cystic fibrosis: support for use as an outcome surrogate. Pediatr Radiol. 1999;29:731–5. 8. Helbich TH, Heinz-Peer G, Eichler I, et al. Cystic fibrosis: CT
as-sessment of lung involvement in children and adults. Radiology. 1999;213:537–44.
9. de Jong PA, Ottink MD, Robben SG, et al. Pulmonary disease as-sessment in cystic fibrosis: comparison of CT scoring systems and value of bronchial and arterial dimension measurements. Radiology. 2004;231:434–9.
10. Kerem E, Reisman J, Corey M, et al. Prediction of mortality in patients with cystic fibrosis. N Engl J Med. 1992;326:1187–91. 11. de Jong PA, Lindblad A, Rubin L, et al. Progression of lung disease
on computed tomography and pulmonary function tests in children and adults with cystic fibrosis. Thorax. 2006;61:80–5.
12. Montaudon M, Berger P, Cangini-Sacher A, et al. Bronchial mea-surement with three-dimensional quantitative thin-section CT in patients with cystic fibrosis. Radiology. 2007;242:573–81. 13. Wielpütz MO, Eichinger M, Weinheimer O, et al. Automatic
air-way analysis on multidetector computed tomography in cystic fi-brosis: correlation with pulmonary function testing. J Thorac Im-aging. 2013;38:104–13.
14. Global Initiative for Chronic Obstructive Lung Disease. Pocket guide to COPD diagnosis, management, and prevention. A guide for health care professionals (updated 2015). [cited 2015 May 25]. Available from: http://www.goldcopd.it/materiale/2015/GOLD_Pocket_ 2015.pdf.
15. Weinheimer O, Achenbach T, Bletz C, et al. About objective 3-d analysis of airway geometry in computerized tomography. IEEE Trans Med Imaging. 2008;27:64–74.
16. Grenier PA, Beigelman-Aubry C, Fetita C, et al. Multidetector-row CT of the airways. Semin Roentgenol. 2003;38:146–57. 17. Kauczor HU, Wielpütz MO, Owsijewitsch M, et al. Computed
to-mographic imaging of the airways in COPD and asthma. J Thorac Imaging. 2011;26:290–300.
18. de Jong PA, Nakano Y, Lequin MH, et al. Progressive damage on high resolution computed tomography despite stable lung function in cystic fibrosis. Eur Respir J. 2004;23:93–7.
19. Hasegawa M, Nasuhara Y, Onodera Y, et al. Airflow limitation and airway dimensions in chronic obstructive pulmonary disease. Am J Respir Crit Care Med. 2006;173:1309–15.
20. Achenbach T, Weinheimer O, Biedermann A, et al. MDCT assess-ment of airway wall thickness in COPD patients using a new method: correlations with pulmonary function tests. Eur Radiol. 2008;18: 2731–8.
21. Aysola RS, Hoffman EA, Gierada D, et al. Airway remodeling mea-sured by multidetector CT is increased in severe asthma and corre-lates with pathology. Chest. 2008;134:1183–91.
22. Koenigkam-Santos M, Paula WD, Gompelmann D, et al. Endo-bronchial valves in severe emphysematous patients: CT evaluation of lung fissures completeness, treatment radiological response and quantitative emphysema analysis. Radiol Bras. 2013;46:15–22. 23. Vult von Steyern K, Björkman-Burtscher IM, Geijer M.
Radiogra-phy, tomosynthesis, CT and MRI in the evaluation of pulmonary cystic fibrosis: an untangling review of the multitude of scoring systems. Insights Imaging. 2013;4:787–98.
24. Herold CJ, Brown RH, Mitzner W, et al. Assessment of pulmonary airway reactivity with high-resolution CT. Radiology. 1991;181: 369–74.
25. Webb WR. Normal lung anatomy. In: Webb WR, Müller NL, Naidich DP, editors. High-resolution CT of the lung. Philadelphia, PA: Lippincott Williams & Wilkins; 2008. p. 42–62.
26. Han MK, Kazerooni EA, Lynch DA, et al. Chronic obstructive pul-monary disease exacerbations in the COPDGene study: associated radiologic phenotypes. Radiology. 2011;261:274–82.
27. Zach JA, Newell JD Jr, Schroeder J, et al. Quantitative computed tomography of the lungs and airways in healthy nonsmoking adults. Invest Radiol. 2012;47:596–602.
28. Lynch DA, Al-Qaisi MA. Quantitative computed tomography in chronic obstructive pulmonary disease. J Thorac Imaging. 2013;28: 284–90.
29. Hogg JC, Chu F, Utokaparch S, et al. The nature of small-airway obstruction in chronic obstructive pulmonary disease. N Engl J Med. 2004;350:2645–53.
30. Goldin JG. Quantitative CT of the lung. Radiol Clin North Am. 2002;40:145–62.
Erratum