534
Original Articles
Dietary patterns and associated factors among the elderly
Marcela Previato do Nascimento Ferreira1 Ágatha Nogueira Previdelli1 Tatiana Império de Freitas1 Karina Maffei Marques1 Rita Maria Monteiro Goulart1 Rita de Cássia de Aquino1
1 Universidade São Judas Tadeu, Programa de Pós Graduação Strictu Sensu em Ciências do Envelhecimento. São Paulo, SP, Brasil.
Correspondence Rita de Cássia de Aquino E-mail: [email protected]
Abstract
The aim of the present study was to identify dietary patterns among the elderly, and associate the same with sociodemographic characteristics, health and lifestyle. A cross-sectional study was carried out with a non-probabilistic sample of 295 elderly residents of both genders of the city of São Caetano do Sul, São Paulo, Brazil, who were users of public health units. Dietary patterns were identified considering 44 food items identified through 24-hour dietary recall. Factor analysis by the principal components method was used, adopting loads greater than 0.25 as the cut-off point, followed by Varimax orthogonal rotation. The associations were analyzed by the linear regression method, with variables with p<0.20 in univariate regression selected, and those with p<0.05 maintained in the multivariate model. There was a greater percentage of elderly females (85.1%) and those aged 60-69 years (46.4%). Three dietary patterns were identified:
the "traditional" pattern was associated with the male gender (β=0.59, p<0.001) and
physically active individuals (β=0.39, p=0.020); the "Pastas, pork and sweets" pattern
was associated with the male gender (β=0.38, p=0.025) and retired individuals (β=0.55, p=0.017); and the "Coffee with milk and bread and butter" pattern was associated with
an age of 80 years or older (β=0.55, p=0.004) and elderly persons who had difficulty
chewing (β=0.38, p=0.013). The dietary patterns identified show that the elderly tend
to maintain similar eating habits to the Brazilian population in general, and that diet changes to a similar degree as health and life style conditions.
535
INTRODUCTION
Knowledge of the food consumption of an individual of any age group is essential to the evaluation of their nutritional status. Studies are therefore carried out to identify eating habits and their possible correlation with health status. The Academy of Nutrition and Dietetics1 analyzed factors that may interfere in the choice of foods, such as age, socioeconomic conditions, psychosocial factors, environmental conditions, lifestyle, religion and body composition, which are affected by influences such as governmental sectors, private industry and
marketing.
One of the ways to analyze food consumption is to identify dietary patterns, which consists of evaluating the main food groups consumed by individuals or groups, and correlating these with their characteristics, such as aging.
Studies that seek to identify dietary patterns in the
elderly are scarce both in Brazilian2,3 and international literature4-7, despite the importance of this issue for the scientific community. Food consumption is directly related to nutritional status and consequently to the emergence or non-emergence of diseases, in particular Chronic Noncommunicable Diseases, which tend to increase with advancing age.
In non-Brazilian literature, Anderson et al.8
identified six dietary patterns among 3,075 elderly
people from different regions of the United States who participated in the Health, Aging and Body Composition - Health ABC study, related to the influence of genotyping and insulin sensitivity.
In Brazil, Ferreira et al.2 carried out a study
with 355 elderly people in the city of Botucatu, São
Paulo, and identified the following patterns: Healthy, Snacks and weekend meal, Fruits, Light and Integral, Soft diet and Traditional, and verified their adherence to sociodemographic characteristics.
Given the specificities of the aging process, the demographic transition that Brazil is undergoing and the importance of nutrition in factors that affect the quality of life of the elderly, it is necessary to carry out studies to identify the food choices of such individuals in order to support public policies and nutritional counseling among this age group.
The objective of the present study was to identify the dietary patterns of elderly users of public health units living in the municipal region of São Caetano do Sul, São Paulo, Brazil, and to associate these with sociodemographic variables, nutritional status and lifestyle.
METHODS
A descriptive cross-sectional study was performed with 295 elderly individuals, aged 60 years and older, of both genders, who were users of public health units in the municipal region of São Caetano do Sul, São Paulo, Brazil, distributed among the districts of the
city. Data collection took place over twelve months
between February 2014 and February 2015.
The sample studied was non-probabilistic and chosen for convenience, and the sample size was determined according to the main objective of evaluating the diet of the elderly. The methodology of Hair et al.9 was applied, which states that the sample size should be five times greater than the number of items in the Food Frequency Questionnaire (FFA),
which contains 57 groups. In addition, a sample of at
least 288 individuals was estimated for multivariate regression analysis, guaranteeing a 95% confidence level, and a sampling error of 5% was applied. All the elderly persons registered with the public health units that agreed to participate were included, while those with cognitive deficits who were unable to respond to the interview were excluded.
Data were collected by a team of trained nutritionists who displayed posters at public health units and conducted daily visits during local activities, inviting the elderly to participate and explaining the objectives and procedures. Those who were interested in participating provided their name and telephone number, and were informed of the date and time of the appointment of their choice, with a nutritionist contacting them 24 hours earlier to confirm. A structured questionnaire was developed based on the Saúde, Bem-estar e Envelhecimento (the Health, Welfare and Aging) survey of the Pan American Health Organization (SABE/OPAS)10. Socio-demographic data (age, gender, schooling, marital status, family composition and income) were collected, as well as clinical and lifestyle data
536
nutritional supplements, oral cavity conditions and gastrointestinal tract). The elderly declared whether they performed physical activity or did not perform physical activity, regardless of the frequency and/or intensity of the same. The per capita income was calculated by the amount received per month (retirement, family
allowance, rent or bank investments, government
programs and others) divided by the minimum salary
applicable in 2014, which was R$724.00.
Anthropometric variables were used to verify nutritional status, with weight and height measured
to calculate the body mass index (BMI=weight in kg/height in m²) and waist circumference (WC)
also measured. BMI was classified according to age group, as recommended by the Pan American Health Organization11, into underweight (BMI<23
kg/m²), normal weight (BMI≥23 and <28 kg/m²), overweight (BMI≥28 and <30 kg/m²) and obesity (BMI≥30kg/m²). The World Health Organization (WHO) standard, which predicts the risk of metabolic
complications associated with obesity, was used in the classification of waist circumference, based on
gender, as follows: high risk for men (WC≥94cm) and women (WC≥80cm) and very high risk for men (WC ≥102) and women (WC≥88cm).
A 24-hour dietary recall (24HR) was used to identify food consumption. The elderly were instructed to note the food consumed on the eve
of the interview in order to reduce the risk of
forgetfulness. The 24HRs were analyzed to transform the quantities of the foods and preparations described into the usual measures of grams or milliliters. The data obtained from the 24HRs were entered in the Nutrition Data System for Research (NDS-R) software program12.
The interviews were conducted in order to
contemplate all the days of the week and months
of the year, considering the variability of the patterns of food consumption in different seasons.
To obtain the dietary patterns, exploratory factorial analysis by principal components (PCA) was performed, considering the food from the R24H in grams or milliliters. The 529 foods/beverages
reported in 24HR were grouped based on the 57
items of the Food Frequency Questionnaire (FFQ) adapted for the present study13, with those that were not reported by at least 5% of the elderly persons
excluded. Following a number of regrouping tests based on nutritional similarity, 44 food items were maintained to identify dietary patterns.
In the first phase of PCA, the Cattell plot (scree plot) was evaluated and 19 consumption patterns with eigenvalues greater than 1.0 were identified. This value indicates a greater ability to explain the variance of the data than an original variable could describe individually14,15.
Varimax orthogonal rotation was then used to increase the interpretability of the data and the food items the factor loading of which was greater than 0.25 were maintained in the matrix. To verify the appropriateness of the use of the analysis, the uniformity of the data was tested by the
Kaiser-Meyer-Olkin test, and presented a satisfactory result
(0.56). The homogeneity of variance was confirmed by the Bartlett sphericity test (p<0.001). The scores of each participant were computed to identify the factors associated with the patterns obtained14.
The study variables were categorized with the purpose of performing descriptive and inferential statistical analysis, and a significance level of 5% was adopted.
For inferential analysis of the identified dietary patterns, the linear regression method was chosen, with the scores obtained in each pattern for each individual used as the dependent variable. In univariate linear regression analysis, independent variables that obtained a value of p<0.20 were selected for inclusion in multiple regression and the model was adjusted by gender. The stepwise forward strategy was used, and variables with p<0.05 were maintained in the final model. Measures of central tendency and dispersion were also calculated.
The study was approved by the Ethics Research Committee of the Fundação Municipal de Saúde de São Caetano do Sul (the Municipal Health Foundation of São Caetano do Sul) and the Universidade São Judas Tadeu (São Judas Tadeu University), according
to approval nº71/2013 and nº470.062 (CAAE 24855113.6.0000.0089), respectively. A letter of
537
RESULTS
A total of 295 elderly people participated in the present study, of whom 85.1% were female, 46.4%
were aged between 60 and 69 years old, 44.7% were married, 74.6% lived with a partner, 41.7% had from
zero to four years of schooling, 62.4% were retired and 44.1% had a per capita income between one and three minimum salaries. Regarding health and
lifestyle characteristics, 95.6% were non-smokers, 84.7% practiced physical activity, 74.6% stated that
their eating habits had not changed and 64.4% had not used food supplements in the last year.
Regarding nutritional status, 43.7% of the elderly
were overweight (overweight or obese) and more than
half (64.4%) presented a very high risk of metabolic
complications associated with obesity.
Three dietary patterns were identified by factorial analysis, and were named according to the main food items that constituted each one, according to the foods habit of the Brazilian population and based on the contribution (factorial loading) of food items in each pattern. Pattern 1, entitled Traditional, explained 5.45% of consumption variation and presented food commonly consumed by the Brazilian population in main meals: beans, rice, vegetables,
olive oil, vegetables and chicken. Pattern 2 (Pasta, pork and sweets), was so-called due to the presence
of sweets, soft drinks, pasta with sauce and pork,
explaining 4.94% of the variation of consumption.
Finally, standard 3 (Coffee with milk and bread and butter) included foods that constitute a typical Brazilian
breakfast or snack: butter/margarine, toast, bread, sugar, coffee and whole milk, which explained 4.69%
of the variation in consumption. Together, the three
patterns explained 15.08% of the total intake variance
(Table 1).
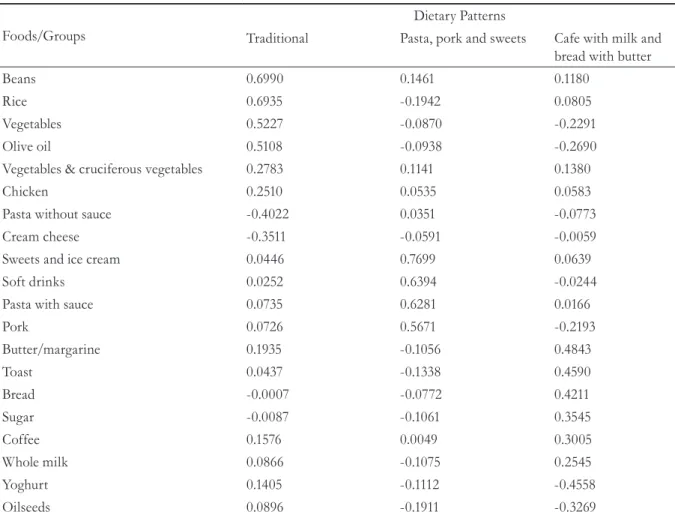
Table 1. Factorial loads obtained by analysis of the major components of dietary patterns of the elderly. São Caetano do Sul, São Paulo, 2015.
Foods/Groups
Dietary Patterns
Traditional Pasta, pork and sweets Cafe with milk and
bread with butter
Beans 0.6990 0.1461 0.1180
Rice 0.6935 -0.1942 0.0805
Vegetables 0.5227 -0.0870 -0.2291
Olive oil 0.5108 -0.0938 -0.2690
Vegetables & cruciferous vegetables 0.2783 0.1141 0.1380
Chicken 0.2510 0.0535 0.0583
Pasta without sauce -0.4022 0.0351 -0.0773
Cream cheese -0.3511 -0.0591 -0.0059
Sweets and ice cream 0.0446 0.7699 0.0639
Soft drinks 0.0252 0.6394 -0.0244
Pasta with sauce 0.0735 0.6281 0.0166
Pork 0.0726 0.5671 -0.2193
Butter/margarine 0.1935 -0.1056 0.4843
Toast 0.0437 -0.1338 0.4590
Bread -0.0007 -0.0772 0.4211
Sugar -0.0087 -0.1061 0.3545
Coffee 0.1576 0.0049 0.3005
Whole milk 0.0866 -0.1075 0.2545
Yoghurt 0.1405 -0.1112 -0.4558
Oilseeds 0.0896 -0.1911 -0.3269
538
continued from Table 1
Foods/Groups
Dietary Patterns
Traditional Pasta, pork and sweets Cafe with milk and
bread with butter
Cereals 0.1049 -0.0954 -0.3244
Fish 0.0260 -0.1707 -0.3040
Legumes -0.0084 -0.1421 -0.2830
Skimmed milk -0.1906 0.0498 -0.1584
Cheeses 0.0135 0.0406 -0.0787
Sweet biscuits -0.1281 0.1959 -0.0534
Simple cake -0.1684 -0.1471 0.0565
Jelly/milk pudding 0.0817 -0.1055 0.2246
Root vegetables -0.0875 0.0649 -0.0148
Flours -0.1055 -0.0199 -0.0945
Soups -0.2331 -0.0617 0.1385
Beef 0.1603 0.1456 0.1781
Cold cuts -0.0456 -0.0056 0.0594
Fruit -0.0547 0.1728 -0.2050
Natural and concentrated juice -0.1001 -0.1016 -0.2397
Processed juice -0.0674 -0.0465 -0.0571
Teas 0.0052 -0.1701 0.0494
Chocolate 0.0408 0.0889 0.0522
Chocolate milk -0.0026 0.0646 0.0347
Tomato Sauce -0.1498 0.0445 0.1137
Sweet bread 0.0830 -0.0103 0.1307
Salty crackers -0.0540 0.0430 -0.0116
Savory snacks, sandwiches and pizza -0.2284 -0.0275 -0.1010
Tomatoes 0.2320 0.0086 -0.2023
Explained variance (%) 5.45 4.94 4.69
Total explained variance (%) 5.45 10.39 15.08
It should be noted that food items that contributed inversely to the pattern presented negative loads, indicating that they did not form part of the same consumption occasion. The Traditional pattern presented an inverse participation for the consumption of pasta without sauce (-0.4022) and
cream cheese (-0.3511) and the Coffee with milk and bread and butter pattern showed an inverse participation
for yoghurts (-0,4558), oilseeds (-0.3269), cereals (-0.3244), fish (-0.3040), vegetables (-0.2830) and
olive oil (-0.2690) (Table 1).
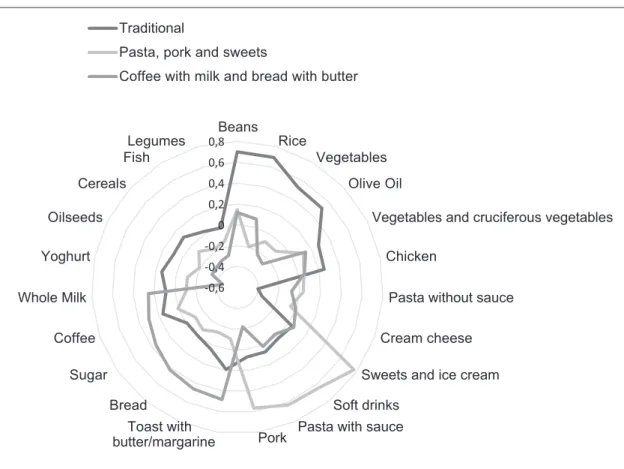
The degree to which each food item comprises the composition of the three consumption patterns can be seen in Figure 1.
In terms of the relationship between the characteristics of the elderly persons and dietary patterns, it was observed that the Traditional pattern
was positively associated with males (β=0.59, p<0.001)
and those who performed physical activity (β=0.39,
p=0.020), and inversely with elderly patients who used
dental prostheses (β=-0.25, p=0.034). In the Pasta, pork and sweets pattern, there were associations with males
(β=0.38, p=0.025) and retired elderly persons (β=0.55, p=0.017). However, separated/divorced/widowed
elderly persons (β=-0.24, p=0.041) had an inverse association with this pattern. The Coffee with milk and
bread and butter pattern was associated with age ≥80
years (β=0.55; p=0.004) and with elderly persons that
539
Table 2. Association between dietary patterns and the characteristics of the elderly. São Caetano do Sul, São Paulo, 2015.
Variables N (%) Traditional Pattern Pasta, pork and
sweets pattern
Coffee with milk
and bread with butter pattern Linear regression Linear regression Linear regression
β p β p β p
Gender
Female 251 (85.1)
Male 44 (14.9) 0.59 <0.001 0.38 0.025 –
Age range (years)
60 to 69 137 (46.4)
70 to 79 124 (42.0) – – -0.02 0.905
80 or more 34 (11.5) 0.55 0.004
Marital status
Married 132 (44.7)
Separated/Divorced/Widowed 163 (55.3) – -0.24 0.041 –
Lives alone
Yes 75 (25.4)
No 220 (74.6) – –
to be continued Figure 1. Graphical representation of food items that comprise dietary patterns of the elderly. São Caetano do Sul, São Paulo, 2015.
-0,6 -0,4 -0,2 0 0,2 0,4 0,6 0,8
Beans Rice
Vegetables Olive Oil
Vegetables and cruciferous vegetables Chicken
Pasta without sauce Cream cheese Sweets and ice cream Soft drinks
Pasta with sauce Pork
butter/margarine Toast with Bread Sugar Coffee Whole Milk
Yoghurt Oilseeds
Cereals Fish
Legumes Traditional
Pasta, pork and sweets
540
continued from Table 2
Variables N (%) Traditional Pattern Pasta, pork and
sweets pattern
Coffee with milk
and bread with butter pattern Linear regression Linear regression Linear regression
β p β p β p
Schooling (years of study)
0-4 123 (41.7)
5-8 62 (21.0) – – –
9-12 53 (18.0)
12 or more 57 (19.3)
Occupational activity
Work 21 (7.1)
Retired 184 (62.4) – 0.55 0.017 –
Homemaker 86 (29.2) 0.06 0.642
Information not given 4 (1.3) 0.28 0.575
Per capita income (MS: minimum salary)
No information 6 (2.0)
No income 29 (9.8) – – –
Up to 1 MS 62 (21.0)
>1 to ≤3 MS 130 (44.1)
>3 MS 68 (23.1)
Smoker
No 282 (95.6)
Yes 13 (4.4) – – –
Nutritional status
Normal weight 125 (42.4)
Underweight 41 (13.9) – – –
Overweight 38 (12.9)
Obesity 91 (30.8)
Waist circumference
Low risk 52 (17.6)
High risk 53 (18.0) – – –
Very high risk 190 (64.4)
Physical Activity
Doesn’t perform 45 (15.3)
Performs 250 (84.7) 0.39 0.020 – –
Difficulty chewing
No 263 (89.2)
Yes 32 (10.8) – – 0.38 0.013
Dentition
Own teeth 124 (42.0)
541
DISCUSSION
To characterize the food consumption of the elderly, three dietary patterns were identified, which helped with the understanding of the food choices of the elderly and their associated factors. This methodology was chosen as its results can be used for the planning and implementation of public policies. Although widely used in academia, research on the dietary patterns of the elderly on a national level is still scarce.
The Traditional pattern consisted of foods
commonly consumed by the Brazilian population
in their main meals: rice, beans, chicken, greens,
vegetables, and olive oil, and was positively associated with male elderly persons and physical activity. In the study of Brazilian adults by Neumann et al.16,
dietary patterns were associated with a risk of the
development of cardiovascular disease, and the Traditional pattern, composed of cereals, beans and
infusions, unlike the present study, was associated
with the female gender. Ferreira et al.2 identified dietary patterns in the elderly, including a Traditional pattern, with composition similar to the present study, whose main components were rice and beans. Selem17 identified three dietary patterns in adults and elderly persons in the city of São Paulo, noting that one, also entitled Traditional (Rice, beans, butter/margarine,
whole milk, coffee/tea and sugar), was positively
associated with non-hypertensive individuals.
Nascimento et al.18 with the objective of identifying dietary patterns in different Brazilian regions, used data from a nationally representative sample and observed that elderly persons in the southeast region of the country are more related to a Mixed pattern (vegetables, fruits, root vegetables,
breads, cookies, dairy products, fish, butter or margarine and sugary drinks) than the other pattern
found, which was named Rice and Beans. Both the Traditional pattern found in the present study and the Mixed pattern of the Brazilian population indicated the habit of the elderly of consuming vegetables (greens and vegetables). The Traditional pattern items observed in the present study are similar to foods that belong to a pattern often called Prudent and
associated with a reduced risk of chronic diseases
and frailty in the elderly16,17,19, and these data may corroborate the association of the pattern with the
practice of physical activity, and also reveal that part of the sample is composed of elderly people who traditionally consume foods considered to be "healthier" than other studies.
The second dietary pattern found was called Pasta, pork and sweets and was composed of pasta
with sauce, pork, sweets and soft drinks. Compared
with other scientific findings, it was noticed that, for the most part, the pasta and sweets appeared as isolated patterns, and not as positive factor loadings for the composition of a single pattern, as meals are composed of a variety of food items, and not only of one food, which ends up hampering the power of comparative analysis4,6,19-21. In the study by Selem17 the Contemporary pattern (soft drinks, savory snacks/ sandwiches/pizzas, yellow cheeses, pasta, sauces, alcoholic beverages, sweets and processed meats) was similar to the Pasta, pork and sweets pattern. It is also worth noting that these food items are commonly found in non-Brazilian studies and are named the Western standard, composed of foods that are easy to prepare22, which may justify the positive association of this pattern with the male gender and retired individuals, as was also observed by Selem17.This is a relevant finding for primary health care teams, which can be used to stimulate retired elderly people to continue giving preference to more "traditional" meals, and to warn that in the majority, foods that are easy to prepare and eat possess excess sodium, sugars and fats, damaging the health of those who consume them more often.
The third dietary pattern entitled Coffee with milk and bread and butter (butter/margarine, toast,
bread, sugar, coffee and whole milk) was associated
with elderly people aged 80 years or older and with
difficulty chewing. Food items that make up this pattern usually make up the breakfast and snacks of
Brazilians, especially in the southeast, or substitute main meals. Santos et al.3 identified dietary patterns in adult and elderly meals in the city of São Paulo, and found the Coffee with milk and bread pattern present at dinner. A qualitative study that sought to identify obstacles to the consumption of fruit and vegetable in adults and elderly people in Belo Horizonte, demonstrated the discontinuity of the habit of eating dinner, highlighted by the following discourse: "I drink milk, eat a piece of bread, but I rarely
542
are easier to acquire, prepare and consume, due to issues related to the reduction of economic power and the chewing difficulties presented by the elderly, especially long-lived elderly persons, and should become a target of actions of nutritional attention and oral health for this age range, as the substitution
of a main meal for a snack in individuals with greater
nutritional needs than others, can increase frailty
in the development of diseases, as well as making
effective treatment more difficult.
In addition, studies have indicated a preference for the Coffee with milk and bread pattern among Brazilian elderly men, as described by Freitas et al.24 in an analysis of the foods most consumed by the elderly, in
which whole milk occupied fifth position and French
bread seventh. Data from the most recent Pesquisa de Orçamentos Familiares (Family Budget Survey) (POF) 2008-2009 showed that when the consumption
of drinks among adolescents, adults and the elderly is compared, whole milk was consumed in the greatest
quantities in the age groups older than 60 years25. A study by Nascimento et al.18, which used the same data, showed that among foods belonging to the main food pattern of the elderly in the southeast of Brazil were bread, dairy products and butter/ margarine.
Massarani et al.26 conducted a study using data from the National Food Survey, evidencing that dietary patterns are directly related to family aggregation in the Brazilian population, describing the patterns: Traditional snack (coffee, bread, fats and oils, and cheese), Large traditional meal (rice, beans and other vegetables, and meats), and Fast food style snacks
(sandwiches, processed meats, soft drinks, salads and
pizzas), which were similar to the patterns identified in the present study, and which suggest the influence of family in lifelong eating habits.
It should be noted that although the fruit group did not appear in any dietary pattern in the present study, the frequency of fruit consumption was observed in all the other samples, with more than half of the elderly (58%) consuming three or more fruits daily27, and Figueira et al.28 stating that one of the factors that promotes fruit consumption is that such items are eaten in intervals between meals, and perhaps because of this are not associated with a particular eating occasion, together with other food items.
One important point to consider is the use of factorial analysis by the principal components method. This analysis and the identification of patterns are described in literature as subjective, as it is up to the researcher to decide and justify, with the aid of other statistical analyzes, the food grouping, the number of factors to be extracted, and the nomenclature adopted for the patterns, which may hamper the power of comparison with other studies, in addition to the analysis of differences in social, economic and demographic characteristics29. However, it should be considered that the similarity of the methodology chosen for data analysis, when searching for dietary patterns, allows us to establish a profile of food behavior that allows the explanation of certain health outcomes associated with the pattern. Furthermore, Newby et al.30 observed that even with less comparative power, studies that demonstrated similarity in the constituents of the patterns identified can be considered to possess reasonable reproducibility and data consistency, corroborating the findings of the present study, and can serve as a support for public policies and interventions for the public studied.
It is worth highlighting some limitations of the present study, such as the use of a non-probabilistic sample, which reduces the power of comparison between Brazilian and non-Brazilian population studies. However, to reduce this bias, the elderly were selected from different neighborhoods in the city, with different social, demographic and economic characteristics, but which were also similar to the official data of the Census of the municipal region31. Another possible limitation is age, as common alterations in aging, such as concentration difficulty and decreased memory, may increase the duration of the interview and require more attention on the part of the interviewer. In this sense, the training of the research nutritionists and the available space for data collection were essential to ensure the reliability of the information collected and used in the analysis and the results obtained.
CONCLUSION
543
pork and sweets pattern, which was associated with gender and being retired, and the Coffee with milk and bread and butter, which was associated with elderly persons aged 80 years or older and who had difficulty chewing. The results of the present study serve as a basis for the development of intervention strategies and specific public policies in this municipal region
and age group, as municipal-level studies are important, as they can identify differences that cannot always be observed in national studies. Identifying the food patterns of the elderly population contributes to the discussion among care professionals about the impact of food and nutrition on the quality of life and health of the elderly population in Brazil.
REFERENCES
1. Academy of Nutrition and Dietetics. Position of the academy of nutrition and dietetics: total diet approach
to healthy eating. J Acad Nutr Diet. 2013;113(2):307-17.
2. Ferreira PM, Papini SJ, Corrente JE. Diversity of eating patterns in older adults: a new scenario? Rev
Nutr. 2014;27(1):67-79.
3. Santos RO, Fisberg RM, Marchioni DML, Baltar VT. Dietary patterns for meals of Brazilian adults. Brit J
Nutr. 2015;114(5):822-8.
4. Hamer M, McNaughton AS, Bates CJ, Mishra GD. Dietary patterns, assessed from a weighed food record, and survival among elderly participants from the
United Kingdom. Eur J Clin Nutr. 2010;64(8):853-61.
5. Langsetmo L, Hanley DA, Prior JC, Barr SI, Anastassiades T, Towheed T, et al. Dietary patterns and incident low-trauma fractures in postmenopausal
women and men aged ≥ 50 y: a population-based cohort study. Am J Clin Nutr. 2011;93(1):192-9.
6. Mattei J, Noel SE, Tucker KL. A meat, processed meat, and french fries dietary pattern is associated with high allostatic load in Puerto Rican older adults.
J Am Diet Assoc. 2011;111(10):1498-1506.
7. Torres SJ, Lautenschlager NT, Wattanapenpaiboon
N, Greenop KR, Beer C, Flicker L, et al. Dietary
patterns are associated with cognition among older people with mild cognitive impairment. Nutrients.
2012;4(11):1542-51.
8. Anderson AL, Harris TB, Tylavsky FA, Perry SE, Houston DK, Lee JS, et al. Dietary patterns, insulin sensitivity and inflammation in older adults. Eur J
Clin Nutr. 2012;66:18-24.
9. Hair JF, Anderson RE, Tatham RL. Análise multivariada de dados. 5ª ed. Porto Alegre:
Bookman; 2005.
10. Saúde, Bem-estar e Envelhecimento, Organização Pan Americana de Saúde. Questionário de coleta de dados completo [Internet]. São Paulo: Universidade de
São Paulo, Faculdade de Saúde Pública; 2000 [acesso
em 08 de dezembro de 2014]. Disponível em: http:// www.fsp.usp.br/sabe/Artigos/Questionario_2000.pdf
11. Organização Pan Americana de Saúde. Encuesta Multicêntrica – Salud Bienestar y Envejecimiento
(SABE) en America Latina e el Caribe. In: 36ª
Reunión Del Comitê Asesor de Investigaciones em
Salud : informe preliminar [Internet]; 9-11 jul. 2001; Kingston 2001. Whashington, DC: OPAS; 2001 [acesso em 13 de fevereiro de 2014]. Disponível em:
http://www.opas.org/program/sabe.htm
12. University of Minnesota Nutrition. Data System Reaserch – NDSR [Internet]. Minneapolis: University
of Minnesota; 2013.
13. Universidade de São Paulo, Faculdade de Saúde Pública, Grupo de Pesquisa de Avaliação do Consumo Alimentar. Manual de avaliação do consumo alimentar em estudos populacionais: a experiência do inquérito de saúde em São Paulo (ISA). Fisberg RM, Marchioni DML, organizadoras. São
Paulo: Faculdade de Saúde Pública; 2012.
14. Hair JF, Anderson RE, Tatham RL, Black WC. Multivariate data analysis with readings. 4ª ed. New
Jersey: Prentice Hall; 1995.
15. Pestana MH, Gageiro JN. Análise de dados para ciências sociais: a complementaridade do SPSS.
Lisboa: Edições Sílabo; 2005.
16. Neumann AICP, Martins IS, Marcopito LF, Araujo EAC. Padrões alimentares associados a fatores de risco para doenças cardiovasculares entre residentes de um município brasileiro. Rev Panam Salud Publica.
2007;22(5):329-39.
17. Selem SSC. Padrões da dieta e hipertensão em adultos e idosos de São Paulo [dissertação]. São Paulo: Universidade de São Paulo, Faculdade de Saúde
Pública; 2012.
18. Nascimento S, Barbosa FS, Sichieri S, Pereira RA. Dietary availability patterns of the brazilian
macro-regions. Nutr J. 2011;10:79.
19. Léon-Muñoz LM, García-Esquinas E, López-García E, Banegas JR, Rodríguez-Artalejo F. Major
544
20. Pala V, Sieri S, Masala G, Palli D, Panico S, Vineis P, et al. Associations between dietary pattern and lifestyle, anthropometry and other health indicators in the elderly participants of the EPIC-Italy cohort. Nutr
Metab Cardiovasc Dis. 2006;16(3):186-201.
21. López EP, Rice C, Weddle DO, Rahill GJ. The
relationship among cardiovascular risk factors, diet
patterns, alcohol consumption, and ethnicity among women aged 50 years and older. J Am Diet Assoc.
2007;108(2):248-56.
22. Samieri C, Jutand MA, Féart C, Capuron L, Letenneur L, Barberger-Gateau P. Dietary patterns derived by hybrid clustering method in older people: association with cognition, mood, and self-rated
health. J Am Diet Assoc. 2008;108(9):1461-71. 23. Bailey RL, Mitchel DC, Miller CK, Still CD,
Jensen GL, Tucker KL, et al. A dietary screening
questionnaire identifies dietary patterns in older
adults. J Nutr. 2007;137(2):421-6.
24. Figueira TR, Lopes ACS, Modena CM. Barreiras e fatores promotores do consumo de frutas e hortaliças entre usuários do Programa Academia da Saúde. Rev
Nutr. 2016;29(1):85-95.
25. Freitas AMP, Philippi ST, Ribeiro SML. Lista de alimentos relacionados ao consumo alimentar de um grupo de idosos: análises e perspectivas. Rev Bras
Epidemiol. 2011;14(1):161-77.
26. Instituto Brasileiro de Geografia Estatística. Pesquisa de orçamentos familiares 2008-2009: análise do consumo alimentar pessoal no Brasil [Internet]. Rio de Janeiro:
IBGE; 2011 [acesso em 28 jan. 2016]. Disponível em:
http://www.ibge.gov.br/home/estatistica/populacao/ condicaodevida/pof/2008_2009_analise_consumo/ pofanalise_2008_2009.pdf
27. Massarani FA, Cunha DB, Muraro AP, Souza BSN,
Sichieri R, Yokoo EM. Agregação familiar e padrões
alimentares na população brasileira. Cad Saúde
Pública. 2015;31(12):2535-45.
28. Secafim MV, Previdelli NA, Marques KM, Ferreira MPN, Freitas TI, Goulart RMM, et al. Avaliação do consumo de frutas por idosos de São Caetano do Sul, São Paulo, Brasil. Geriatr Gerontol Aging.
2016;10(2):57-63.
29. Fisberg RM, Slater B, Marchioni DML, Martin LA. Inquéritos alimentares: métodos e bases científicos.
São Paulo: Manole; 2005.
30. Newby PK, Muller D, Hallfrisch J, Andres R, Tucker
KL. Food patterns measured by factor analisys and anthropometric changes in adults. Am J Clin Nutr.
2003;80(2):504-13.
31. Instituto Brasileiro de Geografia Estatística. Censo Demográfico 2010: São Caetano do Sul. Características da população – Amostra [Internet].
Rio de Janeiro: IBGE; [1995] -. [acesso em 07 mar.
2016]. Disponível em: http://www.ibge.gov.br/ cidadesat/topwindow.htm?1
Received: June 24, 2016