A spatial coherence-based vision-free brain-computer
interface using auditory selective attention
Leonardo Bonato FelixI, Aluizio d’Afonsêca NettoII, Fernando de Souza RanaudoI,II, Antonio Mauricio Ferreira Leite
Miranda de SáII
DOI: 10.5935/MedicalExpress.2015.06.03
I Universidade Federal de Viçosa, Departamento de Engenharia Elétrica, Viçosa, MG, Brazil.
II Universidade Federal do Rio de Janeiro. Programa de Engenharia Biomédica/COPPE, Rio de Janeiro, RJ, Brazil.
INTRODUCTION: The development of Brain Computer Interfaces based on Auditory Selective Attention allows patients unable to voluntarily control eye movement to interact with the interface, because such systems are independent of vision. An alternative technique suitable for Brain Computer Interface applications is Spatial Coherence, an objective method to detect the side where a subject is focusing attention. This method takes into consideration the Coherence Function and the topographic distribution of responses between EEG electrodes. In this work, we further study the Information Transfer Rate and the efects of overlapping windows in the calculations. The idea behind the overlapping is to decrease the duration of the test in order to augment the Information Transfer Rate.
METHOD: EEG signals were collected from fourteen adult men aged between 19 and 28 years. Amplitude-modulated tones were used for stimulation, with 32 and 38 Hz modulation and 500 and 2000 Hz carrier frequencies, on the left and right ears, respectively. Spatial coherence was used in an online Brain Computer Interface system using auditory steady-state responses modulated by Auditory Selective Attention.
RESULTS: The obtained hit rates and the Information Transfer Rate may be considered appropriate, with a maximum value of 82% and 1.89 bits/min. The better detector regarding sensitivity versus speciicity can be obtained by using a 50% overlap between consecutive data windows.
CONCLUSION: We conclude that the Spatial Coherence successfully detected the focus of attention, and it seemed useful as a classiier of the attention condition for vision-free Brain Computer Interface.
KEYWORDS: Brain-Computer Interface; EEG; Spatial Coherence; Auditory selective attention.
Felix LB, d’Afonsêca-Netto A, Ranaudo FS, Sá AMFLM. A spatial coherence-based vision-free brain-computer interface using auditory selective attention. MedicalExpress (São Paulo, online). 2015;2(6):M150603
Received for Publication on August 21, 2015; First review on September 14, 2015; Accepted for publication on September 25, 2015
E-mail: [email protected]
■
INTRODUCTIONThe “Cocktail Party Effect” describes the skill of focusing attention to a determined person who is speaking in an environment in which a mixture of conversations and background noises are observed.1
This mental capacity of resisting distracting stimuli and focusing on relevant information of a determined stimulus (or message) is called Auditory Selective Attention (ASA). ASA has been investigated in order to elucidate the mechanism underlying some features of hearing information control, such as the ability of selecting the relevant stimuli to which the subject
must respond appropriately.2 By applying auditory
steady-state responses (ASSRs) - i.e. responses evoked by amplitude-modulated tones (AM tones) and registered by the electroencephalogram (EEG)3 - in
ASA studies, Wolpaw et al.4 found an increase in the
evoked responses during selective attention. However, the effects of attention on ASSR are still a matter of debate. Linden et al.5 observed no significant changes
in ASSR during ASA. In a more recent work with magnetoencephalographic signals, Ross et al.6 observed
where ASA was assessed by ASSRs and detected by spatial
coherence. The proposed methodology can be classified as
vision-free type, since no visual or somatosensory feedback from the volunteer is required. Moreover, it requires no training from the subjects.
■
METHODSEEG data acquisition. EEG signals were collected from fourteen adult men aged between 19 and 28 years (22.4 ± 2.3 years) with no symptoms of neurological
pathologies or hearing loss, previously verified through
conventional audiometry. The experimental protocol was approved by the Ethics Committee of Universidade federal de Viçosa (Case number · 051/2010)
The signals were registered with a 36-channel
biological signal amplifier (BrainNET, BNT-36, EMSA, Brazil) with 0.1 Hz - 100 Hz band-pass filter. Sampling frequencies frequency of 600 Hz and 60 Hz notch filter were used. The
EEG signals were recorded through non-invasive electrodes placed on the scalp, according to the international 10-20 system, with reference to electrode Oz in order to obtain higher signal-to-noise ratio for ASSR.16 Silver/silver chloride
(Ag/AgCl) electrodes with 10 mm diameter were used and impedance was always maintained inferior to 5 kΩ. Only the subset of channels T3, F3, P3, O1, T4, P4, O2, Fz and Pz was used in this study.
Auditory selective attention protocol. AM tones were used for stimulation, with 32 and 38 Hz modulation and 500 and 2000 Hz carrier frequencies, on the left and right ears, respectively. The modulation depth was 100%. In order to avoid spectral leakage, the modulation frequencies were corrected in such a way that each window with 1024 points contained a prime number of cycles of the stimulating signal.17 The stimuli were digitally produced in a personal
computer simulating a continuous signal that had been sampled at 44100 Hz-sampling frequency (CD quality). The maximum amplitude was adjusted so that the intensity of each AM tone was 75 dB SPL (Sound Pressure Level). All stimulation experiments were conducted with the volunteer in the interior of an audiometric cabin, with acoustic isolation, in order to avoid interference of surrounding noises during the procedure. In this work each subject was tested only once.
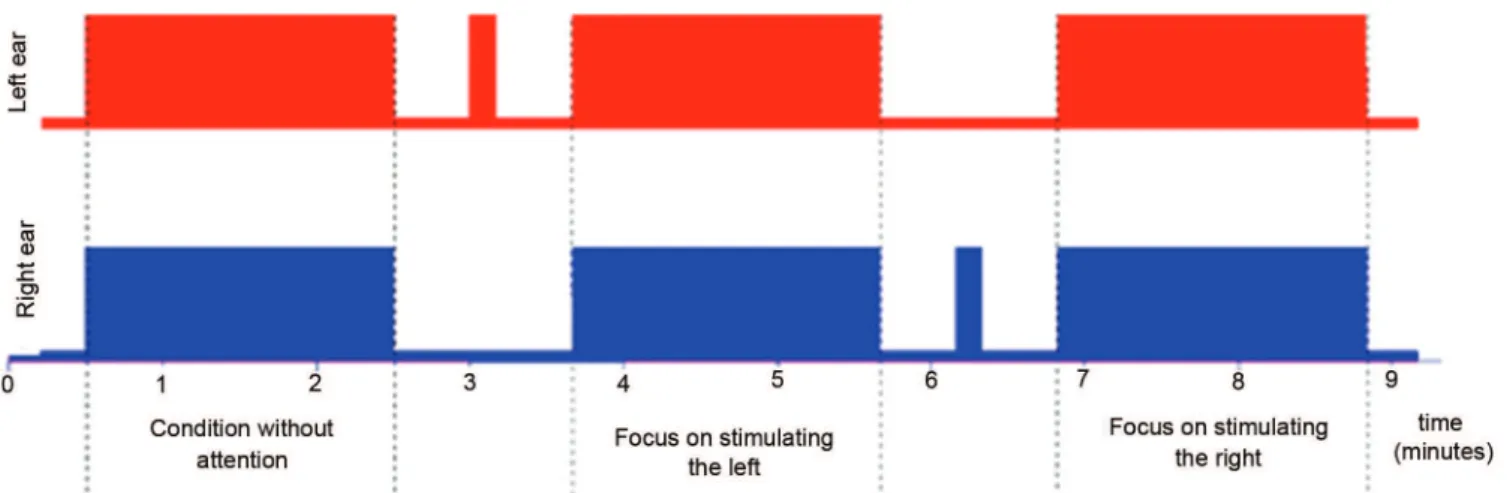
The stimulation protocol was composed by the
following three steps: first, ignoring both stimuli; second, focusing on the left stimulus only and; third, focusing on the
right stimulus only. Each stimulation stage lasted 2 min with 30 sec. intervals between stimulations. Before each stage in which the individual had to pay attention to a determined stimulus, only the ear at the side where attention should be focused on was stimulated for ten seconds. This was performed in order to instruct the subject on the cognitive task. Figure 1 illustrates the stimulation protocol.
The development of brain computer interfaces (BCIs) based on ASA allows patients who cannot voluntarily control eye movement to interact with the interface, since such systems are independent of vision (vision Free).7
Furthermore, hearing BCIs use a cognitive task inherent to all human beings, without the need for intensive training for performing the attention task.8 Some researchers have sought
to develop BCIs with auditory stimulus as an alternative to visual stimulus.8–13 In the study by Hill et al.9 sequences of
auditory stimulus were generated in two sound sources (left and right), while the subjects were instructed to focus on one of these, making thus a binary choice. This study showed that
the EEG signals from an untrained patient could be classified
with good accuracy by using Support Vector Machines. Kanoh et al,10 in a similar paradigm, evaluated the peak of P300 (an
event related potential component elicited in the process of decision making) as a feature to classify the selective attention of a subject, reaching a 95%-success rate. Another group of researchers tried to modify the P300-speller paradigm in an auditory version.11 In this study, differently from the
studies based on visual stimulation with a matrix display of characters, different auditory stimuli, each one associated with a distinct task, have been used and tasks were performed based on the stimulus the volunteer was focusing attention to. Spatial hearing has also been studied as a new paradigm of auditory BCI by Schreuder at al,12 who used eight speakers
spatially distributed around a volunteer; the sound source
on which the individual focused was then detected. Lopez et al.8 investigated whether the ASSR would be modulated by
selective attention and discussed the possibility of using these responses as a new type of BCI. In this study, which included 8 volunteers, distinct amplitude modulated (AM) tones were applied to each ear, with modulation frequencies around 40 Hz, applied simultaneously. The participants were instructed to focus attention only on one of the stimuli (left or right ear) or to ignore both, according to the instructions that appeared on a monitor. In six of the eight volunteers, spectral power density of the alpha rhythm was inversely proportional to the modulation frequency for the left ear, showing that selective attention could modulate the ASSR. They also showed, using Self Organizing Maps, that the conditions of with- and
without-attention could be clearly classified into two groups,
demonstrating the possibility of using the ASSR as a new paradigm for BCI. In a more recent study, Kim et al,7 evaluated
the effect of attention in ASSR and observed an energy increase in the stimulation frequency that was associated with the stimulus on which the subject was focusing. In this work the
first online auditory BCI was also developed.
An alternative technique suitable for BCI applications is Spatial Coherence.14 Spatial coherence is an objective method
to detect the side where a subject is focusing attention. This method takes into consideration the Coherence Function15
Figure 1 - Timeline to the auditory stimulus. Stimulation of the left ear (top) and right ear (bottom), with carrier frequencies of 500 Hz modulated at 32 Hz and 2000 Hz modulated at 38 Hz, respectively.
Coherence function. The coherence function estimate between two random, discrete-time signals, x[n] and y[n], can be estimated with the familiar approach of partitioning them into M non-overlapping segments as:15
where Xi(f) and Yi(f) are, respectively, the ith
-window Fourier Transform of x[n] and y[n] and “^” and “*” superscript mean, respectively, estimation and complex conjugate.
In this work, y[n] refers to the EEG signal and x[n]
reflects the stimulation signal. In order to perform the
calculations, we have simulated the stimulation signal with a sinusoid with the same frequency as the modulation frequency. Thus we perform two kinds of estimates of coherence: with or without overlapping windows. When the analysis involved overlapping windows, Equation 1 was used. In the non-overlapping estimation, the coherence function is equivalent to the well-known magnitude-squared coherence and the simpler equation provided in Dobie & Wilson18 was used instead.
Spatial Coherence. Spatial coherence is defined as a vectorial spectral measurement that takes into account both the coherence value in each electrode and its spatial location on the scalp. According to Felix et al,14 each
vector is defined by a magnitude equal to coherence value at a given electrode and direction given by the strait line connecting the vertex (electrode Cz) and that electrode. Spatial coherence is then defined as the resultant vector of the summation involving all electrodes. Thus,
(1)
where N represents the number of channels used
for the calculation of spatial coherence, “Ai” is the distance from each electrode to the vertex and “θi” is the angle of each electrode to the vertex. The amount of coherence λ
is equal to and the subscripts “no-attention” and “attention” are the coherence function estimated before and during the selective attention protocol (refer to Fig. 1 to further details), respectively. Thus, spatial coherence is a resulting vector that will point to the region of the scalp of greater synchronism for the frequency f0 in analysis.14
In order to obtain a binary classification of the focus
of attention, i.e. to the left or to the right, an attention index based on the spatial coherence was used. The attention index is calculated by taking only the real part, i.e. the projection on the x axis. Thus, it only considers inter-hemispherical changes and was developed based on reports that attention causes a contralateral modulation in the ASSR.14 Hence, if the index results in a positive value
( pointing to the right), it indicates attention to the left stimulus (contralateral). Conversely, if the index is negative (pointing to the left), it indicates attention to the right stimulus.
Performance measurements
Information Transfer Rate (ITR). ITR measures the amount of information transmitted/received by the interface per unit time and it is considered as a standard measure for communication systems. According to
Obermaier et al,19 this rate depends on the accuracy and
speed of the interface. For a BCI with K commands (in in this study, K=2 because the commands are focusing either on left or right ear stimulation) and with s commands being
executed per minute; where each command is decoded
correctly with hit rate P, the rate of transfer of information, in bits/minute is given as:
This equation shows that, for a given hit rate P, the ITR increases with increasing the number K of commands. On the other hand, for a given number of commands (K), the higher the number of hit rates (P) the higher the ITR of the system will be. It can be seen from Equation 3 that the maximum value of the ITR is . In practice, a large K implies a hit rate reduction of the system. Therefore, one should take into account the compromise between the number of commands and the hit rate to obtain the best
suitable configuration BCI.
Area under the Receiver Operating Characteristic (ROC) curve. Another metric used to compare the results of the detectors is the Area under the ROC curve (AUC). With the ROC curve it is possible to analyze the performance of a particular sensor in terms of its sensitivity and specificity. However, in order to compare the performance of different detection methods it is more appropriate to use the AUC.20 In the present
work the AUC was calculated for the detectors with varying the number of windows used from 2 to 20. The AUC was estimated by means of numerical integration (trapezoidal rule).
■
RESULTSAll possible electrode combinations were evaluated by exhaustive search throughout the subjects. The combination that led to the best results was found to be the channels T3, F3, P3, O1, T4, P4, O2, Fz and Pz.
In order to evaluate the application of the method
developed as a classifier for BCI the ITR was estimated
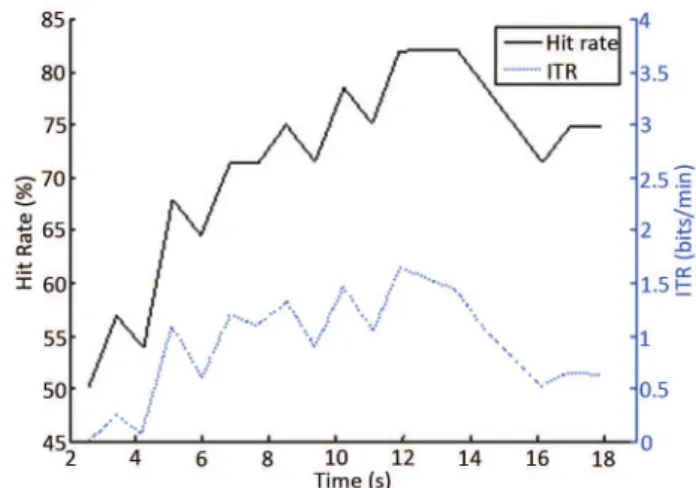
according to Equation 3 and the results are shown in Figure 2 together with hit rates. The results show a maximum ITR of 1.89 bits/minute, hit rate of 82% using 10.21 sec. of signals.
In addition, we evaluated the use of overlapping windows in the estimation of coherence function for the attention index calculations. The values of hit rate and the ITR for the detector with 50% overlap (best result) are shown in Figure 3. The results indicate maximum value of 1.63 bits/minute in signals with duration of 11.92 sec. with hit rate of 82%.
(3)
Figure 2 - Hit rate and ITR versus time to classify the state of attention.
Figure 3 - Hit rate and ITR versus time to classify the state of attention. Results obtained
with overlapping coherence estimated 50%.
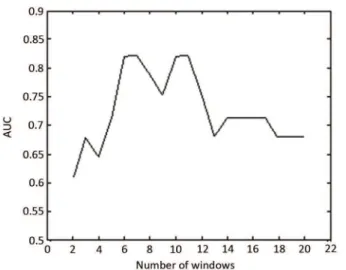
The average AUCs for all subjects are shown in Figs. 4 and 5 using non-overlap and overlapping windows, respectively. The level of overlapping which lead to the best results was also 50% and was then used in this study. In both cases, the AUC was always greater than 0.60 (0.50 in AUC is a random detector) for all numbers of windows.
The mean AUC for the overlapping classifier was 0.75; while for the classifier without overlapping the average was
0.72. The maximum AUC was also greater for the detector with overlapping, with maximum area of 0,857 (with 13 windows with 11.92 s of duration) versus 0.821 (with 7 windows or 11.92 s) in detector with no-overlap.
■
DISCUSSION■
CONCLUSIONSpatial Coherence successfully detected the focus of
attention, and it seemed useful as a classifier of the attention
condition for vision-free BCI. The obtained hit rates and ITR may be considered appropriate, with a maximum value of 82% and 1.89 bits/min (comparable with the similar method of Kim et al.7).
The results from Figures 2-3 lead to the conclusion that the system does not improve its information transfer (ITR) with overlapping windows, since the ITRs are quite similar. However, Figs 4-5 show that a better detector regarding sensivity versus specificity can be obtained by using 50% overlapping between consecutive data windows. Thus, taking into consideration the comparative data from Figures 2-5, one may conclude that 50% overlapping is a suitable choice for estimating the spatial coherence and consequently for this BCI system, since more accuracy can be obtained with nearly the same duration of exam.
■
AUTHOR CONTRIBUTIONFelix LB: responsible for planning the research,
writing the article and co-supervising Ranaudo FS; d’Affonsêca Netto A: responsible for signal processing;
Ranaudo FS: responsible for data collection, literature
review and algorithm implementation; Miranda de Sá
AMFL: responsible for reviewing and correcting the article
and supervising Ranaudo FS and d’Affonsêca Netto A.
■
CONFLICT OF INTERESTAuthors declare no conflict of interest regarding this
publication.
INTERFACE CÉREBRO-COMPUTADOR BASEADA EM COERÊNCIA ESPACIAL USANDO ATENÇÃO AUDITIVA SELETIVA
O desenvolvimento de interfaces cérebro computador (BCI), com base em atenção seletiva auditiva (ASA), auxilia pacientes que não conseguem controlar voluntariamente o movimento do olho para interagir com interfaces visuais, uma vez que tais sistemas são independentes de visão.
A Coerência Espacial é técnica alternativa adequada para aplicações BCI, tal técnica é usada em eletroencefalograma (EEG) para detectar o lado, ou
hemisfério, em que o sujeito está focalizando atenção. Este
método leva em consideração a função de coerência e a
distribuição topográfica das respostas entre os eletrodos de EEG. Neste estudo foram coletados sinais EEG de 14
homens adultos com idade entre 19 e 28 anos com aplicação de estímulos sonoros, tons em amplitude modulada (AM)
Figure 4 - Mean AUC of the classiier for all volunteers as a function of the number of windows. Non-overlapping windows.
Figure 5 - Mean AUC of the classiier for all volunteers as a function of the number of windows. Overlapping windows (50%).
Hence, it is clearly affected by the set of electrodes used. Thus, in this study, all possible electrode combinations were evaluated by exhaustive search throughout the subjects. The combination that led to the best results was found to be the channels T3, F3, P3, O1, T4, P4, O2, Fz and Pz.
Although the ITR values are relatively lower when compared to other BCIs, such as the visual evoked potentials based ones, such values are consistent with other ones in the literature (e.g., Kim et al.13).
In Felix et al.14 the spatial coherence was developed
com frequência de modulação e portadora 32/500 Hz na orelha esquerda e 38/2000 Hz na orelha direita. A coerência espacial foi usada em um sistema BCI on-line com ASSR
modulada pela atenção seletiva auditiva. Neste trabalho,
foi abordado a taxa de transferência de informação (ITR) e os efeitos de sobreposição de janelas nas estimativas da coerência com objetivo de reduzir a duração do ensaio e aumentar a ITR. Conclui-se que a coerência espacial pode útil para detecção do foco de atenção, aplicado a BCI. As
taxas de sensibilidade e ITR máximas são de 82% e 1,89 bits/min. Neste caso a melhor sensibilidade e especificidade
foram obtidas com 50% de sobreposição entre as janelas nas estimativas da coerência.
■
REFERENCES1. Bronkhorst AW. The Cocktail Party Phenomenon: A Review of Resear-ch on SpeeResear-ch Intelligibility in Multiple-Talker Conditions. Acta Acust
United Acust. 2000;86(1):117-28.
2. Giard MH, Fort A, Mouchetant-Rostaing Y, Pernier J. Neurophysiological
mechanisms of auditory selective attention in humans. Front Biosci J
Virtual Libr. 2000;5:D84–94.
3. Picton TW, John MS, Dimitrijevic A, Purcell D. Human auditory
steady--state responses. Int J Audiol. 2003;42(4):177–219.
4. Wolpaw JR, Birbaumer N, McFarland DJ, Pfurtscheller G, Vaughan
TM. Brain-computer interfaces for communication and control. Clin
Neurophysiol Off J Int Fed Clin Neurophysiol. 2002;113(6):767–91.
5. Linden RD, Picton TW, Hamel G, Campbell KB. Human auditory steady-state evoked potentials during selective attention. Electroencephalogr
Clin Neurophysiol. 1987;66(2):145–59.
6. Ross B, Picton TW, Herdman AT, Pantev C. The effect of attention on
the auditory steady-state response. Neurol Clin Neurophysiol NCN. 2004;2004:22.
7. Kim D-W, Cho J-H, Hwang H-J, Lim J-H, Im C-H. A vision-free brain--computer interface (BCI) paradigm based on auditory selective
attention. Conf Proc Annu IEEE Eng Med Biol Soc. 2011;2011:3684–7.
8. Lopez M-A, Pomares H, Pelayo F, Urquiza J, Perez J. Evidences of cognitive effects over auditory steady-state responses by means of
artificial neural networks and its use in brain–computer interfaces. Neurocomputing. 2009;72(16–18):3617–23.
9. Hill NJ, Lal TN, Bierig K, Birbaumer N, Schölkopf B. An Auditory Paradigm
for Brain--Computer Interfaces [Internet]. 2004 [cited 2015 Jan 12]. Available from: http://eprints.pascal-network.org/archive/00000407/ 10. Kanoh S, Miyamoto K, Yoshinobu T. A brain-computer interface (BCI) sys-tem based on auditory stream segregation. Conf Proc Annu Int Conf IEEE
Eng Med Biol Soc IEEE Eng Med Biol Soc Annu Conf. 2008;2008:642–5. 11. Klobassa DS, Vaughan TM, Brunner P, Schwartz NE, Wolpaw JR, Neu -per C, et al. Toward a high-throughput auditory P300-based
brain--computer interface. Clin Neurophysiol Off J Int Fed Clin Neurophysiol. 2009;120(7):1252–61.
12. Schreuder M, Blankertz B, Tangermann M. A New Auditory Multi-Class
Brain-Computer Interface Paradigm: Spatial Hearing as an Informative
Cue. PLoS ONE. 2010;5(4):e9813.
13. Kim D-W, Hwang H-J, Lim J-H, Lee Y-H, Jung K-Y, Im C-H. Classification
of selective attention to auditory stimuli: toward vision-free brain-computer interfacing. J Neurosci Methods. 2011;197(1):180–5.
14. Felix LB, de Souza Ranaudo F, D’affonseca Netto A, Ferreira Leite Miranda de Sá AM. A spatial approach of magnitude-squared coherence applied
to selective attention detection. J Neurosci Methods. 2014;229:28–32.
15. Jenkins GM, Watts DG. Spectral analysis and its applications. San
Francisco: Holden-Day; 1968.
16. Van Dun B, Wouters J, Moonen M. Optimal electrode selection for multi-channel electroencephalogram based detection of auditory steady-state responses. J Acoust Soc Am. 2009;126(1):254–68.
17. Felix LB, Moraes JE, Miranda de Sá AMFL, Yehia HC, Moraes MFD. Avoid-ing spectral leakage in objective detection of auditory steady-state evoked responses in the inferior colliculus of rat using coherence. J
Neurosci Methods. 2005;144(2):249–55.
18. Dobie RA, Wilson MJ. Analysis of auditory evoked potentials by
magnitude-squared coherence. Ear Hear. 1989;10(1):2–13.
19. Obermaier B, Neuper C, Guger C, Pfurtscheller G. Information transfer rate in a five-classes brain-computer interface. IEEE Trans Neural Syst Rehabil Eng Publ IEEE Eng Med Biol Soc. 2001;9(3):283–8.
20. Hanley JA, McNeil BJ. A method of comparing the areas under receiver
operating characteristic curves derived from the same cases. Radiol.