w ww.e l s e v i e r . c o m / l o c a t e / b j p
Original
Article
Comparative
study
of
Passiflora
taxa
leaves:
II.
A
chromatographic
profile
Luma
Wosch
a,
Kely
Cristina
dos
Santos
a,
Daniela
Cristina
Imig
b,
Cid
Aimbiré
M.
Santos
a,∗ aLaboratóriodeFarmacognosia,DepartamentodeFarmácia,UniversidadeFederaldoParaná,Curitiba,PR,BrazilbDepartamentodeBotânica,UniversidadeFederaldoParaná,Curitiba,PR,Brazil
a
r
t
i
c
l
e
i
n
f
o
Articlehistory:
Received2February2016 Accepted28June2016 Availableonline28July2016
Keywords: Passiflora Passionfruit Qualitycontrol
Thin-layerchromatography
High-performanceliquidchromatography FlavonoidC-glycosides
a
b
s
t
r
a
c
t
Popularlyknownaspassionfruit,somespeciesofthegenusPassifloraarewidelyusedinfolkmedicines, suchassedativesandtranquilizersinmanycountries.Althoughtheseplantsareemployedforthesame purposes,researchwithdifferentspeciesofPassiflorahasindicatedtheirheterogeneouschemical com-positions.Sincedifferentchemicalcompositionscanresultinvaryingdegreesoftherapeuticefficiency, qualitycontrolbasedonthechemicalconstituentsofeachspeciesisessential.Tothatend,theaimofthis studywastocomparepharmacognosticallyspeciesofPassiflorainordertoestablishachromatographic profileforthequalitycontrolofdrugsinherbalmedicinescontainingpassionfruit.Thestudywas con-ductedbycollectingsamplesofleavesfromtwelvePassiflorataxa(i.e.,tenspeciesandtwoformsofP.
edulis)–P.actinia,P.alata,P.amethystina,P.capsularis,P.cincinnata,P.edulisf.flavicarpa,P.edulisf.edulis,
P.incarnata,P.morifolia,P.urnifolia,P.coccinea,andP.setacea–fromdifferentlocationsandobtainingtheir
chromatographicprofilesviathin-layerchromatographyandhigh-performanceliquidchromatography. BothmethodsusedtheflavonoidC-glycosidesisoorientin,orientin,vitexin,andisovitexinasreference compoundsandcouldultimatelyestablishspecificprofilesforeachspecies.Thechromatographic anal-ysesdiscussedherecanbeusedtoassistindeterminingthequalityandauthenticityofherbaldrugs derivedfromPassifloraspecies.
©2016SociedadeBrasileiradeFarmacognosia.PublishedbyElsevierEditoraLtda.Thisisanopen accessarticleundertheCCBY-NC-NDlicense(http://creativecommons.org/licenses/by-nc-nd/4.0/).
Introduction
BelongingtoPassifloraceaefamily,thegenusPassiflora encom-passesnearly600species(UlmerandMacDougal,2004).Popularly knownaspassionfruit,invariouscountriessomeofthesespecies arewidelyusedinfolkmedicines,typicallyassedativesand tran-quilizers (Conrado et al.,2003). AlthoughPassiflora species are employedfor the samepurposes, investigations have indicated their heterogeneous chemical compositions (Wohlmuth et al., 2010;Lietal.,2011;Zucolottoetal.,2012).Sincedifferentchemical compositionscan result in varying degrees of therapeutic effi-ciency,itiscriticaltoidentifyanddifferentiatespeciesofthegenus. To achieve such identification and differentiation, pharma-cobotanicaltools and chromatographic analysis can offergreat insights,particularlyinregardtoPassifloraspecies(Woschetal., 2015).However,withthesemeans,onceoriginalplantmaterial is processed into a powder or when contaminants are present withsimilarmorphoanatomiccharacteristics,whichoftenoccurs
∗ Correspondingauthor.
E-mail:[email protected](C.A.M.Santos).
accidentally (Veiga et al., 2005), pharmacobotanical tools can-notsufficientlyauthenticatespecies(SucherandCarles,2008).In suchcases,itisnecessarytouseanalyticalmethodstoassessthe qualitativeandquantitativecompositionofeachplant’schemical constituents.
Tothatend,chromatographicanalysiscancontributeto devel-oping chemical profiles that aid in distinguishing species. The significance of applying chromatographic analysis also extends tosecondary metabolites, which representa chemical interface betweenaplantanditssurroundingenvironmentandwhose syn-thesisisoftenaffectedbyenvironmentalconditions.Assuch,both seasonaland dailyintraplant,intraspecies,and interspecies dif-ferences can affect thetotal content or relative proportions of secondaryplantmetabolites,ifnotboth.Eveninthepresenceof ageneticcontrol,chemicalconstituentscanbeexpressedin differ-entways owingtotheinteractionofbiochemical,physiological, ecological,and evolutionaryprocesses,which areconsideredto largely compromise anyconstancy in theconcentrationof sec-ondarymetabolites(Gobbo-NetoandLopes,2007).
Sinceenvironmentalfactorsaffectthefinalcontentofsecondary metabolitesinmedicinalplants,theycanalsosignificantlyaffect thequalityandtherapeuticvalueofherbalpreparations.Toobtain
http://dx.doi.org/10.1016/j.bjp.2016.06.007
qualitativeandquantitativedifferencesamongspeciesare excel-lentchemicalmarkers(Qiminetal.,1991;BokstallerandSchmidt, 1997).Thus,theobjectiveofourstudywastoanalyzetwelve Pas-sifloraspeciesbyusingTLCandHPLC,therebyenablingeffective qualitycontrolforitsleaves,allinordertocontributetothequality ofherbalproductscontainingpassionfruit.
Thin-layerchromatography
Toextract,1mlof60%ethanolwasaddedto200mgofeach sample.Themixtureswerevortexingfor10s,andthesampleswere extractedfor10minwithultrasoundequipment.Afterdecanting,
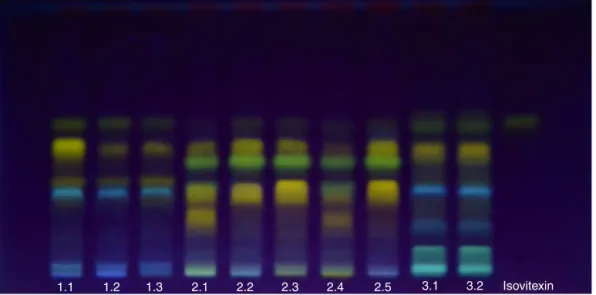
1.1 1.2 1.3 2.1 2.2 2.3 2.4 2.5 3.1 3.2 Isovitexin
Fig.1.Thin-layerchromatographyprofileofSamples1.1–1.3(Passifloraactinia),Samples2.1–2.5(P.alata),andSamples3.1–3.2(P.amethystina)usingEluentSystem1,with isovitexinasthestandard.
3.3
4.1
4.2
4.3
4.4
5
6.1
6.2
6.3
6.4
Vitexin
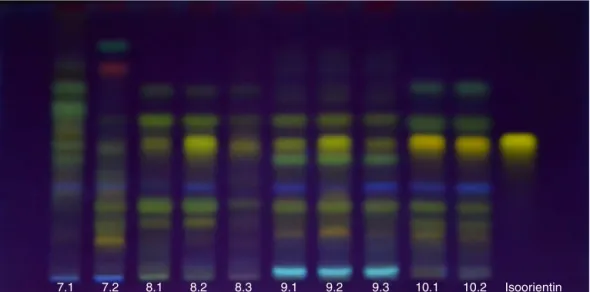
7.1 7.2 8.1 8.2 8.3 9.1 9.2 9.3 10.1 10.2 Isoorientin
Fig.3.Thin-layerchromatographyprofileofSamples7.1–7.2(Passifloraedulisf.edulis),Samples8.1–8.3(P.incarnata),Samples9.1–9.3(P.morifolia),andSamples10.1–10.2 (P.urnifolia)usingEluentSystem1,withisoorientinasthestandard.
about2lofthesupernatantobtainedwasappliedto
chromato-platesintheformofbands.Silicagel60aluminumplateswere used at 20cm×20cm, without any fluorescence indicator for
high-performancethin layer chromatography(HPTLC) (Merck®, Darmstadt,Germany,art.5547).
Thesystemwaskeptclosedduringanalysis.Activatedplates wereheldinanovenat90◦Cfor90min,andthetemperatureand humiditywerekeptconstantat20◦Cand50%,respectively.The distancetraveledbytheeluentwasstandardizedto9cm.Two dif-ferenteluentsystems(ES)wereused:oneofethylacetate,acetone, aceticacid,andwaterinaratioof6:2:1:1(Gosmannetal.,2011) andtheother–anadjustmentofthemobilephaseproposedby WagnerandBladt(1996)–ofethylacetate,aceticacid,formicacid, andwaterinaratioof10:1.1:1.1:2.5.
Afterthecompleteevaporationofthesolvents,theplateswere revealedwithdiphenylboriloxietilamine1%inMeOHandlaterwith 5%polyethyleneglycol4000in EtOH(WagnerandBladt,1996). ObservationsweremadeunderUV365nm.
High-performanceliquidchromatography
Toextract,8mlof60%ethanolwasaddedto200mgofthe sam-ple.Themixturewasvortexingfor15s,andthesamplesextracted for30mininultrasoundequipment.Theextractwasfiltered,and thevolume wascompletedto10ml with60% ethanol.Samples werefilteredthroughaMillex®
LCRwithmembranefilterPTFE of0.45m,packedinamberglassbottlesat4◦Cuntilthetimeof analysis,andatthattime,injectedat20mg/ml.
Adaptedfromthe methodproposedbyMuller et al.(2005), ourmethodofdeterminingflavonoidisovitexininPassifloraactinia
extractswasdevelopedandvalidatedbyourresearchgroup.Later, themobilephaseconsistedofagradientof0.5%aceticacidinMilliQ water(A),methanol(B),andacetonitrile(C)at0minwith75%(A), 15%(B)and10%(C),at25minwith62%(A),20%(B)and18%(C), andat30minwith75%(A),15%(B)and10%(C).Theflowratewas 1ml/minforarunningtimeof30minwithadetectionwavelength of340nm.
AnalyseswereperformedwithVarianProStarGradient equip-ment,aProStar230pump,andaphotodiodearraydetector335 (ColumnKromasil®100,5
mC-18[250mm×4.6mmin
diame-ter]).
10.3 11 12 Orientin
Fig.4. Thin-layerchromatographyprofileofSamples10.3(Passifloraurnifolia), Sam-ple11(P.coccinea),andSample12(P.setacea)usingEluentSystem1,withorientin asthestandard.
Spectralanalysis
SpectralanalyseswereperformedusingtheStar Chromatog-raphy Workstation for data acquisition within Varian ProStar GradientHPLC.
Standards
1.1 1.2 1.3 2.1 2.2 2.3 2.4 2.5 3.1 3.2 Isovitexin
Fig.5. Thin-layerchromatographyprofileofSamples1.1–1.3(Passifloraactinia),Sample2.1–2.5(P.alata),andSample3.1–3.2(P.amethystina)usingEluentSystem2,with isovitexinasthestandard.
Results
Thin-layerchromatography
TheresultsobtainedwithES1appearinBox1andFigs.1–4, whereasthoseobtainedwithES2appearinBox2andFigs.5–8. BothES1andES2allowedtheobservationofdifferencesamong samples.WithES2,however,sincethebandsbecamemoredefined, itwaspossibletodisplaymorebands,whichfacilitatedthe com-parisonamongspeciesprofiles(Figs.5–8).
ThethreespecimensanalyzedforthespeciesP.actinia(Samples 1.1–1.3) showed similarchromatographic profiles. An apparent quantitativedifferencewasobservedinthesecondbandof Sam-ple 1.1 (ES 1), which presented a more intense yellow color (Figs.1and5).AccordingtoRfvaluesandcolor,thisbandseemed tocorrespondtothestandardisoorientin.
ThesamplesanalyzedforP.alata,bycontrast,revealed qualita-tivedifferences(Figs.1and5).However,thosesamplescouldbe dividedintotwogroupsbasedonthesimilarityoftheirprofiles: ontheonehand,Samples2.1and2.4,andontheother,Samples 2.2,2.3,and2.5.Thechiefdifferencebetweenthegroupsisthe
presenceofayellowspot(ES1,Rf0.22)oroftwobands(ES2,Rf 0.39and0.33)inSamples2.1and2.4,respectively,thatwereabsent intheothers.
SamplesofP.amethystina(3.1,3.2,and3.3)wereverysimilar (Figs.1,2and5,6).
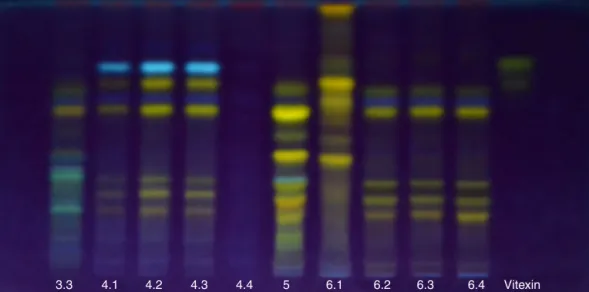
Bypresentingbandswithhardlyanydetectablestaining inten-sity,Sample4.4ofP.capsularisstandsoutfromtheotherthreeof thespecies,whichweresimilar(Figs.2and6).
ThesinglesampleofP.cincinnata studiedshowednumerous bandsonbothES1andES2(Figs.2and6).
WhereasthefirstsampleofP.edulisf.flavicarpa(6.1)differed entirelyfromtheothersbyshowingfourbandsonES1,allwith aRf(0.93,0.81, 0.70,0.59)greaterthanthelargestoftheother three samples(Samples 6.2–6.4), the others werequite similar (Figs.2and6).MostbandsinSamples6.2–6.4werenotpresent, oratleastindistinguishablefromSample6.1(Fig.2).
ThetwospecimensanalyzedforP.edulisf.edulisshowedstarkly differentprofiles.WhereasbandsofSample7.1presenteda yellow-to-greenbandconcentratedintheupperregionoftheplateand with higher Rf values, bands with yellow coloring from Sam-ple7.2 had lowerRf values (Figs.3 and 7).Moreover,asFig.3
3.3 4.1 4.2 4.3 4.4 5 6.1 6.2 6.3 6.4 Vitexin
7.1 7.2 8.1 8.2 8.3 9.1 9.2 9.3 10.1 10.2 Isoorientin
Fig.7.Thin-layerchromatographyprofileofSamples7.1–7.2(Passifloraedulisf.edulis),Samples8.1–8.3(P.incarnata),Samples9.1–9.3(P.morifolia),andSamples10.1–10.2 (P.urnifolia)usingEluentSystem2,withisoorientinasthestandard.
10.3
11
12
Orientin
Fig.8.Thin-layerchromatographyprofileofSample10.3(Passifloraurnifolia), Sam-ple11(P.coccinea),andSample12(P.setacea)usingEluentSystem2,withorientin asthestandard.
shows,with ES1 Sample7.2 revealed two bands notfound in any other sample analyzed (green and red, Rf 0.86 and 0.77, respectively).
SimilarprofileswerefoundforSamples8.1,8.2and8.3ofP. incarnata(Figs. 3and 7).A lowerintensityofstainingof bands appeared in Sample 8.3,by contrast, thus suggestingthat they havealowerconcentrationofsubstancesviewableinthin-layer chromatography methods. No significant differences were observedbetween theprofilesof P.morifolia (Samples 9.1–9.3) andP.urnifolia(Samples10.1–10.3),asFigs.3,4,7,8illustrate.
Lastly,markeddifferenceswereobservableamongspecimens ofP.coccinea(11)andP.setacea(12).Intermsofthebandwith lowerRfvalues,twowereorangeandonewasorange-to-bluefor
P.coccinea,andtwowereyellowforP.setaceainES1(Fig.4).
High-performanceliquidchromatography
Comparisonofprofilesofeachspecies
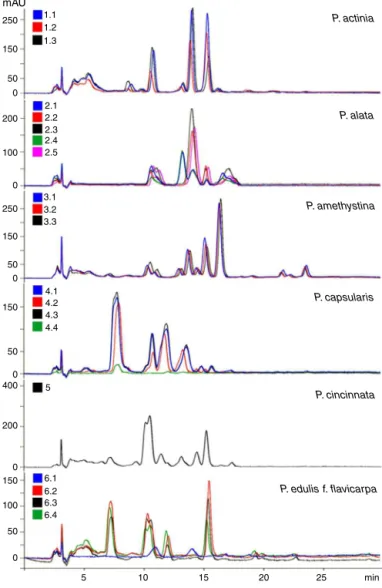
MostspecimensofeachspeciesanalyzedbyHPLCcoupledtoa diodearraydetectorshowedsimilarqualitativeprofilesandwere thereforesuperimposable(Figs.9and10).HPLCallowsthe detec-tionofqualitativedifferencesalreadyidentifiedintheflavonoid profileofsomesampleswhencomparedtootherspecimensofthe samespeciesobservedwithTLC.Suchdifferenceswereobserved inP.alata,withsamplesdividedintotwogroupsaccordingtothe similarityoftheirprofiles(Samples2.1and2.4andSamples2.2, 2.3,and2.5),aswellasinSample6.1ofP.edulisf.flavicarpa(Fig.9) andtwosamplesofP.edulisf.edulis(Fig.10).
Withallsamplesprocessedinthesamemannerandinjectedin thesameamountsandconcentrations,HPLCallowsaquantitative comparativeanalysisofsampleswithgreaterreliabilitythanthat achievedwithTLC.
Sample 4.4 of P. capsularis presented the most significant quantitativevariation(Fig.9).Overlappingofthechromatograms obtainedforthisspeciesallowedthevisualizationofpeaksin4.4at thesameretentiontimesofthosefoundinothersamples(Fig.11). Givenitslowersensitivity,TLCdidnotpermitsuchvisualization.
Sample8.3ofP.incarnatashowedpronouncedquantitative dif-ferencescompared toSamples8.1and 8.2,chieflybydisplaying lessintensepeaks(Fig.10).Othervariationsobservedwereless significant.
Comparisonofspeciesbycoinjectionwithstandard
Coinjections with standards—that is, at least one flavonoid glycoside—allowedacorrelationofsomepeaksineachprofile,as summarizedinBox3.
Peakswerecoloredaccordingwiththeflavonoidsidentifiedby coinjection:blueforisovitexin,pinkforvitexin,greenfor isoori-entin,andpurplefororientin(Figs.12and13).Partiallycolored peakswerepartiallyco-elutedwithstandards,whereasbicolored peakswereco-elutedwithtwostandards.
Spectralanalysis
50 0
150
50 0 400
200
0 150 100
50
0
5 6.4 6.3 6.2 6.1 5 4.4 4.3 4.2 4.1
10 15 20 25 min
P. capsularis
P. cincinnata
P. edulis f. flavicarpa
Fig.9.Overlayofthechromatogramsobtainedbyhigh-performanceliquid chro-matographyforsamplesofPassifloraactinia,P.alata,P.amethystina,P.capsularis, andP.cincinnatacomparedtoP.incarnataandP.edulisf.flavicarpa.
pureness.Regardingpeaksco-elutedwithisoorientinandorientin, purityvariedaccordingtothechromatogramanalyzed.
ForP.actinia,Peak3 relatedtoisoorientinand,though sym-metrical, exhibited a shift in spectral profile from 276/348 to 278/341nm at its right end. Peak 3, of P. capsularis, was also
600 0 500 1000 0
300
0
300
100 0
5 12 11 10.3 10.1 10.2
10 15 20 25 min
P. setacea P. urnifolia
P. cocciea
Fig.10.Overlayofthechromatogramsobtainedbyhigh-performanceliquid chro-matographyforsamplesofPassifloraedulisf.edulis,P.incarnata,P.morifolia,P. urnifolia,P.coccinea,andP.setacea.
comprisedoftwoseparatespectra,meaningthatitdidnot cor-respondonlytoorientin.
Peak2fromSample2.1ofP.alatashowedaverysimilar spec-trumtoPeak3(275/343nmforPeak2and275/345nmforPeak3), thussuggestingthatitcouldbeasubstancewithastructuresimilar tothatofvitexin.
mAU
150
50 0 20
10
0
5 10
Sample 4.4 Sample 4.2
15 20 25 min
L.
Wosch
et
al.
/
Revista
Brasileira
de
Farmacognosia
27
(2017)
40–49
Box1
Summaryofresultsobtainedwiththin-layerchromatographyusingEluentSystem1fortwelvePassifloraspecies.
Species Sample(s) Numberofmajorbands Color Rfa Standardsassigned
P.actinia 1.1,1.2and1.3 6 Yel-Gn;yellow;yellow;BBe;yellow;Be 0.57;0.49;0.35;0.32;0.28;0.04 Isoorientin,isovitexin
P.alata 2.12.2,and2.3and2.42.5 55 Yel-Gn;Yel-Gn;yellow;Be;yellowGn;Gn;Yel-Gn;Yel Yel 0.57;0.57;0.51;0.49;0.49;0.41;0.41;0.31;0.310.22 Isoorientin,Isoorientin,isovitexinisovitexin
P.amethystina 3.1,3.2and3.3 5 Yel-Gn;Yel;BBe;Be;BGn 0.57;0.49;0.32;0.19;0.10 Isoorientin,isovitexin
P.capsularis 4.1,4.2and4.3 3 Yel;BBe;Yel 0.49;0.33;0.15 Isoorientin
P.cincinnata 5 6 Yel-Gn;Yel;Yel-Gn;Oe;Yel-Gn;Oe 0.57;0.49;0.44;0.33;0.26;0.16 isoorientin,isovitexin
P.edulisf. flavicarpa
6.1 7 Oe;Be;Yel-Gn;Oe;Yel;Oe;Oe 0.93;0.81;0.70;0.59;0.43;0.31;0.15 Isoorientin,isovitexin
6.2,6.3and6.4 7 Yel-Gn;Yel;BBe;Yel-Gn;Bn;Yel-Gn;Oe 0.57;0.49;0.33;0.26;0.22;0.19;0.15 Isoorientin,isovitexin P.edulisf.
edulis
7.1 8 Gn;Bn;Gn;Gn;Oe;Gn;Gn;BBe 0.78;0.75;0.70;0.62;0.52;0.49;0.45;0.34 Vitexin
7.2 8 Gn;Yel;Yel-Gn;Yel-Gn;BBe;Yel-Gn;Yel-Gn;Oe 0.86;0.77;0.58;0.47;0.34;0.27;0.19;0.14 Isovitexin
P.incarnata 8.18.3and8.2 56 Yel-Gn;Yel-Gn;Yel-Gn;Yel-Gn;Yel;Yel;BBe;Yel-Gn;Yel-Gn;Yel Yel 0.69;0.69;0.57;0.57;0.50;0.50;0.27;0.33;0.210.27;0.20 Isoorientin,Isoorientin,vitexin,vitexin,isovitexinisovitexin
P.morifolia 9.1,9.2and9.3 9 Yel;Yel;Yel;Yel;Yel-Gn;BBe;Yel-Gn;Oe;BGn 0.80;0.68;0.58;0.50;0.44;0.33;0.27;0.16 Isoorientin,vitexin,isovitexin
P.urnifolia 10.1,10.2and10.3 7 Gn;Yel-Gn;Yel;BBe;Yel;Yel;Oe 0.71;0.57;0.50;0.33;0.27;0.19;0.16 Isoorientin,isovitexin
P.cocinea 11 6 Yel;Yel;BBe;Oe;Be;Oe 0.59;0.51;0.35;0.33;0.26;0.17 Isoorientin,isovitexin
P.setacea 12 6 Yel;Yel;Yel;BBe;Yel;Yel 0.59;0.51;0.38;0.35;0.30;0.20 Isoorientin,isovitexin
Standards
Isovitexin 1 Yel-Gn 0.57
Vitexin 1 Yel-Gn 0.69
Isoorientin 1 Yel 0.50
Orientin 1 Yel 0.60
Yel,yellow;Yel-Gn,greenishyellow;Oe,orange;Be,blue;BBe,brightblue;Gn,green;BGn,brightgreen;Bn,brown. aDataarepresentedinorderofappearance,fromtoptobottom,onthechromatographicplate.
Box2
Summaryofresultsobtainedwiththin-layerchromatographyusingEluentSystem2fortwelvePassifloraspecies.
Species Sample(s) Numberofmajorbands Color Rfa Standardsassigned
P.actinia 1.1,1.2and1.3 7 Yel-Gn;Be;Yel;Red;Yel-Gn;Yel-Gn;Be 0.66;0.62;0.59;0.47;0.42;0.36;0.04 Isoorientin,isovitexin
P.alata 2.12.2,and2.3and2.42.5 75 Yel-Gn;Yel-Gn;Be;Be;Yel;Yel;Gn;Gn;Yel;Yel;Gn;Yel 0.66;0.66;0.62;0.62;0.59;0.59;0.50;0.50;0.420.42;0.39;0.33 Isoorientin,Isoorientin,isovitexinisovitexin
P.amethystina 3.1,3.2and3.3 9 Be;Yel-Gn;Be;Yel;Yel;Yel-Gn;BGn;BGn;Be 0.71;0.66;0.62;0.59;0.50;0.42;0.34;0.22;0.07 Isoorientin,isovitexin
P.capsularis 4.1,4.2and4.3 7 BBe;Yel;Be;Yel;Yel;Yel;Oe 0.76;0.70;0.65;0.61;0.35;0.31;0.24 Isoorientin,orientin
P.cincinnata 5 10 Yel;Be;Yel;Yel;Yel;Be;Yel;Oe;Yel;Yel 0.68;0.65;0.61;0.52;0.45;0.36;0.33;0.28;0.21;0.13 Isoorientin,isovitexin P.edulisf.
flavicarpa
6.1 8 Oe;Yel;Yel;Yel;Yel;Yel;Oe;Yel 0.98;0.91;0.86;0.78;0.71;0.62;0.50;0.43 Isoorientin,isovitexin
6.2,6.3and6.4 7 Yel;Be;Yel;Yel;Bn;Yel;Oe 0.68;0.65;0.60;0.34;0.32;0.29;0.23 Isoorientin,isovitexin
P.edulisf. edulis
7.1 11 Oe;Bn;Yel;Yel;Yel;Bn;Yel-Gn;Bn;Yel;Oe;Be 0.98;0.80;0.75;0.68;0.61;0.58;0.55;0.52;0.48;0.41;0.33 Vitexin,orientin 7.2 10 Gn;Red;Be;Yel-Gn;Gn;Oe;Yel;Yel;Yel;Yel 0.90;0.84;0.62;0.58;0.53;0.44;0.41;0.33;0.28;0.22 –
P.incarnata 8.1and8.2 7 Yel;Yel;Be;Yel;Yel;Yel;Yel 0.77;0.67;0.62;0.59;0.37;0.33;0.27 Isoorientin,vitexin,isovitexin
8.3 6 Yel;Yel;Yel;Yel;Yel;Yel 0.77;0.67;0.59;0.37;0.33;0.27
P.morifolia 9.1,9.2and9.3 10 Yel;Yel;Yel;Be;Yel;Yel-Gn;Oe;BBe;Yel;Oe 0.82;0.75;0.67;0.63;0.59;0.50;0.41;0.36;0.32;0.26 Isoorientin,vitexin,isovitexin
P.urnifolia 10.1,10.2and10.3 6 Yel-Gn;Yel-Gn;Yel;Yel;Yel;Yel 0.77;0.65;0.58;0.34;0.28;0.23 Isoorientin,isovitexin
P.cocinea 11 7 BBe;Yel-Gn;Yel;Be;Oe;Yel;Oe 0.96;0.64;0.57;0.48;0.43;0.39;0.28 Isoorientin,isovitexin
P.setacea 12 8 BBe;Yel-Gn;BBe;Yel;BBe;Yel-Gn;Yel;Yel 0.96;0.65;0.62;0.58;0.48;0.42;0.37;0.30 Isoorientin,isovitexin
Standards
Isovitexin Yel,Yel-Gn 0.66
Vitexin Yel-Gn 0.78
Isoorientin Yel 0.58
Orientin Yel 0.68
Roseflora Isoorientin,isovitexin
P. actinia
P. alata 2.1
P. alata 2.2
P. amethystina
P. capsularis
P. cincinnata
P. edulis f. flavicarpa 6.1
P. edulis f. flavicarpa 6.2 mAU 250 3 3 3 3 3 3 3 4 4 4 4 4 4 4 5 5 5 5 5 5 5
5 10 15 20 25 min
6 6 6 7 9 8 8 7 6 1 1 1 1 1 1 1 1 2 2 2 2 2 2 2 2 100 0 100 50 0 150 50 0 250 100 0 150 75 0 250 100 0 50 0 150 75 0
Fig. 12.Comparison of different chromatographicprofiles obtained by high-performanceliquidchromatography for the speciesPassiflora actinia, P.alata (Samples2.1and2.2),P.amethystina,P.capsularis,P.cincinnata,andP.edulisf.
flavi-carpa(Samples6.2and6.1).Peaksareidentifiedbycoinjectionwithstandard:green
forisoorientin,purplefororientin,pinkforvitexin,andblueforisovitexin.
P. urnifolia P. coccinea P. setacea 3 3 3 3 4 4 4 5 5 5 6 6 7
5 10 15 20 25 min
6 7 8
1 1 1 1 2 2 2 0 300 600 0 300 700 0 150 500 200 0
Fig. 13.Comparison of different chromatographic profilesobtained by high-performanceliquidchromatographyforthespeciesPassifloraedulisf.edulis(7.2),
P.incarnata,P.morifolia,P.urnifolia,P.coccinea,andP.setacea.Peaksidentifiedby
coinjectionwithstandard:greenforisoorientin,purplefororientin,pinkforvitexin, andblueforisovitexin.
Peak 7, of P. amethystina, in being unidentified, presents a spectrumwithmaximumabsorptionat277/343nm,whichwas vir-tuallyidenticaltothatofPeaks5(277/343nm)and6(276/343nm), therebycorrespondingtovitexinandisovitexin,respectively.
Peaks1–4ofP.capsulariswereimpure.Peak1probably rep-resented a flavonoid, for its spectrum presented a maximum absorptionatonly335nm.ThesameoccurredforPeak4,which presentedamaximumabsorptionat318and336nm.Peak3was contaminatedwithasubstance,whichcausedittoshowaspectrum withamaximumat320nm.
TheprofilepresentedforPeak3bySample6.2 ofP.edulisf. flavicarpashowsamaximumabsorptionatonly279nm,whichis inconsistentwiththatofflavonoids.
Only Peak 4 of P. edulis f. edulis (Sample 7.1) presented a spectrumunliketheothers,withamaximumat276nm.Peak2, althoughasymmetrical,showedthesamespectra,withamaximum absorptionat274/346nm.
For Sample 7.2, Peaks 4 and 7 showed only an absorp-tion maximum in their spectra.Peak 3 of this sample showed a spectrum with absorptions at 280/339nm, which were rela-tivelydistantfrom275/355nm—thatis,thepatternpresentedfor isoorientin—probablycorrespondingtoaflavonoidwitharetention timeclosertothatofisoorientin.
Allotherpeaksnotquotedexhibitedtwoabsorptionmaximaat wavelengthssimilartothosepresentedbythestandards.
Discussion
Chromatographicanalysis
Asamethodinthequalitycontrolofdrugmaterials,TLCwas chosen for beingthesimplest and mosteconomical chromato-graphictechnique for rapidseparation and visualidentification (Lopes,2006).BothES1andES2allowedustodifferentiatespecies bypresenting a profileforeach. ES2 allowedthevisualization ofmorebands,whichgreatlyfacilitatedcomparison.Atthesame time,allvariationsdetectedbyHPLCwerealsoobservedwithTLC. Similarly,thetwoeluentsystemsallowedthecorrelationofsome bandswithpatternsused(Boxes1and2),whichwasalsopossible withHPLC(Box3).
For thesereasons, thetwo methods developed canbe used forthe qualitycontrol of drugsand extractsof leavesof Passi-floraspecies.Suchmethodsallowthedetectionofqualitativeand quantitativevariablesamongsamplesofthesamespeciesorform. Regardingqualitativevariations,samplesofP.alatadifferedgreatly andcouldbeplacedintwogroups,whosechiefdifferencewasthe presenceofanadditionalpeak,asinSamples2.1and2.4.Similar profilestothetwoprofilesfoundinourstudywerealsoreported byMulleretal.(2005)andMadoglio(2011),thelatterofwhom showedthatthepeakco-elutedwithstandardvitexinwas vitexin-2-O-rhamnoside.
ThespeciesP.alatapresentedavariabilityalreadywell docu-mentedintheliterature.Melettietal.(2003)foundavariationin itsmorphologicalandagronomiccharacters,whereasBellonetal. (2009)detecteditsgeneticvariability,whichismorepronounced inwildaccessionsdue tothewide geographical distributionof thespecies.Suchwell-documentedgeneticvariabilitycouldrelate tothediversityinthechemicalconstitutionofdifferentP.alata
species,andsincedifferentchemicalconstitutionscausedifferent therapeuticefficiencies,thestandardizationoftheplantextractand productdrugsisnecessarybasedontheirchemicalconstitution. Thisbecameevidentinourstudybyobservingthechromatograms ofthetwoformsofP.edulis(Figs.3,7and10)thatshowed signifi-cantchemicaldifferences,aswellasinthesamples.
Zucolottoetal.(2012)studiedthetwoformsofP.edulisand obtaineda chromatogram for P.edulis f. flavicarpa that closely resembledthatforourSamples6.2–6.4thanforourSample6.1. Theirchromatogramfor P.edulisf.eduliswasalsoclosertoour Sample7.1.Onthispoint,theauthorssuggestedthattheresultsfor thetwoformsofP.eduliswereduetoawiderangeofinter-and intrachemicalcompositionalforms.
Vianaetal.(2003)detectedgeneticvariabilityamongtheforms ofP.edulis,whichalongwiththeresultsobtainedinthisstudy indi-catetheimportanceofidentifyingtheformofthespecies,aswellas thechemicalcharacterizationandstandardizationofherbaldrugs andextractsofP.edulis.Thesedrugsandextractscouldformpart oftheconstitutionofteas,herbalremedies,orcosmetics, consider-ingthattheconcentrationandcompositionofphenolicsubstances correlatewithbiologicalactivity(Colomeuetal.,2014).
Regardingquantitativevariations,P.capsularissamplesshowed themostpronounceddifference,whichrelatedto morphoanatom-icalvariation.Sample4.4ofP.capsularisshowedpeaksatfarlower intensitiesthanthoseofSamples4.1–4.3(Figs.2,6and9),asclearly showninFig.11,inwhichthequalitativecompositionofSample 4.4greatlyresemblestothecompositionpresentedbytheothers.
Inadditiontopeakswithlowerintensities,themesophyll thick-nessofSample4.4wasnarrowerthanthatofoneothersample duetoenvironmentalinfluences.Sample4.4wascollectedfroman
Atlanticforest,whereithadgrownintheshadowoftrees,whereas theothersampleswerecollectedfromanopenspacewithdirect exposuretothesun.
Inadditiontoreportingthesamemorphoanatomicdifferences forP.capsularis,Tattinietal.(2000)showedthatthespecies Phyl-lyrealatifoliagrowninshadyspacesunderathickforestofPinus pineaorgrownin thefullsunofopendunesdemonstratedthe accumulationofflavonoidsandglandulartrichomesintheleaves. Thoseauthorsreportedthattheconcentrationofflavonoid glyco-sidesshowedasharpincreaseinleavescollectedfromsunnyplaces. Nevertheless,thecompositionofflavonoidsremainedunchanged, asinagreementwithfindingsforP.capsularisinourwork.
Suchdifferencesinconcentrationresultfromplantadaptations todifferentlightintensitiesbyregulatingtheirphysiologicalstates andchangingtheirprimaryand secondarymetabolicpathways. Indoingso,theiranabolicandcatabolicprocessesachieve their maximumfunctionalstatus(Nobel,1991).
P.incarnatasamplesalsoexhibitedquantitativevariations,as inSample8.3,whichshowedmainpeakswithlowerintensities along withUV absorption.Unlikeothers of thespecies,Sample 8.3 wasa dried extract provided by theherbalindustry, while theothertwo sampleswere collectedata cultivationsite. The detectionofproblemsincommercialextractsisnotuncommon, however.Theimportanceofqualitativeandquantitative standard-izationofflavonoidspresentinthedrugsorextractsofPassiflora
species,especiallyinpreparationsofP.incarnata,reliesonthefact thatflavonoidssuchasvitexin,isovitexin,orientin,andisoorientin contributetothedrugactivity(MenghiniandMancini,1988).
Unfortunately,itisnotunusualtodetectproblemsin commer-cialextracts.Silvaetal.(2013)testedtheeffectiveness,regardingto theprotectionoffibroblastsagainsttheeffectsofUVrays,fivegreen tea commercialextracts used to enrich formulations cosmetic, comparedtoafluidextractpreparedaccordingtothe recommenda-tionsoftheBrazilianPharmacopoeia(2010).Theauthorsobserved thattheEGCGcontentwasmuchhigherintheextractprepared accordingtothepharmacopoeia,beingtheonlyonetoshow sig-nificantantioxidantactivity.Itisevident,thus,theneedtoapply amorerigorousqualitycontrolforcommercialextracts,covering thedeterminationnotonlyqualitativebutalsoquantitativeoftheir chemicalmarkers.
EachspeciesofPassifloraanalyzedexhibitedadistinctive chro-matographicprofileofitsleaves’hydroalcoholicextracts,thereby makingitpossibletosuggestacorrelationbetweensomebandsin TLCandsomepeaksinHPLCofC-glycosylatedflavonoidssuchas isoorientin,orientin,vitexin,andisovitexin.Thesecompoundscan thereforebeusedinthequalitycontrolofrawmaterialsas chemi-calmarkersforauthenticatinganddifferentiatingspecieswiththe proposedmethods.
Conclusion
Theevaluationofthemorphologicalandanatomicalfeaturesof drugsderivedfromplantsinthegenusPassiflora,asshown previ-ously(Woschetal.,2015),whenalliedtochromatographicprofiles, cancontributetothediagnosisanddifferentiationofspecies. Vari-ationsfoundwithinthesamespeciesorwithinandbetweenforms underscoretheimportanceofconductingpharmacognostic analy-sisandstandardizingcultureconditionsofPassifloraspecieswhose productsareusedfortherapeuticpurposes.
Authors’contributions
References
Bellon,G.,Faleiro,F.G.,Peixoto,J.R.,Junqueira,K.P.,Junqueira,N.T.V.,Fonsceca,K.G., Braga,M.F.,2009.Variabilidadegenéticadeacessosobtidosdepopulac¸ões cul-tivadasesilvestresdemaracujazeiro-docecombaseemmarcadoresRAPD.Rev. Bras.Frutic.31,197–202.
Bokstaller,S.,Schmidt,P.C.,1997.Acomparativestudyofthecontentof pas-sionflower flavonoids and sesquiterpenes from valerian root extracts in pharmaceuticalpreparationsbyHPLC.Pharmazie52,552–557.
Calixto,J.B.,2000.Efficacy,safety,qualitycontrol,marketingandregulatory guide-linesforherbalmedicines(phytotherapeuticagents).Braz.J.Med.Biol.Res.33, 179–189.
Colomeu,T.C.,Figueiredo,D.,Cazarin,C.B.B.,Schumacher,N.S.G.,MarósticaJr.,M.R., Meletti,L.M.M.,Zollner,R.L.,2014.Antioxidantandanti-diabeticpotentialof PassifloraalataCurtisaqueousleavesextractintype1diabetesmellitus (NOD-mice).Int.Immunopharmacol.18,106–115.
Conrado,D.J.,Fronza,T.,Paiva,R.M.,Dresch,A.P.,Geremias,D.,Fenner,R.,Viana,A.F., Rates,S.M.K.,2003.Aspectosquímicos,farmacológicoseempregoterapêutico dogêneroPassiflora(Maracujá).Rev.Afargs15,14–19.
FarmacopeiaBrasileira,2010.5thed.Copyright,Brasília.
Gobbo-Neto,L.,Lopes,N.P.,2007.Plantasmedicinais:fatoresdeinfluênciano con-teúdodemetabólitossecundários.Quim.Nova30,374–381.
Gosmann,G.,Provensi,G.,Comunello,L.N.,Rates,S.M.K.,2011.Composic¸ãoquímica easpectosfarmacológicosdeespéciesdePassifloraL.(Passifloraceae).Rev.Bras. Bioci.9,88–99.
Li,H.,Zhou,P.,Yang,Q.,Shen,Y.,Deng,J.,Li,L.,Zhao,D.,2011.Comparativestudies onanxiolyticactivitiesandflavonoidcompositionsofPassifloraedulis‘edulis’ andPassifloraedulis‘flavicarpa’.J.Ethnopharmacol.133,1085–1090.
Silva,A.R.,Seidl,C.,Furusho,A.S.,Boeno,M.M.S.,Dieamant,G.C.,Weffort-Santos, A.M.,2013.Invitroevaluationoftheefficacyofcommercialgreenteaextracts inUVprotection.Int.J.Cosmet.Sci.35,69–77.
Sucher,N.J.,Carles,M.C.,2008.Genome-basedapproachestotheauthenticationof medicinalplants.PlantaMed.74,603–623.
Tattini,M.,Gravano,E.,Pinelli,P.,Mulinacci,N.,Romani,A.,2000.Flavonoids accu-mulateinleavesandglandulartrichomesofPhillyrealatifoliaexposedtoexcess solarradiation.NewPhytol.148,69–77.
Ulmer,T.,MacDougal,J.M.,2004.Passiflora:PassionflowersoftheWorld.Timber Press,Portland.
VeigaJr.,V.F.,Pinto,A.C.,Maciel,M.A.M.,2005.Plantasmedicinais:curasegura? Quim.Nova28,519–528.
Viana,A.P.,Pereira,T.N.S.,Pereira,M.G.,Souza,M.M.,Maldonado,J.F.M.,do Ama-ral Júnior, A.T.,2003. Diversidade genética entre genótiposcomerciais de maracujazeiro amarelo (Passifloraedulis f.flavicarpa) e entre espécies de passiflorasnativasdeterminadapormarcadoresRAPD.Rev.Bras.Frutic.25, 489–493.
Wagner,H.,Bladt,S.,1996.PlantDrugAnalysis:AThinLayerChromatographyAtlas. Springer-Verlag,Berlin/Heidelberg/Germany.
Wohlmuth,H.,Penman,K.G.,Pearson,T.,Lehmann,R.P.,2010.Pharmacognosy andchemotypesofPassionflower(PassifloraincarnataL.).Biol.Pharm.Bull.33, 1015–1018.
Wosch,L.,Imig,D.C.,Cervi,A.C.,Moura,B.B.,Budel,J.M.,Santos,C.A.M.,2015. Com-parativestudyofPassiflorataxaleaves:I.Amorpho-anatomicprofile.Rev.Bras. Farmacogn.,http://dx.doi.org/10.1016/j.bjp.2015.06.004.