Article
Printed in Brazil - ©2017 Sociedade Brasileira de Química 0103 - 5053 $6.00+0.00
*e-mail: [email protected]
Synthesis and Characterization of LiCoO
2from Different Precursors by
Sol-Gel Method
Bruno G. A. Freitas,a José M. Siqueira Jr.,*,a Leonardo M. da Costa,a
Glaucio B. Ferreiraa and Jackson A. L. C. Resendea,b
aPPG em Química, Instituto de Química, Universidade Federal Fluminense,
Outeiro de São João Batista, s/n, Campus do Valonguinho, Centro, 24020-141 Niterói-RJ, Brazil
bPPG em Ciências dos Materiais, Instituto de Ciências Exatas e da Terra,
Universidade Federal do Mato Grosso, Centro Universitário do Araguaia, Avenida Universitária, 3500, 78698-000 Pontal do Araguaia-MT, Brazil
Lithium cobalt oxide, LiCoO2, widely used as cathode in lithium ion batteries was synthesized and their structural and electronic properties investigated. The crystalline powders were prepared by the sol-gel method with four complexing agents: citric acid, glycine, starch and gelatin. These syntheses were compared with the blank test (without complexing agent). The X-ray diffraction and vibrational spectroscopy allowed the identification of the rhombohedral phase LiCoO2 ( ) as the only or principal crystalline component in all samples. A small fraction of a second phase of cubic spinel Co3O4 was observed in the samples of starch, gelatin and the blank test. The Rietveld refinements showed small structural variations, indicating reduced influence of the complexing agents on the synthesis. The theoretical HOMO-LUMO (highest occupied molecular orbital-lowest unoccupied molecular orbital) gap values are in agreement to those estimated by diffuse reflectance spectroscopy (DRS). The scanning electron microscopy (SEM) showed morphological pattern regardless of the complexing agent used, showing an alternative method.
Keywords: LiCoO2, sol-gel method, XRD, Rietveld refinement, lithium ion batteries, DFT
Introduction
Lithium cobalt oxide, LiCoO2, has been the focus of many studies regarding their structural and electronic properties.1-8 This system has interesting electrochemical features that allows a wide use as cathodes of lithium ion batteries.2,4 The investigation of the structural aspects of the material is a crucial issue to better understand the electrochemical properties of the LiCoO2 compound.1-17 For example, the nature of the crystal, its size and shape, are directly related with its electrochemical characteristics.2
The LiCoO2 synthesized at low temperatures (LT),
below 500 °C, presents a cubic spinel structure ( ), while the synthesis at high temperatures (HT) (above 500 °C), generates the rhombohedral structure with
stratified layers ( ). Therefore, several authors
usually classify these structures as LT-LiCoO2 and HT-LiCoO2, respectively.1,2,7,8,18-24 The rhombohedral phase is characterized by a structure with alternating layers
of cobalt and lithium cations intercalated with oxygen anions.22 The lithium and cobalt(III) ions are arranged in intercalated layers (Figure 1a). The cobalt(III) ion is located at the octahedral sites, forming a strong bond with the neighboring oxygen anion to constitute the Co−O layers (Figure 1b). Finally, the lithium layers are intercalated between the CoO2 plans.1,3,4 The octahedral sites of these layers are occupied by lithium and cobalt(III) ions alternately that forms a sequential stacking with oxygen ion layers in a close packing of the ABCABC type (Figure 1c).4,5 This specific stacking arrangement leads to an environment equivalent for all ions, allowing the maximum charge delocalization and the minimal system energy.1,3,4
particle size, which contributes to a higher-rate capability of the electrodes.29 In this procedure, a soluble precursor compound is hydrolyzed to form the sol, a colloidal particles dispersion. Then, the gelling process (sonication or temperature) causes the formation of links between the sol particles, resulting in an infinite network of particles, defined as gel. Additionally, the gel is heated to obtain the desired material.30 The presence of chelating agents, such as citric acid, glycine, starch or gelatin, allows the control of the complexing reactions and its stoichiometry, which forms a solid material with very thin grains and more homogeneous size distribution.6
In this study, LiCoO2 was obtained using the sol-gel process for the synthesis of thin powder using four different complexing agents (citric acid, glycine, starch or gelatin) for the gel formation. Another sample was performed without using complexing agent classified, as a blank test. Therefore, the comparison of the sol-gel method with the complexing agents and the blank test will allow the elucidation of the morphologic, microstructural and spectroscopic differences of the LiCoO2 obtained, through the characterization techniques. The obtained solid was analyzed through the X-ray diffraction (XRD), Fourier transform infrared (FTIR), Raman spectroscopy, diffuse reflectance spectroscopy (DRS) and scanning electron microscope (SEM). Finally, the computational calculations
were performed to study some electronic properties and to compare with the obtained experimental results.
Experimental
Reagents and materials
The salts used were cobalt(II) nitrate hexahydrate (Co(NO3)2.6H2O, Sigma-Aldrich ≥ 98%) and lithium nitrate, anhydrous (LiNO3, Vetec 95%). The gel was produced using four different complexing agents: citric acid, anhydrous (C3H4OH(COOH)3, Vetec 99.5%); glycine, (H2NCH2COOH, P. A. Merck); starch (commercial corn starch, Maizena®, Duryea®); and gelatin (commercial).
Synthesis of LiCoO2 from different complexing agents
Initially, five solutions were prepared containing LiNO3 (22.0 × 10⁻³ mol, 1.517 g) and Co(NO3)2.6H2O (20.0 × 10⁻³ mol, 5.821 g) in 20 mL of water, with a proportion of Li:Co = 1.1:1, according to Predoana et al.6 A specific complexing agent was added to each solution: (i) citric acid (4.611 g)31 diluted in 5 mL of water; (ii) glycine (1.501 g);32 (iii) starch (1.250 g);33 (iv) gelatin
(3.500 g)34 and (v) blank test (without the complexing agents). The first four solutions were heated between
Figure 1. (a) Layered crystalline structure of the rhombohedral LiCoO2; (b) representation of the octahedral CoO6 structure; (c) stacking arrangement of
70 to 80 °C in a glycerin bath until the formation of the gel. The amount of time of this process is different for each gelling agent: (i) citric acid (5 hours), (ii) glycine (3 hours),
(iii) starch (1 hour), (iv) gelatin (3 hours). The production
of the crystalline powders for all samples was performed, in a muffle, in two stages: initially with the combustion of the materials at 300 °C between 20-30 minutes and later heating at 700 °C for 24 h.6,30,35 Each sample was named according to the complexing agent used: citric acid; glycine; starch; gelatin and the blank test.
Materials characterization
The vibrational spectra in the infrared region for all the samples were obtained by attenuated total reflectance (ATR) with the Bruker ALPHA-P FT-IR, in the range of wavenumber between 373 and 4000 cm-1 and with a Thermo Nicolet FTIR iS50, between 100 and 600 cm-1. The vibrational spectra of the prepared materials were also observed through Raman spectrophotometer recorded by a microscope SENTERRA Raman spectroscopy, equipped with a CCD detector thermoelectrically cooled and a long length of objective work (lens ×100). The line of 532 nm of a diode laser was used as Raman excitation source of 180° of scattering geometry and the acquisition time for each spectrum was 60 s in each window. The material was placed in capillary tubes of glass and the spectra were performed at a temperature of 20 ± 2 °C, with a resolution of 4 cm-1 and power of laser corresponding to 0.2 mW. X-ray powder diffraction analyses (XRPD) were performed with a Bruker D8 Advance diffractometer using a Co Kα radiation (λ = 1.79026 Å) in a Bragg-Brentano θ/θ configuration. The diffraction patterns were collected with steps of 0.02° and accumulation time of 0.5 s per step. The determination
of the value of optical band-gap of the samples was performed through the Kubelka-Munk function (F(R)) of data interpretation from the diffuse reflectance spectroscopy (DRS) obtained in Cary 5000 Varian UV-Vis-NIR Spectrophotometer, with wavelengths between 190-950 nm and magnesium oxide as reference. The morphology, texture and habit of the obtained compounds were evaluated by scanning electron microscopy (SEM) using JEOL JSM-7100F applying voltage of 15.0 kV and with material deposited on double sided adhesive carbon tape on a metal support.
Rietveld refinement
The Rietveld refinement was performed using the least-squares implemented in the GSAS software, EXPGUI version 1225 by Argonne National Laboratory.36,37 The
instrumental parameters were obtained by refining the Y2O3 standard IPEN (more details in Acknowledgments section).
The average particle size (D) to the width of a diffraction peak is described by Scherrer’s equation (disregarding microstrain and inhomogeneity). With this equation, it is possible to determine the crystallite size for the crystallography directions (h k l), as seen in equation 1:
(1)
where λ is the radiation wavelength, θ is the diffraction angle, and k is a constant related to the shape of particles (k = 0.94).38 The β term is described by the equation 2:
(2)
where βS is the instrumental width of the standard and βe is the experimental width of the analyzed sample.
The microstructural analysis was made from the data obtained after the refinement with GSAS that uses a microstrain distribution model, which the width of the diffraction peak increases in proportion to the order of diffraction. The software uses a mathematical routine that allows the evaluation of crystallite size and microstrain by analyzing the peak enlargement profile. The function 4 (pseudo Voigt) GSAS was chosen because it is more efficient in the adjustment of the desired profile, since it includes a model of anisotropic microstrain described semi-empirically. This model was developed by Stephens39 and is not contemplated in other functions, being this the reason of using function 4 of the GSAS software in this work. The graphs obtained for displaying the effect of the Stephens microstrain model were treated through the gnuplot 4.5 program.40
Computational method
The computational single point calculations were performed with the Rietveld refinements results as input data (atomic coordinates) in a periodic boundary condition. The density functional theory method (DFT) associated with GGA (generalized gradient approximation) through the PBE (Perdew-Burke-Ernzerhof) functional exchange-correlation41 was used in the program CP2K,42 considering the temperature of the system at 300 K. The calculation was performed with GPW method (mixed Gaussian and plane-wave),43 with the double zeta basis
set (DZVP-MOLOPT-GTH)44 and pseudopotential
the periodic condition of analysis was 2 × 2 × 1 (a × b × c, cell unit parameters).
Results and Discussion
The experiments were performed by the sol-gel process with the following complexing agents for the gel formation: citric acid, glycine, starch and gelatin. Two of the gelling precursors used are reported in synthetic methods, the citric acid (Pechini method)46 and the glycine methods.47 The other precursors, starch and gelatin, have been more studied in the sol-gel method synthesis in the last years.48-50 In addition to these procedures the synthesis without any gelling precursor, the blank test, was also performed.
The factor group analysis of the vibrational modes in the infrared spectra allows the distinction between the phases LT-LiCoO2 and HT-LiCoO2. It also provides the structural information of the distortion of the octahedral CoO6 oxide.8,51 Each LiCoO2 structure is associated with a particular pattern of spectrum. Experimental studies report that the HT-LiCoO2 phase has two bands observed around 487 (A1g) and 597 (Eg) cm-1 in the Raman spectra,
while the LT-LiCoO2 has four bands at 449, 484,
590 and 605 cm-1 (modes A
1g, Eg and 2F2g).7,8,15,52,53 In this work, the FTIR spectra were divided into two parts, as shown in Figure 2: the region of low wavenumber, which contains a defined band at 297 cm-1; and the region of high wavenumber between 500 and 700 cm-1, which contains several bands for the active modes 2A2u + 2Eu absorption. This result is in close agreement with other studies.7,8,15,52,53
A more detailed analysis in the high wavenumber region shows two bands: one around 585 cm-1 correspondent to ν(CoO6) and another in 540 cm-1 for δ(O−Co−O). It is also observed one shoulder located around 630-660 cm-1 assigned as overtone vibration. For the lower wavenumber region, the band at 297 cm-1 was assigned as ν(LiO
6). The band of this region is identified as vibrational band characteristic of the rhombohedral LiCoO2, of spatial group similar to experimental data.1,2,8,51
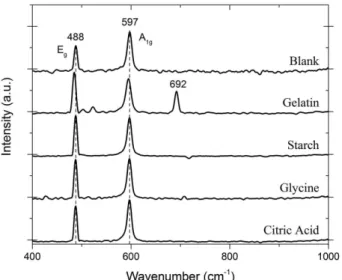
The Raman spectra, in Figure 3, corroborate the assignment of the vibrational modes in the infrared spectra. This technique also allowed the detection of a secondary product Co3O4, which has five active bands (A1g, Eg and 3F2g), with the most intense around the 690 cm-1.53-56 Below 650 cm-1, the Raman spectra of the compounds show two bands around 597 and 488 cm-1, which are assigned to the A
1g and Eg vibrational modes of HT-LiCoO2 phase, respectively. For the compound synthesized with gelatin it was found a band in 692 cm-1 that is characteristic of the spinel Co
3O4. This band is related to the short distance order and is not observed in the other synthesized compounds spectra. Thus, both the IR and Raman spectra are consistent with the hexagonal phase, , information, where LiCoO2 is predominant.
The X-ray diffraction analyses were performed for the HT-LiCoO2 synthesized products, according to the precursor used for gel formation (citric acid, starch, glycine and gelatin). These results are presented in Figure 4. The X-ray pattern obtained shows the presence of HT-LiCoO2 as a single phase in the synthesis with the citric acid and glycine precursors. A small amount of spinel Co3O4 was found as secondary phase in the diffraction patterns of the blank test
Figure 2. FTIR absorption spectra of LiCoO2 in the low (left side) and high (right side) wavenumber regions, for all complexing agents used in the
and of the starch and gelatin precursors, although HT-LiCoO2 can be described as a major constituent.6,9,57-62 The XRD analyses of the HT-LiCoO2 compounds synthesized with the precursors and the blank test were compared to evaluate the influence of the gelling agent in the product structural formation. The analysis of Figure 4 shows that the precursors’ XRD has narrower peaks than the blank test. This shows a higher degree of structural order for the compounds synthesized with the gelling precursors than from the blank test. It is also observed defined separation between the Bragg peaks in relation to the Miller index of the (006) (102–) and (108–) (110) planes. Table 1 shows the full width at half maximum (FWHM) of the Bragg peaks for the complexing agents and the blank test. The analysis of the FWHM for the Bragg peaks shows that the presence of the complexing agent in the synthesis of HT-LiCoO2 leads to a high degree of crystallinity, good hexagonal ordering, and greater layered characteristics during the formation process.57
The data shown in Table 1 and Figure 4 are consistent with the LiCoO2 rhombohedral crystal system of the space
group (166) , inorganic crystal structure database
ICSD#51381,63 and the Co
3O4 cubic crystal system of the
space group (227) , ICSD#36256.64
The Rietveld refinements data, structural parameters, fraction of phases and the fitting parameters obtained from the GSAS software, for the synthesized HT-LiCoO2 compounds, are shown in Table 2. The lattice parameters analysis shows that the complexing agents do not promote significant change in the a-axis. However, larger changes are observed with respect to the c-axis, in agreement with other works.9,59-62 The Rietveld refinement also confirmed the presence of a minority second phase of the spinel Co3O4 in the blank test, gelatin and starch samples. This observation is related to the crystallite energy formation. The larger organic material quantity, of the gelatin and starch samples, decreases the oxidative power of the nitrate anion and softens the combustion process, making the crystal coalescence more difficult. The absence of organic material in the blank test sample leads to a fast and exothermic crystallite formation reaction. This behavior leads to the partial oxidation of the cobalt atom, which also favors the formation of spinel Co3O4.
Figure 5 shows the Rietveld refinement for the
HT-LiCoO2 synthesis with the starch precursor. In
Figure S1 (Supplementary Information) contains the results for the acid citric, glycine, gelatin precursors and the blank test. This figure shows the formation of the phase of the HT-LiCoO2 solid and the presence of the phase of the spinel Co3O4. In Figure 5, the χ2 and RWP parameters show an adequate adjust of the experimental and calculated X-ray pattern.
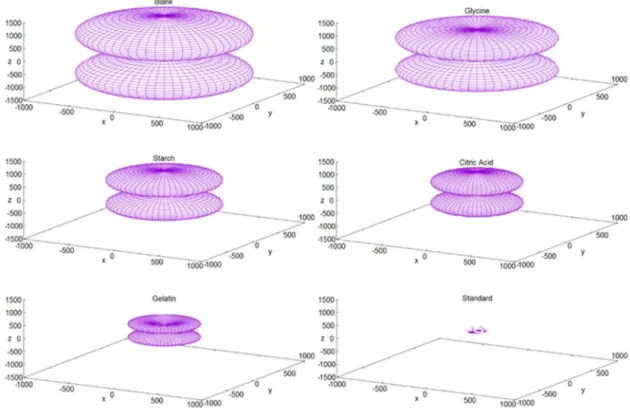
Finally, the X-ray diffraction studies allowed the analysis of the microstrain and size of the crystallites that are presented in Table 3 and Figure 6. We calculated the Scherrer average size (Table 3) and the microstrain of the prepared samples and the Y2O3 standard (Figure 6).
Analyzing the information listed in Table 3, it is seen the variation of the average crystallite size in the directions
Figure 3. Raman spectra of the samples of HT-LiCoO2 synthesized with
the four complexing agents and the blank test.
Table 1. Full width at half maximum (FWHM) of the Bragg peaks in degree for (006), (102–), (108–) and (110) planes of all samples
Bragg peak
FWHM (2θ) / degree
Citric acid Glycine Starch Gelatin Blank test
006 0.1425 0.1388 0.1243 0.1388 0.2426
102– 0.1351 0.1208 0.1139 0.1388 0.2525
108– 0.1785 0.2139 0.2048 0.1743 0.5077
110 0.1620 0.2836 0.1785 0.1785 0.6931
of each plan family. The samples that presented larger sizes of crystallites were those in which starch and gelatin were used as precursors. These complexing agents have long polymer chains of larger molecules and with relatively higher amounts of organic material compared to the citric acid and glycine precursors. This may be the reason for the samples obtained with starch and gelatin to have larger crystallites because, during combustion, this material can provide more energy to the system during the formation of nanocrystallites. Thus, the crystallites would be in an environment that contributes better to their growth. On the other hand, the blank sample shows the smaller sizes of crystallites and a larger dispersion in the crystallographic directions. Probably due to the fact that this sample does not present the use of any precursor and does not have organic material, as the other samples, to assist in the combustion. Therefore, the environment for crystallite growth, in this
case, is not favored and its formation process may be governed mainly by kinetic factors in a more chaotic way.
Figure 6 shows that the samples which presented the smallest microstrain were those obtained with gelatin and citric acid, whereas the sample obtained with starch shows proportionally intermediate microstrain. It indicates a more regular growth of the crystals during their formation when using these precursors. This may be related to the polymer network generated by the precursors gelatine, citric acid and starch that leaded to an adequate dispersion of the ions in the complexes. Among the precursors studied, gelatine showed a higher efficiency avoiding large microstrains compared to the others, which makes it a promising complexing agent for the formation of LiCoO2 with crystallite with more regular form. On the other hand, the sample produced from the glycine presented a large microstrain, showing, among the studied precursors, to be the least efficient to
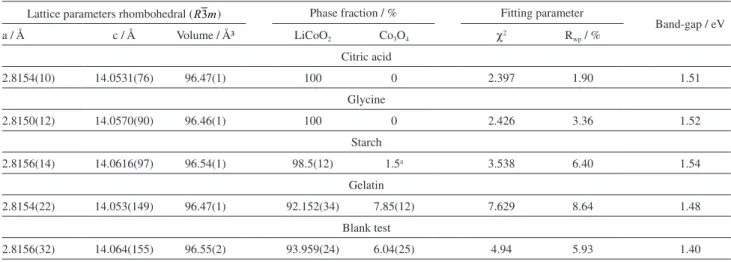
Table 2. Unit cell structural parameters (a, c and volume), refinement results: the percentage of phase fraction, the fitting parameters and the band-gap of LiCoO2 (from the Kubelka-Munk function) for each precursor
Lattice parameters rhombohedral ( ) Phase fraction / % Fitting parameter
Band-gap / eV
a / Å c / Å Volume / ų LiCoO2 Co3O4 χ2 Rwp / %
Citric acid
2.8154(10) 14.0531(76) 96.47(1) 100 0 2.397 1.90 1.51
Glycine
2.8150(12) 14.0570(90) 96.46(1) 100 0 2.426 3.36 1.52
Starch
2.8156(14) 14.0616(97) 96.54(1) 98.5(12) 1.5a 3.538 6.40 1.54
Gelatin
2.8154(22) 14.053(149) 96.47(1) 92.152(34) 7.85(12) 7.629 8.64 1.48
Blank test
2.8156(32) 14.064(155) 96.55(2) 93.959(24) 6.04(25) 4.94 5.93 1.40
aThe main phase error includes the secondary phase value.
Figure 5. Rietveld refinement, using the symmetry , for sample of HT-LiCoO2 obtained with the starch precursor. The bottom line shows the difference
aid in the process of crystallite growth. The blank sample has the highest microstrain demonstrating that the use of
the precursor is a methodology that contributes effectively to attenuate the irregular growth of crystallites.
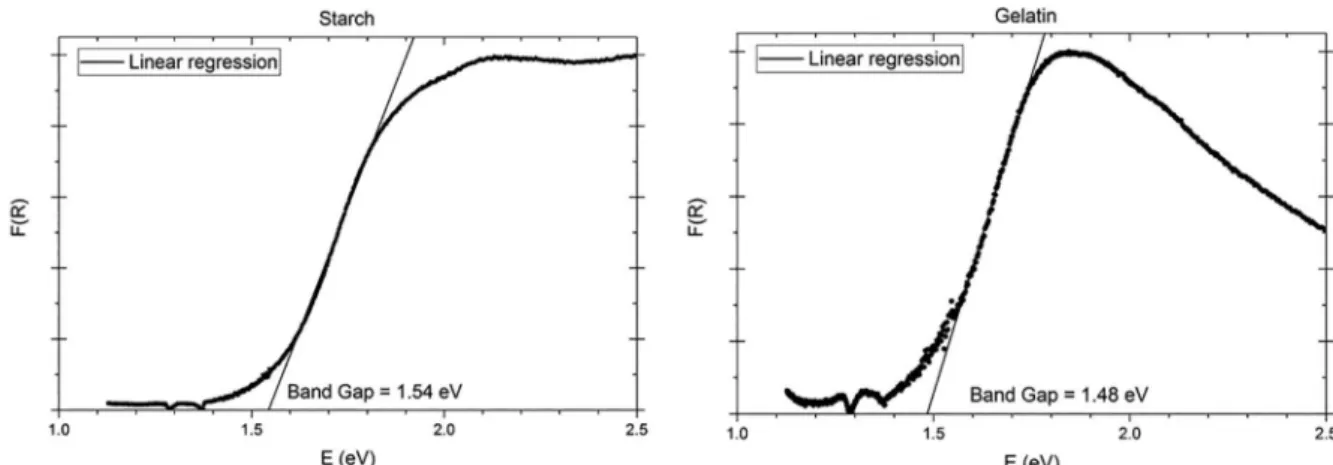
The optical band-gap was obtained using the Kubelka-Munk function (F(R)) from the diffuse reflectance data of the HT-LiCoO2 compounds synthesized with the precursors (Figure 7 for starch and gelatin and Figure S2, in Supplementary Information, for citric acid, glycine and the blank test). The optical band-gap values obtained are summarized in Table 2. According to the ligand field theory, the oxygen 2p-band is hybridized with the cobalt 3d-band in the HT-LiCoO2 system.1 Thus, the octahedral ligand field of the oxygen anion causes the spin electron pairing of the cobalt(III) cation: 3d6 (t
2g)6 (eg)0, presenting a low spin configuration mode. Consequently, the valence band is formed by the fully filled t2g orbitals and the conduction band by the empty eg orbitals. Therefore, the semiconducting properties of HT-LiCoO2 are described
through transitions between the conduct (t2g) and
valence (eg) bands.1,3,52 The optical band-gap values are modulated by the complexing agent used (citric acid, starch, glycine and gelatin) and are observed around 1.5 eV. These values are in close agreement with other studies, which ranges from 1.5 to 1.6 eV.1,52,65
Computational calculations were performed with the experimental atomic coordinates (Rietveld refinements) as input data to evaluate the electronic properties of the materials and to analyze the effect of structural
Table 3. Particle size average calculated by Scherrer equation for family of planes, including precursors and blank test
Plane family (h k l)
Average Scherrer size / nm
Citric acid
(0 0 l)a 69.4
(1 0 l)b 72.5
(1 0 −l)c 71.0
Glycine
(0 0 l)a 67.3
(1 0 l)b 70.4
(1 0 −l)c 66.4
Starch
(0 0 l)a 75.4
(1 0 l)b 74.4
(1 0 −l)c 69.8
Gelatin
(0 0 l)a 74.7
(1 0 l)b 73.5
(1 0 −l)c 73.0
Blank
(0 0 l)a 41.3
(1 0 l)b 31.8
(1 0 −l)c 29.3
aAverage of plane family: (0 0 3), (0 0 6), (0 0 9), (0 0 12); baverage of
plane family: (1 0 1), (1 0 4), (1 0 7), (1 0 10); caverage of plane family:
(1 0 −2), (1 0 −5), (1 0 −8), (1 0 −11).
modifications on each specific synthesis (each precursor and blank test). The expanded solid treatment was considered using the periodic boundary conditions associated with the DFT method. The calculations, performed with the GGA-PBE functional, of the LiCoO2 structures presented a band-gap of approximately 1.74 eV for all calculated systems. Theoretical and experimental works66-68 report that the values vary widely between 1.02 and 2.40 eV, showing that the calculated energies, using the PBE functional, are within the expected range.
The density of electronic states (DOS) for the compound synthesized with gelatin is shown in Figure 8. Its variation to the compounds synthesized with other precursors was minimal with very little changes between them. In Figures S3-S6 (Supplementary Information) we show the
other precursors’ graphs. Thus, it can be assumed that the information shown in graphs from Figure 8 represents the densities of equivalent states for all the samples. The Fermi energy was indicated in Figure 8 as the energy level in zero. The valence band (VB) with negative values near the Fermi energy is indicated approximately between 0 and −1.5 eV. The VB is formed mainly by cobalt 3d orbitals with small influence of the close energy oxygen 2p orbitals. This allows the hybridization of oxygen p orbitals with cobalt d orbitals.66-70 On the other hand, values above the Fermi energy represent the conduction band (CB) in the range of 1.5 to 2.5 eV, with a hybridization more accentuated for the oxygen p orbitals and cobalt d orbitals, with predominance of the latter.
The contribution of the lithium orbital in the density of
Figure 7. DRS, Kubelka-Munk function, F(R), and tangent line extrapolation. Results for the starch (left) and gelatin (right) samples.
Figure 8. DOS for the LiCoO2 in each orbital obtained from gelatin for: (a) Li+, (b) Co3+, (c) O2- and (d) density of total states. The energy value at zero
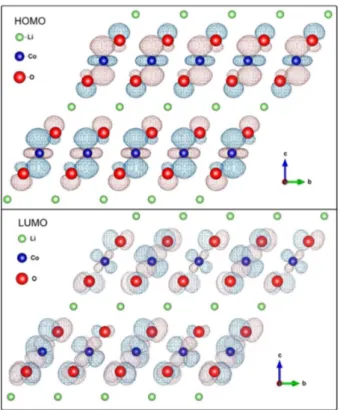
states for the regions close and around the Fermi energy is very small. This fact is also shown in Figure 9 where the frontier orbitals (HOMO (highest occupied molecular orbital) and LUMO (lowest unoccupied molecular orbital)) are represented and it is possible to see the electronic delocalization around the cobalt and oxygen ions and its absence around the lithium ions. This small contribution of the lithium orbitals may partially explain the large mobility of the lithium cations in the HT-LiCoO2 structure. The interaction between the lithium and oxygen orbitals is not observed. Thus due to its larger mobility, lithium ions can be inserted and removed from the layered structure of LiCoO2. This contributes to promote the charge and discharge electrochemical cycles when this compound is used as a cathode in lithium-ion batteries.10,71-73
The densities of states, in Figure 9, show a contribution predominance of the oxygen p orbitals and cobalt d orbitals in the HOMO/LUMO frontier orbitals and small contribution of the hybridization between these orbitals.
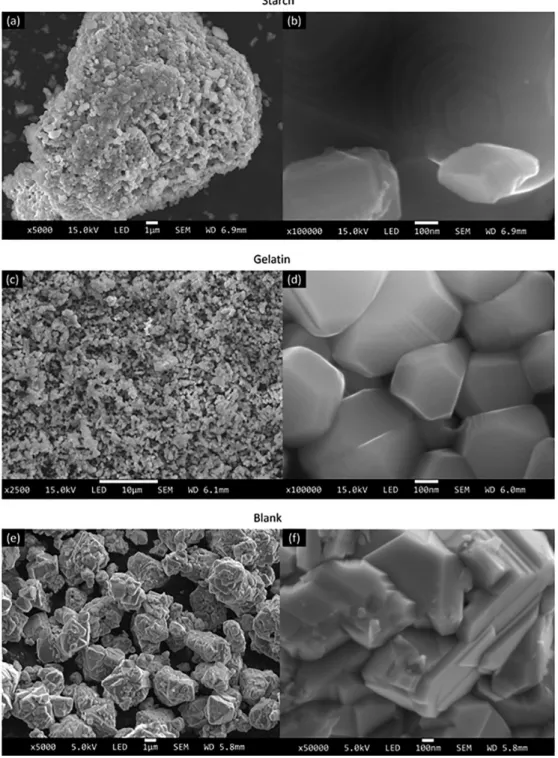
The analyses by SEM (Figure 10) show the morphology, texture and habit of the HT-LiCoO2 synthesized with the starch and gelatin precursors and in the blank test. We also present the SEM analyses using the citric acid and glycine precursors in Figure S7 (Supplementary Information).
By observing the morphology of the material through SEM it is verified that the samples containing complexing agent have the smaller particle sizes while the blank sample
has larger sizes. This is the opposite of the observed result in the sizes of crystallites by the Scherrer equation (Table 3). Thus, there is a material with large crystallites and small grains (synthesized by sol-gel method) and also a material with small crystallites and large grains (blank sample). This feature is related to the use of the complexing agent in the synthesis, which possibly hinders the coalescence of the species during the process of particle growth. This fact prevents a larger contact of the species during its formation. This is reflected in a smaller grain size when using the complexing agent and the non-use of these agents generates an environment where the particles can grow more easily, as seen in the SEM of the blank having a larger grain size. Thus, it is possible to infer that at the same time that the complexing precursor hinders the coalescence of the species for the grains growth, it assists in the formation of crystallites favoring their development as mentioned in the process described previously.
The HT-LiCoO2 samples synthesized, with all the complexing agents, are homogeneous material with sub-micrometer particle size and adequate dispersion of the particles with quasi-spherical morphology. The majority
of the particles have dimensions smaller than 0.5 µm, however, it is also observed some blocks up to 1.0 µm. Among the HT-LiCoO2 compounds synthesized, the blank test sample has the particle size around 1.0 to 5.0 µm, approximately, with the largest distribution of size and sheets morphological aspect. All samples synthesized with complexing agents present morphological characteristics of homogeneous material, quasi-spherical particulates and
uniform size. In Figures 10b, 10d and 10f, it is possible to observe the hexagonal habit in accordance with its crystalline rhombohedral structure.
Particle morphology control for cathode materials plays an important role in material packing density. Powdered materials with irregular morphologies are prone to be agglomerated and have “bridge formation”, which results in a number of voids between the particles and reduces their fluidity.74 In contrast, materials with specific morphological particles have the advantage of having high packaging density and specific volumetric capacities. When the particles have an ideal size distribution, the smaller particles can fill the voids between the large particles by increasing the stacking density, which is useful for achieving high energy density in lithium ion batteries. Studies75-78 of materials with regular particles have shown that they exhibited better electrochemical performance than materials with irregular particles. Thus, the control of the particle morphology is one of the motivating aspects for the development of industrial production of lithium ion batteries. The present study allowed to evaluate the
morphology of LiCoO2 prepared, opening the way for future application studies.
Conclusions
The HT-LiCoO2 synthesis with the citric acid, starch, glycine and gelatin complexing agents was studied and compared with a blank test (without the gelling agent). The
obtained solids showed rhombohedral phase , with
small structural changes, according to the precursor used in the sol-gel process, investigated by XRD, Raman and DRS. The synthesis using the precursors influences more strongly in the microstructure of the HT-LiCoO2, seen in the microstrain study, than the structural arrangement obtained by XRD. The synthesis with the citric acid and glycine complexing agents yield the highest purity in the formation of the HT-LiCoO2 compounds, with only the rhombohedral phase. The methodology using starch
Figure 10. SEM of the synthesized HT-LiCoO2 samples with the starch and gelatin precursors and the blank test, expanded at 5000× (a and e),
and gelatin precursors and the blank test also lead to the HT-LiCoO2 rhombohedral phase, although with a small percentage of the spinel Co3O4.
The computational calculations took as input data the structural refinement performed on the experimental part. The HOMO-LUMO energy gap calculated for all HT-LiCoO2 compounds of each synthesis, with the four precursors and the blank test, showed approximately the same value of 1.74 eV. This is in close agreement with the experimental optical band-gap of 1.5 eV. It is also possible to confirm the electrochemical mobility of the Li+ specie in lithium ion batteries by the theoretical results. The calculations showed a small electronic density on the lithium ion near the Fermi level, with reduced orbital overlap in the HT-LiCoO2 compound. The electronic density of the frontier orbitals shows that the HOMO and LUMO are mainly derived from the overlap between the oxygen 2p and cobalt 3d orbitals. The DOS diagrams corroborate these results.
The SEM analyses show that the synthesis with each precursors lead to particular morphologic, texture and habit characteristics for the HT-LiCoO2 compound. The SEM results and the microstructure studies show that at the same time the complexing precursors hinder the coalescence of the species for the growth of the grains and assist the formation of crystallites. These techniques show that the use of sol-gel method with the complexing agents leads to larger changes in the morphologic and in the microstructural aspects than in the spectroscopy features.
Supplementary Information
Supplementary information is available free of charge at http://jbcs.org.br as PDF file.
Acknowledgments
The authors would like to thank UFF/Proppi, FAPERJ and CNPq for financial support and Centro de Caracterização Avançado para Indústria de Petróleo/IF-UFF/ANP/ PETROBRAS, LAME-UFF and LDRX-UFF for analyzes. The authors thank Prof Dr Wagner de Assis Alves for microscope Raman analyses and Prof Dr Yutao Xing for SEM analyses. The authors thank Dr Luis Gallego Martinez for the academic supply of the Y2O3 standard for the realization of the Rietveld refinement. This standard was produced at IPEN (Instituto de Pesquisa Energética e Nuclear) as a product of the dissertation of MSc Antônio de Sant’Ana Galvão on “Desenvolvimento de amostras padrão de referência para difratometria”, 2011. B. G. A. F. thanks CAPES for the fellowship. J. A. L. C. R. acknowledges CNPq for his fellowship.
References
1. Ghosh, P.; Mahanty, S.; Raja, M. W.; Basu, R. N.; Mait, H. S.;
J. Mater. Res.2007, 22, 1162.
2. Julien, C.; Solid State Ionics2000, 136, 887.
3. Graetz, J.; Hightower, A.; Ahn, C. C.; Yazami, R.; Rez, P.; Fultz, B.; J. Phys. Chem. B2002, 106, 1286.
4. Julien, C. M.; Mauger, A.; Zaghib, K.; Groult, H.; Inorganics
2014, 2, 132.
5. Van der Ven, A.; Aydinol, M. K.; Ceder, G.; Kresse, G.; Hafner, J.; Phys. Rev. B 1998, 58, 2975.
6. Predoana, L.; Jitianu, A.; Voicescu, M.; Apostol, N. G.; Zaharescu, M.; J. Sol-Gel Sci. Technol. 2015, 74, 406. 7. Tintignac, S.; Baddour-Hadjeana, R.; Pereira-Ramosa, J.-P.;
Salotb, R.; Electrochim. Acta 2012, 60, 121.
8. Porthault, H.; Baddour-Hadjeanc, R.; Le Crasa, F.; Bourbona, C.; Frangerb, S.; Vib. Spectrosc. 2012, 62, 152.
9. Aboulaich, A.; Ouzaouit, K.; Faqir, H.; Kaddami, A.; Benzakour, I.; Akalay, I.; Mater. Res. Bull. 2016, 73, 362.
10. Islam, M. S.; Fisherb, C. A. J.; Chem. Soc. Rev.2014, 43,
185.
11. Dixit, M.; Kosa, M.; Lavi, O. S.; Markovsky, B.; Aurbach, D.; Major, D. T.; Phys. Chem. Chem. Phys. 2016, 18, 6799. 12. Abdel-Ghany, A. E.; Hashem, A. M.; Elzahany, E. A.; Abuzeid,
H. A.; Indris, S.; Nikolowski, K.; Ehrenberg, H.; Zaghib, K.; Mauger, A.; Julien C. M.; J. Power Sources 2016, 320, 168.
13. Self, E. C.; McRen, E. C.; Wycisk, R.; Pintauro, P. N.;
Electrochim. Acta 2016, 214, 139.
14. Bazito, F. F. C.; Torresi, R. M.; J. Braz. Chem. Soc. 2006, 17, 627.
15. Garcia, E. M.; Taroco, H. A.; Domingues, R. Z.; Matencio, T.; Gonçalves, S. L. A.; Ionics 2016, 22, 735.
16. Lala, S. M.; Montoro, L. A.; Lemos, V.; Abbate, M.; Rosolen, J. M.; Electrochim. Acta 2005, 51, 7.
17. Silva, S. P.; Silva, P. R. C.; Urbano, A.; Scarminio, J.; Quim. Nova 2016, 39, 901.
18. Antolini, E.; Solid State Ionics2004, 170, 159.
19. Brinker, C. J.; Scherer, G. W.; Sol-Gel Science: The Physics and Chemistry of Sol-Gel Processing; Academic Press Inc: San Diego, USA, 1990.
20. Kwon, T.; Ohnishi, T.; Mitsuishi, K.; Ozawa, T. C.; Takada, K.;
J. Power Sources2015, 274, 417.
21. Porthault, H.; Le Crasa, F.; Frangerb, S.; J. Power Sources2010,
195, 6262.
22. Bueno, P. R.; Pesquero, N. C.; Ferreira, F. F.; Santiago, E. I.; Varela, J. A.; Longo, E. J.; Phys. Chem. C 2008, 112, 14655.
23. Santiago, E. I.; Andrade, A. V. C.; Paiva-Santos, C. O.; Bulhões, L. O. S.; Solid State Ionics 2003, 158, 91.
24. Santiago, E. I.; Bueno, P. R.; Andrade, A. V. C.; Paiva-Santos, C. O.; Bulhões, L. O. S.; J. Power Sources 2004, 125, 103.
26. Aykol, M.; Kim, S.; Wolverton, C. J.; Phys. Chem. C 2015, 119, 19053.
27. Braga, T. P.; Dias, D. F.; Sousa, M. F.; Soares, J. M.; Sasaki, J. M.; J. Alloys Compd. 2015, 622, 408.
28. Liu, H.; Wu, Y. P.; Rahm, E.; Holze, R.; Wu, H. Q.; J. Solid State Eletrochem. 2004, 8, 450.
29. Okubo, M.; Hosono, E.; Kim, J.; Enomoto, M.; Kojima, N.; Kudo, T.; Zhou, H.; Honma, I.; J. Am. Chem. Soc.2007, 129,
7447.
30. Larcher, D.; Delobel, B.; Dantras-Laffont, L.; Simon, E.; Blach, J. F.; Baudrin, E.; Inorg. Chem.2010, 49, 10949.
31. Gu, Y.; Chen, D.; Jiao, X.; J. Phys. Chem. B 2005, 109, 17901.
32. Gopukumar, S.; Chung, K. Y.; Kim, K. B.; Eletrochim. Acta
2004, 49, 803.
33. Gangulibabu; Bhuvaneswari, D.; Kalaiselvi, N.; J. Solid State Eletrochem. 2013, 17, 9.
34. dos Santos, C. M.; Martins, A. F. N.; Costa, B. C.; Ribeiro, T. S.; Braga, T. P.; Soares, J. M.; Sasaki, J. M.; J. Nanomater.
2016, ID 1637091.
35. Ding, N.; Ge, X. W.; Chen, C. H.; Mater. Res. Bull. 2005, 40,
1451.
36. Toby, B. H.; J.Appl. Crystallogr. 2001, 34, 210.
37. McCusker, L. B.; Von Dreele, R. B.; Cox, D. E.; Louer, D.; Scardi, P.; J. Appl. Crystallogr. 1999, 32, 36
38. James, R. W.; The Crystalline State, vol. II; Bragg, L., ed.; Bradford and Dickens: London, W. C. I., Great Britain, 1962.
39. Stephens, P. W.; J. Appl. Crystallogr.1999, 32, 281.
40. Williams, T.; Kelley, C.; Gnuplot 4.5: an Interactive Plotting Program, 2011. Available at http://gnuplot.info, accessed in
April 2017.
41. Perdew, J. P.; Burke, K.; Ernzerhof, M.; Phys. Rev. Lett.1996,
77, 3865.
42. The CP2K Developers Group; CP2K Open Source Molecular Dynamics Program. Available at http://www.CP2K.org, accessed in April 2017.
43. Vande, V. J.; Krack, M.; Mohamed, F.; Parrinello, M.; Chassaing, T.; Hutter, J.; Comput. Phys. Commun. 2005, 167,
103; Blochl, P. E.; Phys. Rev. B1994, 50, 17953; Blochl, P. E.; Forst, C. J.; Schimpl, J.; Bull. Mater. Sci.2003, 26, 33.
44. Vondele, J. V.; Hutter, J.; J. Chem. Phys. 2007, 127, 114105. 45. Krack, M.; Theor. Chem. Acc.2005, 114, 145.
46. Pechini, M. P.; U.S. Patent 33306971967.
47. Kumar, U. P.; Nesara, J. S.; J. Nano. Adv. Mat. 2013, 1, 75.
48. Miyawaki, O.; Omote, C.; Matsuhira, K.; Biopolymers2015,
103, 685.
49. Bérut, A.; Petrosyan, A.; Gomez-Solano, J. R.; Ciliberto, S.;
J. Stat. Mech.: Theory Exp. 2015, 10020.
50. Yadav, R. S.; Havlica, J.; Masilko, J.; Kalina, L.; Hajdúchová, M.; Enev, V.; Wasserbauer, J.; Kuritka, I.; Kozakova, Z.;
J. Supercond. Novel Magn.2015, 28, 1851.
51. Julien, C.; Mauger, A.; Vijh, A.; Zaghib, K.; Lithium Batteries Science and Technology, 1st ed.; Springer: New York, USA,
2016.
52. Kosova, N. V.; Kaichevb, V. V.; Bukhtiyarovb, V. I.; Kellermanc, D. G.; Devyatkina, E. T.; Larina, T. V.; J. Power Sources 2003,
119, 669.
53. Mendoza, L.; Baddour-Hadjeanb, R.; Cassira, M.; Pereira-Ramos, J. P.; Appl. Surf. Sci. 2004, 225, 356.
54. Rossen, E.; Reimers, J. N.; Dahn, J. R.; Solid State Ionics1993,
62, 53.
55. Hadjiev, V. G.; Iliev, M. N.; Vergilov, I. V.; J. Phys. C: Solid State Phys. 1988, 21, L199.
56. Fukumitsu, H.; Omori, M.; Terada, K.; Suehiro, S.;
Electrochemistry 2015, 83, 993.
57. Periasamy, P.; Kima, H.-S.; Naa, S.-H.; Moona, S.-I.; Lee, J. C.;
J. Power Sources2004, 132, 213.
58. Yang, W.-D.; Hsieh, C.-Y.; Chuang, H.-J.; Chen, Y.-S.; Ceram. Int. 2010, 36, 135.
59. Gummow, R. J.; Thackeray, M. M.; Mater. Res. Bull.1992, 27, 327.
60. Wolverton, C.; Zunger, A.; J. Electrochem. Soc.1998, 145, 2424.
61. Kim, J.; Fulmer, P.; Manthiram, A.; Mater. Res. Bull. 1999, 34, 571.
62. Fajar, A.; Gunawan, G.; Kartini, E.; Mugirahardjo, H.; Ihsan, M.; At. Indones.2010, 36, 111.
63. Holzapfel, M.; Haak, C.; Ott, A.; J. Solid State Chem. 2001,
156, 470.
64. Picard, J. P.; Baud, G.; Besse, J. P.; Chevalier, R.; J. Less-Common Met. 1980, 75, 99.
65. Tauc, J.; Grigorovici, R.; Vancu, A.; Phys. Status Solidi B 1966,
15, 627.
66. Andriyevsky, B.; Doll, K.; Jacob, T.; Phys. Chem. Chem. Phys. 2014, 16, 23412.
67. Hu, L.; Xiong, Z.; Ouyang, C.; Shi, S.; Ji, Y.; Lei, M.; Wang, Z.; Li, H.; Huang, X.; Chen, L.; Phys. Rev. B 2005, 71,
125433.
68. Xiong, F.; Yan, H. J.; Chen, Y.; Xu, B.; Le, J. X.; Ouyang, C. Y.;
Int. J. Electrochem. Sci.2012, 7, 9390.
69. Wu, L.; Zhang, J.; J. Appl. Phys.2015, 118, 225101.
70. Carlier, D.; Cheng, J.-H.; Pan, C.-J.; Ménétrier, M.; Delmas, C.; Hwang, B.-J.; J. Phys. Chem. C 2013, 117, 26493.
71. Bhatt, M.; O’Dwyer, C.; Phys. Chem. Chem. Phys.2015, 17, 4799.
72. Kramer, D.; Ceder, G.; Chem. Mater. 2009, 21, 3799. 73. Tan, H.; Takeuchi, S.; Bharathi, K. K.; Takeuchi, I.; Bendersky,
L. A.; ACS Appl. Mater. Interfaces 2016, 8, 6727.
74. Wu, B.; Wang, J.; Li, J.; Lin, W.; Hu, H.; Wang, F.; Zhao, S.; Gan, C.; Zhao, J.; Electrochim. Acta2016, 209, 315. 75. Cho, T. H.; Park, S. M.; Yoshio, M.; Hirai, T.; Hideshima, Y.;
76. Sun, Y. K.; Myung, S. T.; Park, B. C.; Prakash, J.; Belharouak, I.; Amine, K.; Nat. Mater.2009, 8, 320.
77. Lim, J. H.; Bang, H.; Lee, K. S.; Amine, K.; Sun, Y. K.; J. Power Sources2009, 189, 571.
78. Sun, Y. K.; Myung, S. T.; Park, B. C.; Amine, K.; Chem. Mater.
2006, 18, 5159.