Overweight and Cardiovascular Risk among Young Adults
Followed-up for 17 Years: The Rio de Janeiro Study, Brazil
Flávia Lopes Fonseca, Andréa Araújo Brandão, Roberto Pozzan, Érika Maria Gonçalves Campana, Oswaldo Luiz Pizzi,
Maria Eliane Campos Magalhães, Elizabete Vianna de Freitas, Ayrton Pires Brandão
Universidade do Estado do Rio de Janeiro, Rio de Janeiro, RJ - Brazil
Abstract
Background: The adoption of primary prevention measures among young people has a favorable impact on the context of cardiovascular diseases.
Objectives: To assess blood pressure (BP) and cardiovascular risk variables among young adults stratified according to the body mass index (BMI) behavior obtained along 17 years, since childhood/adolescence (C/A).
Methods: Three assessments were carried out in 115 individuals pertaining to the study cohort of Rio de Janeiro, Brazil. A1: 12.97 ± 1.48 years old; A2: 21.90 ± 1.71 years old; A3: 30.65 ± 2.00 years olds and divided into three groups according to BMI in the three assessments: Group N (always normal BMI; n=46), Group L (varying BMI; n=49) and Group O/O (always increased BMI; n=20). In A1, A2 and A3, BP and BMI were obtained. In A2 and A3, glucose (G) and lipidic profile were dosed. Also in A2, insulin (INS) was dosed and HOMA-IR was calculated. In A3, the measurement of waist circumference (WC), abdomen/hip relation (AHR) and body fat percentage (%BF) were added.
Results: 1) Group O/O presented higher mean values of increased BP (p<0.0001) at the three assessments; 2) In A3, Group O/O showed higher mean values for WC, AHR and %BF and prevalence of increased WC and metabolic syndrome (MS) (p<0.0001); 3) higher mean values were observed for INS, HOMA-IR, LDL-c in A2, and G, cholesterol, LDL-c and triglycerides in A3 for Group O/O (p<0.05); 4) masculine sex and O/O at A1 determined higher risk for MS occurrence in adult age.
Conclusion: The presence of O/O since C/A was associated with higher BP values, anthropometric indexes and higher prevalence of MS in the young adult phase. (Arq Bras Cardiol 2010;94(2): 193-201)
Key Words: Blood pressure; body weights and measures; cardiovascular risk; adolescents.
Mailing address: Flávia Lopes Fonseca •
Av. 28 de setembro, 77 sala 251 - Vila Isabel - 20551-030 - Rio de Janeiro, RJ - Brazil
E-mail: [email protected]
Manuscript received November 17,2008; revised manuscript received April 15, 2009; accepted May 15 2009.
Introduction
Despite therapeutic advances, the cardiovascular disease, especially it presentation as coronary arterial disease (CAD), remains as the main death cause in the whole world1.
Several epidemiological studies on adults have clearly pointed out the relation between cardiovascular risk factors (CVF) and the CAD development, and among the implicated risk factors, the most important ones are arterial hypertension (AH), dislipidemia, smoking, sedentarism and obesity, particularly central distribution obesity1.
Similarly to adults, among young people, cardiovascular risk factors are also implicated in this determinism and have crucial importance if they tend to repeat and worsen along the years2-6. In this context, we highlight the Bogalusa study that,
based on many cohorts, demonstrated that cardiovascular risk
factors are present since the childhood/adolescence (C/A)7 and
have a relation to atherosclerotic lesions evidenced in studies of necropsy in young individuals8-10.
Data on overweight/obesity (O/O) in Brazilian population reinforce its increased prevalence in early age groups, as it may vary from 18.8% to 26.3% in Brazilian cohorts comprising children and adolescents11-13.
Body fat (BF) distribution is as important as O/O. The relation between central body fat and health risk is already established, and is more reliable than the obesity degree itself14-18.
In this manner, the necessity of identifying these abnormalities since C/A with the purpose of identifying individuals with higher risk for cardiovascular diseases is clear7.
Besides, the strong relation between obesity and the remaining cardiovascular risk factors is well establishes, and many authors suggest that obesity represents the common and favoring link in the aggregation of these risk factors. Vague19, since 1956, included the central obesity as one of
Face to the exposed, the present study had the objective of assessing BP and cardiovascular risk factors variables in young individuals stratified according to their BMI behavior obtained along 17 years, since C/A.
Methods
The studied sample were from Estudo do Rio de Janeiro
(ERJ), a research line on BP and other cardiovascular risk factors in young people and their families developed at Universidade do Estado do Rio de Janeiro (UERJ), Brazil, since 19832-6.
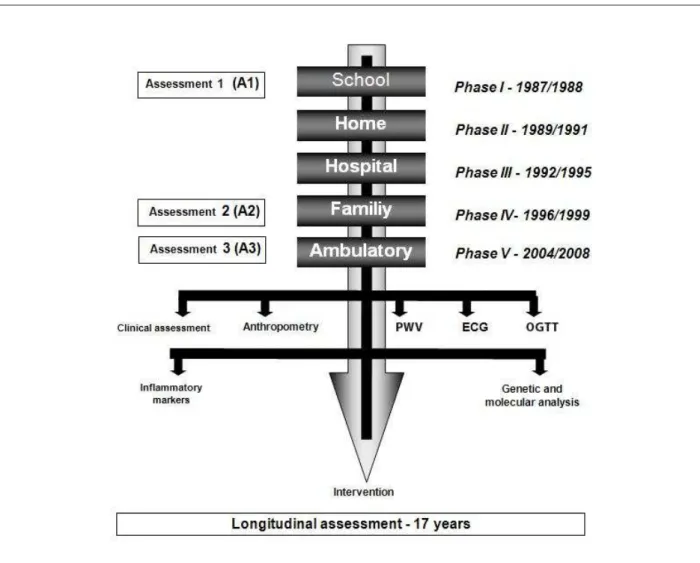
The study was performed in two stages: first, children from 6 to 9 years old were assessed (1983-1986) in two phases: school phase and home phase, with the objective of creating BP normality curves based on sex and age group. In the second phase, children and adolescents from 10 to 15 years old were assessed (1987-1999) in five phases: school phase (1987-1988), home phase (1989-1991), hospital phase (1992-1995), family phase (1996-1999)2-5 and ambulatory phase
(2004-2008)6, with the objective of evaluating the behavior
of cardiovascular risk factors variables and their relation with BP, since C/A as well as the presence of lesions in target-organs
Figure 1 - Algorithm of Estudo Rio de Janeiro – Second stage; PWV - pulse wave velocity; ECG - electrocardiogram; OGTT - oral glucose tolerance test.
of AH in the young individuals and their families. The present study is part of the ambulatory phase of the 2nd stage of ERJ6
(Figure 1).
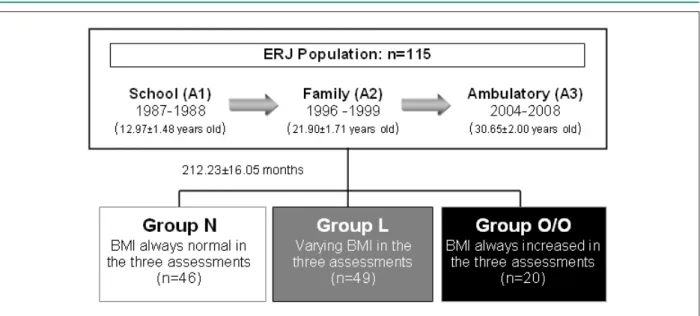
In the present assessment, 115 young people of both sexes were included and denominated as target-students. Three assessments of the second stage of ERJ were considered: A1 (school phase: 10 to 15 years old / 1987-1988), A2 (family phase: 18 to 26 years old / 1996-1999) and A3 (ambulatory phase: 26 to 31 years old / 2004-2008) (Figure 1).
According to the BMI obtained from the three assessments along 17 years, three groups were created: Group N (always normal BMI; n=46), Group L (varying BMI; n=49) and Group O/O (always increased BMI; n=20) (Figure 2).
This research was approved by the Ethics Committee of University Hospital Pedro Ernesto (HUPE, acronym in Portuguese) and all the assessed individuals and/or their legal responsible adults signed the informed consent.
Figure 2 - - Description of the studied population.
high socioeconomic level (SEL) was carried out based on monthly gains of parents, their professions, place of residence and school localization, according to criteria established by Secretaria Estadual de Educação do Rio de Janeiro. Moreover, BP, weight (W) and height (H) were obtained, and BMI was calculated. At A2 and A3, after a 12-hour fast, glucose (G), cholesterol, HDL-c, triglycerides (TG) were dosed, and the LDL-c was calculated. Also at A2, insulin dosage and HOMA-IR calculus were performed. In A3, the measurement of waist circumference (WC), abdomen/hip relation (AHR) and the measurement of cutaneous fold (CF) with the calculation of body fat percentage (%BF) were added.
Increased BP at A1 was defined in A1 according to the values that corresponded to 95 Percentile obtained in ERJ when this population’s curves for blood pressure were created. At A2 as much as at A3, the criteria established by Brazilian directives for arterial hypertension in vigour at the moment of the study were adopted. At A1, increased BP was considered
when B� ≥ 95 �ercentile for sex and age20, and at A2 and A3
when B�≥140/90 mmHg21.
BMI was obtained by means of the quotient: BMI = weight (kg) / height2 (m) for the classification of the nutritional status,
according to World Health Organization22. Values of BMI
between 18.50 kg/m² and 24.99 kg/m² were considered normal; when BMI values were between 25 kg/m² and 29.99 kg/m2 was considered overweight and when BMI≥30 kg/m2 it
was considered obesity2,22.
WC measurement was obtained by means of an inextensible measuring stick at the mean point between iliac peak and the inferior border of the last rib23. Values were
defined as increased when WC>102 cm for men and >88 cm for women24.
For %BF calculation, body density was firstly determined (bD) according to Durnin and Womersley equation25 by means of
cutaneous fold measuring: tricipital cutaneous fold (TCF), biciptal cutaneous fold (BCF), subescapular cutaneous fold (SECF) and suprailiac cutaneous fold (SICF). Following, %BF was obtained according to Siri’s equation26.
The presence of MS was defined according to I Brazilian Directive for MS24, once the cut point ≥100 mg/dL was
adopted for fast glucose, as proposed by Grundy et al27.
For the metabolic variables, glycemia <100 mg/dL, was considered a normal value, glycemia between 100 mg/dL and 126 mg/dL was considered glucose intolerance range,
and glycemia ≥126 mg/dL was considered diabetes mellitus
(DM)28. The normality values for lipidic profile followed the
recommendations of the IV Brazilian Directive on Dislipidemia and Atherosclerosis Prevention29.
The collected information was stored in one single database generated by Microsoft Access. Data were assessed by means of the statistical software SPSS for Windows, version 8.0, Copyright SPSS Inc. 1989-1997, and the following statistical tests were used: Variance analysis, Tukey’s test, Kruskal-Wallis non-parametric test, multiple comparisons non-parametric test and chi-square test.
Results
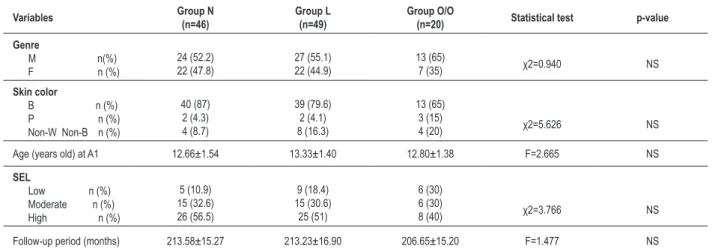
A group of 115 individuals, 64 men (55.7%) and 51 women (44.3%), mean age 30.65 ± 2.00 years old (27 to 36 years old) was studied in a follow-up of 212.23 ± 16.05 months. The epidemiological characteristics are presented on Table 1.
For all the studied epidemiological variables (genre, skin color, socioeconomic level at A1 and follow-up period of the study), groups were similar (Table 1).
As the distribution of BP Percentiles were assessed at A1 by groups, we observed that, in Group O/O, 70% of
the individuals presented B� �ercentile ≥95, 20% had
BP Percentile between 50 and 95, and 10% presented BP
�ercentile ≤50. These values for Group N were 19.6%, 32.6%
and 47.8%, respectively. For Group L, the percentages were 44.9%, 16.3% and 38.8%, respectively (p<0.001).
Table 1 - Epidemiological characteristics of the groups stratiied by BMI behavior at the three assessment moments
Variables Group N
(n=46)
Group L (n=49)
Group O/O
(n=20) Statistical test p-value
Genre
M n(%) F n (%)
24 (52.2) 22 (47.8)
27 (55.1) 22 (44.9)
13 (65)
7 (35) χ2=0.940 NS
Skin color
B n (%) P n (%) Non-W Non-B n (%)
40 (87) 2 (4.3) 4 (8.7)
39 (79.6) 2 (4.1) 8 (16.3)
13 (65) 3 (15)
4 (20) χ2=5.626 NS
Age (years old) at A1 12.66±1.54 13.33±1.40 12.80±1.38 F=2.665 NS
SEL
Low n (%) Moderate n (%) High n (%)
5 (10.9) 15 (32.6) 26 (56.5)
9 (18.4) 15 (30.6) 25 (51)
6 (30) 6 (30)
8 (40) χ2=3.766 NS
Follow-up period (months) 213.58±15.27 213.23±16.90 206.65±15.20 F=1.477 NS
Group N - group with BMI always normal at the three assessments; Group L - group with varying BMI in the three assessments; Group O/O - group with BMI always increased in the three assessments; M - male; F - female; W - white; B - Black; Non-W Non-B - non-white non-black color; SEL - socioeconomic level; F - variance analysis; χ2 - chi-square.
pressure (SBP) and diastolic blood pressure (DBP) values significantly higher at the three moments of assessment in comparison to Group N (p<0.0001) (Table 2).
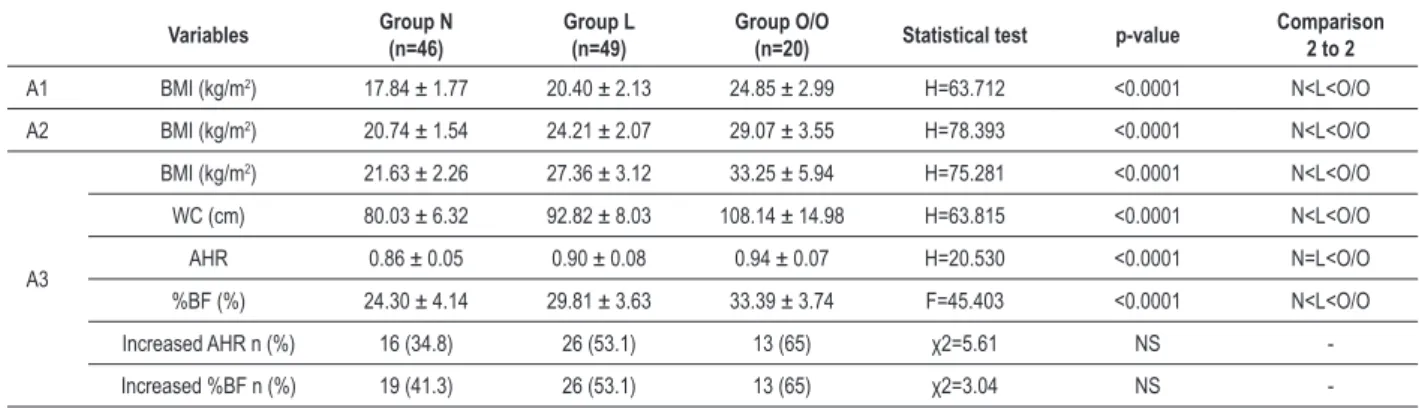
In the analysis of anthropometric variables, we found the prevalence of 25.2% for O/O at A1, 30.4% at A2 and 53.9% at A3 in the general studied population. In comparisons between groups, we observed that Group O/O had higher mean values for WC, AHR and %BF in Group N at A3, all statistically significant (Table 3). Children and adolescents who maintained their weights in compliance with normality (Group N) presented and increase of 21 kg and 3.8 kg/m2, respectively,
for weight and BMI along the 17 years of follow-up, while among those whose BMI remained high (Group O/O), there was an increase of 38.7 kg for weight and 8.4 kg/m2 for BMI
along the 17-year follow-up.
Abdominal obesity assessed through increased waist circumference was present in 38.3% of the assessed individuals at the current phase of the study (A3). The prevalence of increased AHR was 47.8%, while for increased %BF the value was 50.9%.
Table 2 - Mean ± standard deviations of systolic and diastolic blood pressure of groups at A1, A2 and A3, with stratiication according to BMI
behavior in the three assessment moments
Variables Group N
(n=46)
Group L (n=49)
Group O/O
(n=20) Statistical test p-value
Comparison 2 to 2
A1 SBP (mmHg) 108.87 ± 12.83 115.67 ± 14.85 119.00 ± 14.76 F=4.613 0.012 N=L<O/O
DBP (mmHg) 57.89 ± 12.48 64.37 ± 14.21 66.10 ± 12.30 F=3.966 0.022 N=L<O/O
A2 SBP (mmHg) 117.74 ± 9.97 127.08 ± 16.55 132.60 ± 14.22 H=15.536 <0.0001 N<L=O/O
DBP (mmHg) 74.52 ± 8.02 81.02 ± 12.25 82.10 ± 12.49 F=5.561 0.005 N<L<O/O
A3 SBP (mmHg) 112.71 ± 12.81 124.54 ± 13.53 136.80 ± 18.93 F=20.841 <0.0001 N<L<O/O
DBP (mmHg) 73.73 ± 10.57 82.46 ± 10.24 91.80 ± 17.40 F=16.912 <0.0001 N<L<O/O Group N - group with BMI always normal at the three assessments; Group L - group with varying BMI in the three assessments; Group O/O - group with BMI always increased in the three assessments; SBP - systolic blood pressure; DBP - diastolic blood pressure; F - variance analysis; H - Kruskal-Wallis.
The comparison of prevalence of increased WC reached a statistically significant difference between groups, with prevalence of 8.7% and 75% in Groups N and O/O (p<0.0001), respectively. There were no differences between groups for increased AHR or %BF prevalence (Table 3).
When the metabolic variables were assessed, higher mean values for insulin, HOMA-IR, LDL-c at A2 in Group O/O were observed, as well as glucose, cholesterol, LDL-c and triglycerides at A3 in the same group (O/O) in comparison to the other studied groups. For the remnant variables, there were no differences between groups, though Group O/O had always presented mean values higher than those observed in Groups L and N, as described in Table 4.
Table 3 - Anthropometric variables of the groups stratiied by BMI behavior at the three assessment moments
Variables Group N
(n=46)
Group L (n=49)
Group O/O
(n=20) Statistical test p-value
Comparison 2 to 2
A1 BMI (kg/m2) 17.84 ± 1.77 20.40 ± 2.13 24.85 ± 2.99 H=63.712 <0.0001 N<L<O/O
A2 BMI (kg/m2) 20.74 ± 1.54 24.21 ± 2.07 29.07 ± 3.55 H=78.393 <0.0001 N<L<O/O
A3
BMI (kg/m2) 21.63 ± 2.26 27.36 ± 3.12 33.25 ± 5.94 H=75.281 <0.0001 N<L<O/O
WC (cm) 80.03 ± 6.32 92.82 ± 8.03 108.14 ± 14.98 H=63.815 <0.0001 N<L<O/O
AHR 0.86 ± 0.05 0.90 ± 0.08 0.94 ± 0.07 H=20.530 <0.0001 N=L<O/O
%BF (%) 24.30 ± 4.14 29.81 ± 3.63 33.39 ± 3.74 F=45.403 <0.0001 N<L<O/O
Increased AHR n (%) 16 (34.8) 26 (53.1) 13 (65) χ2=5.61 NS -Increased %BF n (%) 19 (41.3) 26 (53.1) 13 (65) χ2=3.04 NS -Group N - group with BMI always normal at the three assessments; -Group L - group with varying BMI in the three assessments; -Group O/O - group with BMI always increased in the three assessments; BMI - body mass index; WC - waist circumference; AHR - abdomen/hip relation; %BF - percentage of body fat; kg, kilogram; m - meters; kg/m2, kilogram per square meter; cm - centimeters; % - percentage; F - variance analysis; H - Kruskal-Wallis; χ2- chi-square.
Table 4 - Mean ± standard deviations of metabolic variables obtained at A2 and A3 from groups stratiied according to BMI behavior in the
three assessment moments
Metabolic variables Group N
(n=46)
Group L (n=49)
Group O/O
(n=20) Statistical test p-value
Comparison 2 to 2
Glucose A2 (mg/dL) A3
92.05 ± 6.97 78.34 ± 10.78
92.22 ± 9.97 84.33 ± 13.66
96.42 ± 6.12 87.50 ± 11.05
H=4.578 F=4.606 NS 0.012 -N<L<O/O
Total cholesterol A2 (mg/dL) A3
170.57 ± 29.15 175.33 ± 30.17
177.93 ± 34.94 187.06 ± 41.46
191.84 ± 35.97 202.60 ± 32.76
F=2.791 F=3.970 NS 0.022 -N<L<O/O HDL-c A2
(mg/dL) A3
49.91 ± 12.83 53.11 ± 12.95
46.66 ± 13.87 49.22 ± 14.15
41.42 ± 8.20 45.40 ±15.31
F=3.040 F=2.012
NS
NS -
LDL-c A2 (mg/dL) A3
104.59 ± 23.04 105.19 ± 25.92
113.72 ± 28.44 115.35 ± 35.17
129.02 ± 29.64 130.47 ± 25.76
F=4.275 F=4.275 0.005 0.017 N<L<O/O N<L<O/O Triglycerides A2
(mg/dlL A3
80.34 ± 33.51 91.89 ± 55.11
87.75 ± 43.64 107.23 ± 60.29
107.00 ± 46.23 133.60 ± 56.73
F=3.376 F=3.376 NS 0.038 -N<L<O/O Insulin (µUI/mL) A2 10.54 ± 4.10 15.28 ± 8.40 19.79 ± 19.47 H=7.043 0.030 N<L<O/O HOMA-IR A2 2.42 ± 1.04 3.55 ± 2.04 4.74 ± 4.56 H=6.242 0.044 N<L<O/O
Group N - group with BMI always normal at the three assessments; Group L - group with varying BMI in the three assessments; Group O/O - group with BMI always increased in the three assessments; mg/dL - milligram per deciliter; µUI/mL - international microunits per milliliter; HOMA-IR - homeostasis model assessment for insulin resistance; F - variance analysis; H - Kruskal-Wallis.
the association of increased BP and presence of O/O, while in Group N the majority of the studied children and adolescents had normal BP and BMI. In this manner, the association of increased BP with presence of O/O was present in 70%, 35% and 70% of the individuals from Group O/O assessed at A1, A2 and A3, respectively, while in Group N the prevalence of assessed individuals that did not present association of increased BP and O/O presence was 80,4% at A1, 91,3% at A2 and 91,3% at A3 (Figure 3).
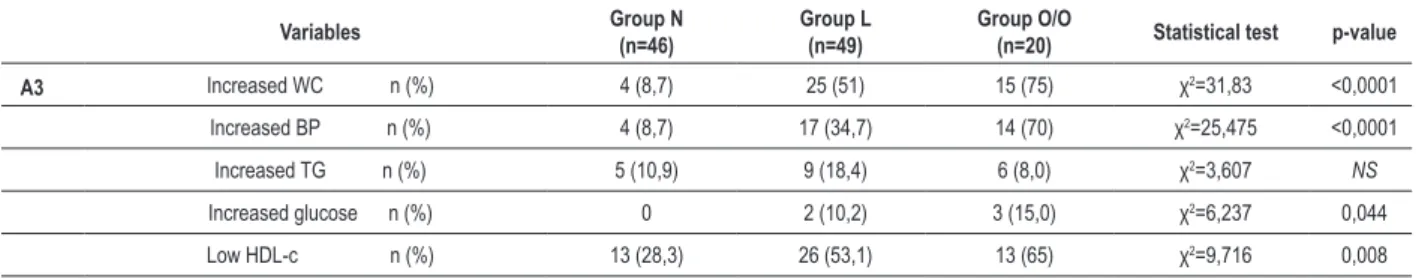
As the aggregation of cardiovascular risk factors was assessed, the prevalence of alterations in the components used for the classification of MS at the current study phase (A3) were described in Table 5: Increased SBP and/or DBP, increased WC, increased TG and glucose and low HDL-c. For all the assessed components, except for TG, the prevalence of these variables’ alterations was higher in Group O/O in comparison to Groups L and N (p<0.05).
With regard to the presence of MS, 28.7% of the studied individuals fulfilled the criteria required for the diagnosis,
and Group O/O presented a higher MS prevalence (60%) in relation to Group N (8.7%) and to Group L (34.7%) (p<0.0001).
The relative risk for the occurrence of metabolic syndrome in the young adult age group (A3) was assessed by means of logistic regression analysis. Genre, increased BP and the presence of O/O were considered as independent variables at A1. We observed that male genre and the presence of O/O in the school determined higher chances of MS occurrence in the current phase of the study (OddsRatio 32.66; 95%CI: 6.47-164.89 and Odds Ratio 4.13; 95%CI: 1.13-15.10, respectively).
Discussion
Many studies30-32 have clearly demonstrated that isolate or
Figure 3 - - Prevalence of the four different models of association between presence/absence of increased BP and the presence/absence of O/O from groups N, L and O/O at A1, A2 and A3. A1 - school phase; A2 - family phase; A3 - ambulatory phase; Group N - group with BMI always normal at the three assessments; Group L - group with varying BMI in the three assessments; Group O/O - group with BMI always increased in the three assessments; BP- O/O - absence of increased BP and absence of overweight/obesity; BP- O/O+ - absence of increased BP with presence of overweight/obesity; BP+ O/O - presence of increased BP with absence of overweight/obesity;
In this context, the ERJ is a line of research on BP and cardiovascular risk factors and have followed-up young people during 17 years, accomplishing several assessments along this period. It is important to emphasize that this series’ original design was characterized by the follow-up of individuals with distinct BP behaviors in school phase: with Percentile of
B�≤50 and ≥95. Hence, in subsequent phases of the study,
prevalence rates of BP higher than those observed in the general population of this age group are expected. As O/O is strongly related to BP in this age group, it is possible that the currently constituted groups do not reflect the characteristics of the general population, though it is a school population.
One of the first observational studies that showed relation between cardiovascular risk factors and CAD was the
Framingham study. Among the various assessed risk factors, O/O always showed to be strongly related to CAD33.
In the present study, at A1, a prevalence of 25.2% of O/O
was observed, considering BMI≥ �ercentile 85 for sex and
age as cut point. It is important to emphasize that these values result from studies carried out in non-Brazilian populations, and it is possible that national curves for BMI could show different values, what would modify such finding.
At A3, O/O was observed in 53.9% of the studied individuals, and in the same population, an increased in the
prevalence of overweight along the years was observed, which confirms other studies’ results11-13.
Another important finding was that Group O/O since childhood and adolescence presented higher mean values of BP and higher percentage of individuals with increased BP in all the assessments. As reinforcing this association between overweight and AH along the years, higher mean values for SBP and DBP were observed in the group who maintained abnormal BMI (Group O/O) in comparison to the group whose BMI values were always normal (Group N) along 17 years. The behavior of Group L (varying BMI) was notorious, for it presented an intermediate position with a tendency to proximity of Group O/O in the majority of assessments.
Table 5 - Prevalence of alteration in components involved in MS classiication of groups stratiied according to BMI behavior at A3
Variables Group N
(n=46)
Group L (n=49)
Group O/O
(n=20) Statistical test p-value
A3 Increased WC n (%) 4 (8,7) 25 (51) 15 (75) χ2=31,83 <0,0001
Increased BP n (%) 4 (8,7) 17 (34,7) 14 (70) χ2=25,475 <0,0001
Increased TG n (%) 5 (10,9) 9 (18,4) 6 (8,0) χ2=3,607 NS
Increased glucose n (%) 0 2 (10,2) 3 (15,0) χ2=6,237 0,044
Low HDL-c n (%) 13 (28,3) 26 (53,1) 13 (65) χ2=9,716 0,008
Group N - group with BMI always normal at the three assessments; Group L - group with varying BMI in the three assessments; Group O/O - group with BMI always increased in the three assessments; BMI - body mass index; WC - waist circumference; BP - blood pressure; TG - triglycerides; % - percentage; Χ2 - chi-square.
at A3. In this manner, the present study has contributed to reinforce that this group of people, higher mean values and prevalence of increased BP are associated with the presence of O/O.
Confirming these data, several series have recognized the relation between O/O and BP, mainly SBP and weight and BMI variables2-6.
The relevance of the relation between overweight and increase in BP receives emphasis as we verify that child and adolescent obesity is implicated in the development of hypertension and obesity in adult life34 and mortality among
young adults35.
Just as important as overweight is the pattern of body fat deposition, specially it central distribution and its relation to the risk for cardiovascular disease16,17,36. An important
limitation of the anthropometric indexes most widely used in epidemiological studies (BMI, WC and AHR) is the fact that they do not reflect the same fat quantity due to specific characteristics of different populations, like ethnicity36.
In the current study phase, we demonstrated that Group O/O presented higher mean values of WC, AHR and %BF, and 38.3% of the individuals had increased WC. With regard to AHR, a study carried out in Rio de Janeiro showed that this indicator presented higher capability predictive of HA and smaller correlation to BMI than WC16. In a study carried
out in São Paulo, AHR and WC were similarly associated with AH17.
Concerning metabolic variables, in the present study, we observed statistically significant differences between groups for the studied lipidic variables, except for HDL-c. Higher mean values for LDL-c, insulin and HOMA-IR were observed at A2 in Group O/O, as well as higher mean values for G, LDL-c, total cholesterol and triglycerides at A3 in the same group (O/O) in comparison to the other studied groups. Although the longitudinal behavior of these variables since C/A was not studied, the findings suggest that an association of the metabolic variables with the presence of O/O, which is in accordance to literature37.
The concept of MS brought a new dimension for the understanding of cardiovascular disease in the last decades. Each component of the syndrome is associated with an individual increase of cardiovascular risk; however, when associated, this risk increases exponentially, also elevating the general and cardiovascular mortality rates in approximately
1.5 and 2.5 times, respectively23.
The classic Bogalusa Study longitudinally assessed variables involved in the MS diagnosis in a cohort of 1,020 children/ adolescents. The authors demonstrated that such variables coexisted for 16 years and that their degree of agglomeration in adult age (18-38 years old) was consistently higher than those observed in C/A (4-17 years old). There as an increase of 5.8 kg/m2 in BMI, 7.5 mmHg in mean BP and 0.45 points
in HOMA-IR, which indicates a worse metabolic profile as age raises38.
In the Brazilian population, the prevalence of MS is not known yet, partially because of the absence of a consensus in its definition and in the cut points of its components39. In the
present study, the prevalence of young adults with MS was 28.7%, and when we assessed MS in association with BMI behavior along 17 years, we observed that this prevalence is higher in Group O/O (8.7% in Group N, 35.7% in Group L and 60% in Group O/O), which demonstrates that the maintenance of overweight may contribute expressively to the occurrence of MS.
In accordance with these data, the present study demonstrated that male genre and the O/O in C/A constitute higher risks for the aggregation of cardiovascular risk factors, which is characterized as MS. A longitudinal study carried out with American children and adolescents demonstrated that abnormal values of BMI and WC in C/A determine increased risk for the development of MS in the adult age40.
The main limitation of this study is the same experimented by many cohorts reported in literature and is related to the longitudinal character of the follow-up, which determines progressive losses of a portion of the original sample. However, it is emphasized that the population sample of ERJ is a non-hospital sample, of school origin and that has been followed-up for the last 17 years, considered as the Brazilian cohort of this age group with the longest follow-up period till nowadays.
References
1. Fonseca LAM, Laurenti R. Epidemiologia das cardiopatias nas duas últimas décadas: dados internacionais, dados brasileiros. In: Giannini SD, Forti N, Diament J. Cardiologia preventiva: prevenção primária e secundária. São Paulo: Atheneu; 2000. p. 3-8.
2. Brandão AP. A importância do desenvolvimento físico no comportamento da curva de pressão arterial em crianças de 6 a 9 anos de idade. Arq Bras Cardiol. 1987; 48: 203-9.
3. Brandão AP, Brandão AA, Araujo EMM. The significance of physical development on blood pressure curve of children between 6 and 9 years of age and its relationship with familial aggregation. J Hypertens. 1989; 7 (Suppl. 1): S37-9.
4. Magalhães MEC, Pozzan R, Brandão AA, Cerqueira RCO, Roussoulières ALS, Czwarcwald C, et al. Early blood pressure level as a mark of familial aggregation of metabolic cardiovascular risk factors: The Rio de Janeiro Study. J Hypertens. 1998; 16: 1885-9.
5. Brandão AP, Brandão AA, Magalhães ME, Pozzan R. Médias de pressão arterial e prevalência de hipertensão arterial em uma amostra populacional brasileira: estudo do Rio de Janeiro. Arq Bras Cardiol. 1999; 73 (supl. 4): 76.
6. Fonseca FL, Brandão AA, Pozzan R, Campana EMG, Pizzi OL, Magalhães MEC, et al. A relação entre a pressão arterial e índices antropométricos na infância/adolescência e o comportamento das variáveis de risco cardiovascular na fase adulta jovem, em seguimento de 17 anos: estudo do Rio de Janeiro. Rev SOCERJ. 2008; 21 (5): 281-90.
7. Wattigney WA, Weber LS, Srinivisan SR, Berenson GS. The emergency of clinically abnormal levels of cardiovascular disease risk factor variables among young adults: the Bogalusa Heart Study. Prev Med. 1995; 24: 617-26.
8. Berenson GS, Srinivasan SR, Bao W, Newman WP III, Tracy RE, Wattigney WA. Association between multiple cardiovascular risk factors and atherosclerosis in children and young adults: the Bogalusa Heart Study. N Eng J Med. 1998; 338: 1650-6.
9. Burke GL, Cresanta JL, Shear CL, Miner MH, Berenson GS. Cardiovascular risk factors and their modification in children. Cardiol Clin. 1986; 4 (1): 33-46.
10. Berenson GS, Srnivasan SR. Bogalusa Heart Study Group. Cardiovascular risk factors in young with implications for aging: the Bogalusa Heart Study. Neurobiol Aging. 2005; 26: 303-7.
11. Giugliano R, Melo ALP. Diagnóstico de sobrepeso e obesidade em escolares: utilização do índice de massa corporal segundo padrão internacional. J Pediatr. 2004; 80: 129-34.
12. Nobre MRC, Domingues RZL, Silva AR, Colugnati FAB, Taddei JAC. Prevalências de sobrepeso, obesidade e hábitos de vida associados ao risco cardiovascular em alunos do ensino fundamental. Rev Assoc Med Bras. 2006; 52 (2): 118-24.
13. Fernandes RA, Rosa CSC, Segatto AFM, Silva CB, Oliveira AR, Júnior IFF. Estado nutricional de adolescentes segundo o índice de massa corporal. Motriz (Online). 2007; 13 (2): 106-13.
14. Oliveira CL, Mello MT, Cintra IP, Fisberg M. Obesidade e síndrome Metabólica na infância e adolescência. Rev Nutr. 2004; 17 (2): 237-45.
15. Ribeiro RQC, Lotufo PA, Lamounier JA, Oliveira RG, Soares JF, Botter DA. Fatores adicionais de risco cardiovascular associados ao excesso de peso em crianças e adolescentes: o estudo do coração de Belo Horizonte. Arq Bras Cardiol. 2006; 86 (6): 408-18.
16. Pereira RA, Sichieri R, Marins VMR. Razão cintura/quadril como preditor de
HA. Cad Saúde Públ. 1999; 15: 333-44.
17. Martins IS, Marinho SP. O potencial diagnóstico dos indicadores da obesidade centralizada. Rev Saúde Públ. 2003; 37: 760-7.
18. Filardo RD, Pires Neto C, Simões C. Indicadores antropométricos e da composição corporal de homens e mulheres entre 20 e 39,9 anos de idade. Rev Bras Cineantropom Desempenho Hum. 2001; 3 (1): 55-62.
19. Vague J. The degree of masculine differentiation of obesities: a factor determining predisposition to diabetes, atherosclerosis, gout and uric calculous disease. Am J Clin Nutr. 1956; 4: 20-34.
20. Brandão AP, Ferreira JO, Brandão AA, Pozzan R, Cerqueira RCO. Avaliação da pressão arterial em crianças e adolescentes: estudo do Rio de Janeiro. HiperAtivo. 1996; 3: 86-92.
21. Sociedade Brasileira de Cardiologia. V Diretrizes brasileiras de hipertensão arterial. Arq Bras Cardiol. 2007; 89 (3): 1-48.
22. WHO. World Health Organization. 1997. Global data base on child growth and malnutrition. Program of Nutrition [cited 2006 Jun 20]. Available from: <http:www.who.int/bmi/index.jsp>
23. Callaway CW, Chumlea WC, Bouchard C. Circumferences. In: Lohman TG, Roche AF, Martorell R (eds). Anthropometric standardization reference manual. Champaign: Human Kinetics Books; 1991. p. 44-5.
24. Sociedade Brasileira de Cardiologia. I Diretriz brasileira de diagnóstico e tratamento da síndrome metabólica. Arq Bras Cardiol. 2005; 84 (supl 1): 1-128.
25. Durnin JV, Womersley J. Body fat assessed from total body density and its estimation from skinfold thickness: measurements on 481 men and women aged from 16 to 72 years. Br J Nutr. 1974; 32: 77-97.
26. Siri WE. Body composition from fluids spaces and density: analyses of methods. In: Techniques for measuring body composition, Washington, DC: National Academy of Science and Natural Resource Council; 1961.
27. Grundy SM, Cleeman JI, Daniels SR, Donato KA, Eckel RH, Franklin BA, et al. Diagnosis and management of the metabolic syndrome: an American Heart Association; National Heart Lung, and Blood Institute. Circulation. 2005; 112; 2735-52.
28. Sociedade Brasileira de Diabetes (SBD). Diretrizes da Sociedade Brasileira de Diabetes sobre tratamento e acompanhamento do Diabetes Mellitus; 2006.
29. Sociedade Brasileira de Cardiologia. III Diretrizes brasileiras sobre dislipidemias e diretriz de prevenção da aterosclerose do Departamento de Aterosclerose da Sociedade Brasileira de Cardiologia. Arq Bras Cardiol. 2001; 77 (supl 3): 1-48.
30. Bao W, Threefoot AS, Srinivasan SR, Berenson GS. Essential hypertension predicted by tracking of elevated blood pressure from childhood to adulthood: the Bogalusa Heart Study. Am J Hypertens. 1995; 8 (7): 657-65.
31. Berenson GS. Childhood risk factors predict adult risk associated with subclinical cardiovascular disease. The Bogalusa Heart Study. Am J Cardiol. 2002; 90: 3L-7L.
32. Li S, Chen W, Srinivasan SE, Bond MG, Tang R, Urbina EM, et al. Childhood cardiovascular risk factors and carotid vascular changes in adulthood: the Bogalusa Heart Study. JAMA. 2003; 290: 2271-6.
33. Hubert HB, Feinleid M, McNamara PM, Castel WP. Obesity as an independent Potential Conflict of Interest
No potential conflict of interest relevant to this article was reported.
Sources of Funding
There were no external funding sources for this study.
Study Association
risk factor for cardiovascular disease: a 26-year follow-up of participants in the Framingham Heart Study. Circulation. 1983; 67 (5): 968-77.
34. Field AE, Cook NR, Gillman MW. Weight status in childhood as a predictor of becoming overweight or hypertensive in early adulthood. Obesity Res. 2005; 13: 163-9.
35. Must A, Jacques PF, Dallal GE, Bajema CJ, Dietz WH. Long-term morbidity and mortality of overweight adolescents: a follow-up of the Harvard Group Study of 1922 to 1935. N Engl J Med. 1992; 327: 1350-5.
36. Peixoto MRG, Benício MHD’Aquino, Latorre MRDO, Jardim PCBV. Circunferência da cintura e índice de massa corporal como preditores da hipertensão arterial. Arq Bras Cardiol. 2006; 87: 462-70.
37. Plourde G. Impact of obesity on glucose and lipid profiles in adolescents at different age groups in relation to adulthood. BMC Fam Pract. 2002; 3: 18-31.
38. Chen W, Srinivasan SR, Li S, Xu J, Berenson GS. Clustering of long-term trends in metabolic syndrome variables from childhood to adulthood in blacks and whites: the Bogalusa Heart Study. Am J Epidemiol. 2007; 166: 527-33.
39. Pozzan R. Hiperinsulinemia e agregação de fatores de risco cardiovascular em uma série de casos da população da cidade do Rio de Janeiro. [Tese]. Rio de Janeiro: Universidade Federal do Rio de Janeiro; 2002.