Proposal of a short-form
version of the Brazilian Food
Insecurity Scale
Proposta de versão curta da Escala
Brasileira de Insegurança Alimentar
I Programa de Pós-Graduação em
Epidemiologia. Universidade Federal de Pelotas. Pelotas, RS, Brasil
II Faculdade de Nutrição. Universidade
Federal de Pelotas. Pelotas, RS, Brasil
III Programa de Pós-Graduação em Saúde e
Comportamento. Universidade Católica de Pelotas. Pelotas, RS, Brasil
Correspondence: Leonardo Pozza dos Santos
Rua Marechal Deodoro, 1160 3° piso Centro Caixa Postal 464
96020-220 Pelotas, RS, Brasil E-mail: [email protected] Received: 10/18/2013
Approved: 5/12/2014
Article available from: www.scielo.br/rsp
ABSTRACT
OBJECTIVE:To propose a short version of the Brazilian Food Insecurity Scale.
METHODS: Two samples were used to test the results obtained in the analyses in two distinct scenarios. One of the studies was composed of 230 low income families from Pelotas, RS, Southern Brazil, and the other was composed of 15,575 women, whose data were obtained from the 2006 National Survey on Demography and Health. Two models were tested, the irst containing seven questions, and the second, the ive questions that were considered the most relevant ones in the concordance analysis. The models were compared to the Brazilian Food Insecurity Scale, and the sensitivity, speciicity and accuracy parameters were calculated, as well as the kappa agreement test.
RESULTS: Comparing the prevalence of food insecurity between the Brazilian Food Insecurity Scale and the two models, the differences were around 2 percentage points. In the sensitivity analysis, the short version of seven questions obtained 97.8% and 99.5% in the Pelotas sample and in the National Survey on Demography and Health sample, respectively, while speciicity was 100% in both studies. The ive-question model showed similar results (sensitivity of 95.7% and 99.5% in the Pelotas sample and in the National Survey on Demography and Health sample, respectively). In the Pelotas sample, the kappa test of the seven-question version totaled 97.0% and that of the ive-question version, 95.0%. In the National Survey on Demography and Health sample, the two models presented a 99.0% kappa.
CONCLUSIONS: We suggest that the model with ive questions should be used as the short version of the Brazilian Food Insecurity Scale, as its results were similar to the original scale with a lower number of questions. This version needs to be administered to other populations in Brazil in order to allow for the adequate assessment of the validity parameters.
DESCRIPTORS: Food Security. Scales. Questionnaires, utilization. Validation Studies.
Leonardo Pozza dos SantosI
Ivana Loraine LindemannII
Janaína Vieira dos Santos MottaI,III
Gicele MintemII
Eliana BenderII
The fulilment of the right to regular and permanent access to suficient amounts of high-quality foods without hindering the access to other essential needs is known as food security.a Food insecurity levels range
from worry and anguish brought by the uncertainty of having food regularly to lack of food.a,b
An instrument that assesses food insecurity was developed in the 1990s in the United States.7
Subsequently, it was modiied and adapted in many countries.1,2,6,8 To aid studies of shorter duration and/or lower inancial resources, Blumberg et al
RESUMO
OBJETIVO:Propor versão curta da Escala Brasileira de Insegurança Alimentar. Foram analisados dois estudos constituídos por amostra de 230 famílias de baixa renda, de Pelotas, RS, e de 15.575 mulheres com base nos dados da Pesquisa Nacional de Demograia e Saúde, de 2006.
MÉTODOS:Foram utilizadas duas amostras para testar os resultados obtidos nas análises em dois cenários distintos. Um dos estudos foi composto por 230 famílias de baixa renda, de Pelotas, RS, e o outro, por 15.575 mulheres, cujos dados foram obtidos na Pesquisa Nacional de Demograia e Saúde de 2006. Foram testados dois modelos, o primeiro contendo sete questões e o segundo as cinco consideradas mais relevantes na análise de concordância. Os modelos foram comparados à Escala Brasileira de Insegurança Alimentar, calculando-se os parâmetros de sensibilidade, especiicidade e acurácia e o teste de concordância de kappa.
RESULTADOS: Comparando as prevalências de insegurança alimentar entre a Escala Brasileira de Insegurança Alimentar e os dois modelos, as diferenças icaram em torno de dois pontos percentuais. Na análise de sensibilidade, a versão curta de sete questões obteve 97,8% e 99,5% na amostra de Pelotas e da PNDS, respectivamente, enquanto a especiicidade foi de 100% em ambos os estudos. O modelo de cinco questões mostrou resultados semelhantes (sensibilidade de 95,7% e 99,5% na amostra de Pelotas e da PNDS, respectivamente). A versão de sete questões apresentou teste de kappa de 97,0% e a versão de cinco questões, de 95,0%, na amostra de Pelotas. Já na amostra da PNDS, os dois modelos apresentaram kappa de 99,0%.
CONCLUSÕES:Sugere-se o modelo com cinco questões para ser utilizado como versão curta da Escala Brasileira de Insegurança Alimentar, visto que apresentou resultados semelhantes à escala original com menor número de questões. É necessário que essa versão seja aplicada em outras populações do Brasil, de forma a permitir adequada avaliação dos parâmetros de validade.
DESCRITORES: Segurança Alimentar e Nutricional. Escalas. Questionários, utilização. Estudos de Validação.
INTRODUCTION
developed a scale with six questions, based on the original North American version.4
Brazil also has an adaptation of the scale, known as
Escala Brasileira de Insegurança Alimentar (EBIA
– Brazilian Food Insecurity Scale), which has been duly validated for the population and broadly used.3,9,16 However, some surveys do not use the EBIA due to the large number of questions and to the cost involved in administering them. National surveys have proposed to use the North American scale with six questions to investigate the food insecurity situation,11,12 but a
a Lei nº 11.346, de 15 de setembro de 2006. Cria o Sistema Nacional de Segurança Alimentar e Nutricional – SISAN com vistas em assegurar
o direito humano à alimentação adequada e dá outras providências. Brasília (DF); 2006. Artigo 3. [cited 2014 Jul 6]. Available from: http://www.planalto.gov.br/ccivil_03/_ato2004-2006/2006/Lei/L11346.htm
b Bickel GW, Nord M, Price C, Hamilton W, Cook J. Measuring food security in the United States: guide to measuring household food security.
study carried out in the city of Pelotas, RS, Southern Brazil, veriied that there is no satisfactory concordance between the EBIA and this scale.13
This study aimed to propose a short version of the Brazilian Food Insecurity Scale.
METHODS
Two samples were used in this study. The irst was composed of 230 low income families living in the city of Pelotas and the second was composed of 15,575 women of childbearing age, aged 15 to 49 years, whose data were obtained from the 2006 Pesquisa
Nacional de Demograia e Saúde (PNDS – National Survey on Demography and Health).c
The Pelotas sample is part of a cross-sectional study carried out between April and October 2011 in the catchment area of the Unidade de Saúde da Família
(USF – Family Health Unit) of a neighborhood located on the periphery of the city.13 This study aimed to
validate the short version of the food insecurity scale proposed by Bickel et alb (2000) and it was targeted
at the families that lived in that neighborhood. The second sample (PNDS) analyzed the health of women of reproductive age and of children younger than ive years. Complementary information on the methodology can be obtained from the above-mentioned studies.13,c
The two samples were used to test the results of the analysis in different scenarios, which made the conclu -sions more robust. In both samples, the EBIA was administered to the person responsible for food in the household. The questions referred to the period of three months prior to the interview. To each afirmative answer, the value “1” was assigned. The scale admin -istered in PNDS was different from the original EBIA in terms of the number of questions: 16 in the PNDS and 15 in the original one. This did not inluence the analysis, as this change originated from the division of question 5 in two questions, which were subsequently regrouped in the analysis.
In both studies, to classify food security/insecurity, the score was calculated by considering the number of positive answers in each item of the scale, according to the household’s age composition. Only eight questions applied to households without individuals younger than 18 years. Therefore, the maximum score that could be achieved would be eight. For households with individuals younger than 18 years, the complete questionnaire was administered, with a maximum score of 15. The EBIA’s score criterion and cut-off
point allows for the division in four categories and three levels of intensity – food security (FD), mild, moderate and severe food insecurity –, attributed according to the presence or absence of individuals younger than 18 years in the household.
As the short version proposed here must serve as a food insecurity tracker among families and must func -tion in the same way for households with and without individuals younger than 18 years, the questions of the scale referring to this age group were excluded from the proposed scale. In the last Technical Workshop for the Analysis of the Household Measurement Scale of Food Insecurity,d the exclusion of the association between
weight loss and food insecurity was approved, as well as the exclusion of a repetitive item: question 9. After these exclusions, seven questions remained from the original scale. Based on these seven questions, two short-scale models for food insecurity assess-ment were tested. The irst contained the seven ques-tions (Table 1A).
To construct the second model, a concordance analysis was performed with the full scale, that is, we investi -gated which questions had the highest proportions of positive answers among families with food insecurity. After the analysis, the second model was composed of the ive questions that were considered most relevant regarding concordance with the full scale (Table 1B).
To compare the proposed models with the full version of the EBIA, initially, the concordance of positive answers of families with food insecurity was analyzed in each remaining question, so as to detect the most rele-vant questions in the identiication of food insecurity. Subsequently, the models (of seven and ive questions) were compared to the EBIA, which is considered the gold standard. The following parameters were calcu -lated: sensitivity – proportion of individuals with food insecurity, through the EBIA, with a positive result in the short versions –, speciicity – proportion of individ-uals without food insecurity and with a negative result in the short versions –, and accuracy – the proposed model’s probability of being in accordance with the gold standard for all the studied individuals. In addi -tion, an agreement test (kappa index) was performed.5
The analyses were carried out in the Stata program, version 12.0 (Stata Corp., College Station, United States). Due to the fact that the PNDS database has a complex sample design, all the estimates were weighted, considering the design effect and also the calibration according to estimates of the Brazilian popu -lation, by means of the “svy” command.
c Ministério da Saúde, Centro Brasileiro de Análise e Planejamento. Pesquisa Nacional de Demografia e Saúde da Criança e da Mulher.
Brasília (DF); 2008. Available from: http://bvsms.saude.gov.br/bvs/pnds/img/relatorio_final_pnds2006.pdf
d Ministério do Desenvolvimento Social e Combate à Fome, Secretaria de Avaliação e Gestão da Informação. Relatório da Oficina Técnica
RESULTS
In the Pelotas sample, 58.3% of the heads of households who were interviewed were men. Less than 20.0% had nine or more years of schooling and almost 75.0% was younger than 60 years. In the PNDS sample, almost half lived in the Southeast of Brazil and approximately 40.0% had nine or more years of schooling. As for food insecurity measured by the EBIA, we observed a prevalence of more than 60.0% in the irst sample and approximately 40.0% in the PNDS sample. Figure A shows the questions with the highest number of posi-tive answers in families with food insecurity (questions 1, 2, 3, 5 and 6). When this analysis was performed in the PNDS database, the same result was obtained (Figure B). Based on these results, we arrived at the ive-question version composed of questions 1, 2, 3, 5 and 6 of the EBIA. Table 1 shows the short version
based on seven questions of the EBIA (A) and the short version based on ive questions (B).
When we compared the prevalence of food insecurity that was found using the two proposed models with the EBIA, we observed that, while the full scale found a prevalence of approximately 60.0% in the Pelotas sample, the short version with seven questions showed a prevalence of 59.0% and the version with ive ques-tions, 58.0%. In the PNDS sample, the following preva-lences were found: 39.0% by the full scale, 38.8% by the one with seven questions and 38.1% by the version with ive questions (Table 2).
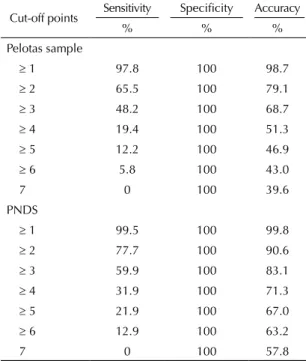
In the sensitivity and speciicity analysis, the short version with seven questions presented excellent results when the same cut-off point adopted by the EBIA to classify food insecurity was considered (one positive answer or more). Sensitivity was close to 98.0% for the Pelotas sample and almost 100% for the PNDS. In addi-tion, the result with highest accuracy is the cut-off point equal to “1”, which classiied correctly almost 100% of the individuals in both samples (Table 3).
Similar results were found in the proposed model with ive questions. The cut-off point with best results was, once again, the same recommended by the tradi -tional version. Furthermore, it was veriied that, for the Pelotas and the PNDS samples, sensitivity was 95.7% and 98.1%, respectively, and speciicity was 100% in both. Once more, for this cut-off point, accuracy was very high: 97.0% for the Pelotas sample and close to 100% for the PNDS sample (Table 4).
In the kappa statistical analysis, both the proposed models presented high agreement with the full version of the food insecurity scale, both in the Pelotas sample and in the 2006 PNDS sample. In the former, the seven-question version presented an agreement of 97.0%, and the ive-question version, of 95.0%. In the PNDS, both proposals presented an agreement of 99.0%.
DISCUSSION
Independently of the size of the proposed short version, both models showed high sensitivity and speciicity when compared to the EBIA, a method that is consid -ered the gold standard. In addition, the proposed models were accurate when they measured the prevalence of food insecurity, and their results were similar to those found by the original version. We highlight that this is the irst study that proposes a short version to measure food insecurity based on the EBIA.
Since its validation in 2004, the EBIA has been used in national surveys to measure families’ food insecu -rity level.15,c,e This scale aids policies that ight hunger
Table 1. Proposals for a food insecurity scale that is a reduced version of the Brazilian Food Insecurity Scale. Pelotas, RS, Southern Brazil, 2013.
(A) Proposal with seven questions
1) In the last 3 months, were you worried that the food in your home would end before you could buy, receive or produce more food?
2) In the last 3 months, did the food end before you had money to buy more?
3) In the last 3 months, did you run out of money and you could not have a healthy and varied diet?
4) In the last 3 months, did you or an adult in your home reduce the amount of food in your meals, or skip meals, because there was not enough money to buy food? 5) In the last 3 months, did you eat less than you thought you should because there was not enough money to buy food?
6) In the last 3 months, did you feel hungry but did not eat because you could not buy enough food?
7) In the last 3 months, did you or any other adult in your home spend one entire day without eating or had only one meal per day because there was no money to buy food? (B) Proposal with five questions
1) In the last 3 months, were you worried that the food in your home would end before you could buy, receive or produce more food?
2) In the last 3 months, did the food end before you had money to buy more?
3) In the last 3 months, did you run out of money and could not have a healthy and varied diet?
4) In the last 3 months, did you or an adult in your home reduce the amount of food in your meals, or skip meals, because there was not enough money to buy food?
5) In the last 3 months, did you eat less than you thought you should because there was not enough money to buy food?
and assesses people’s perception of foods and also the availability of foods in the household.14,15 Considering
the importance of verifying and/or monitoring the food situation,14 using a shorter scale based on the EBIA itself
and not on instruments that have not been validated for the Brazilian population can facilitate the measurement of food insecurity and the development of studies that have little time or insuficient resources to adminis-trate the full scale.
However, food insecurity is not easily measured, as diverse factors are associated with this condition, such as skin color, level of schooling and gender of the person of reference in the household,f,g and must
be considered in the assessment. The short version models proposed here do not aim to replace the EBIA, as they do not measure the degrees of intensity of food insecurity and do not detect families that live in hunger situation, which is characterized by a scenario of
a See Table 1.
Figure. Percentage of positive answers among families with food insecurity in the questionsa that remained in the proposal for a short version based on the Brazilian Food Insecurity Scale; (A) Pelotas sample, (B) sample of the 2006 National Survey on Demography and Health. Pelotas, RS, Southern Brazil, 2013.
0 10 20 30 40 50 60 70 80 90 100
Question 1 Question 2 Question 3
Question 5 Question 6 Question 7
Question 9
A
0 10 20 30 40 50 60 70 80 90 100
Question 1 Question 2 Question 3
Question 5 Question 6 Question 7
Question 9
B
f Instituto Brasileiro de Geografia e Estatística. Pesquisa Nacional de Amostra de Domicílios 2009: Segurança Alimentar 2004/2009. Rio de
Janeiro: IBGE; 2010.
g Ministério do Desenvolvimento Social. Plano Nacional de Segurança Alimentar e Nutricional: 2012/2015. Brasília (DF): Câmara
Interministerial de Segurança Alimentar e Nutricional; 2011.
Tabela 2. Prevalence of food insecurity according to the Brazilian Food Insecurity Scale and to the two short version proposals in two samples. Pelotas, RS, Southern Brazil, 2013.
Variable Pelotas sample PNDS-2006 sample
n % n %
EBIAa
Food security 91 39.6 8,998 61.0
Food insecurity 139 60.4 6,577 39.0
EBIAb
Food security 94 40.9 9,034 61.2
Food insecurity 136 59.1 6,541 38.8
EBIAc
Food security 97 42.2 9,121 61.9
Food insecurity 133 57.8 6,454 38.1
EBIA: Escala Brasileira de Insegurança Alimentar (Brazilian Food Insecurity Scale)
a Full scale.
Table 3. Sensitivity and specificity of the short version of the Brazilian Food Insecurity Scale, with seven questions.a
Pelotas, RS, Southern Brazil, 2013.
Cut-off points Sensitivity Specificity Accuracy
% % %
Pelotas sample
≥ 1 97.8 100 98.7
≥ 2 65.5 100 79.1
≥ 3 48.2 100 68.7
≥ 4 19.4 100 51.3
≥ 5 12.2 100 46.9
≥ 6 5.8 100 43.0
7 0 100 39.6
PNDS
≥ 1 99.5 100 99.8
≥ 2 77.7 100 90.6
≥ 3 59.9 100 83.1
≥ 4 31.9 100 71.3
≥ 5 21.9 100 67.0
≥ 6 12.9 100 63.2
7 0 100 57.8
a See Table 1.
Table 4. Sensitivity and specificity of the short version of the Brazilian Food Insecurity Scale, with five questions.a Pelotas,
RS, Southern Brazil, 2013.
Cut-off points Sensitivity Specificity Accuracy
% % %
Pelotas sample
≥ 1 95.7 100 97.4
≥ 2 58.9 100 75.2
≥ 3 29.5 100 57.4
≥ 4 12.2 100 46.9
5 0 100 39.6
PNDS
≥ 1 99.5 100 99.7
≥ 2 77.5 100 90.5
≥ 3 59.2 100 82.8
≥ 4 25.7 100 68.6
5 0 100 57.8
a See Table 1.
severe food insecurity. The irst scale that proposed to measure the household food insecurity level was created at the beginning of the 1990s in the United States of America.h Constituted of 18 questions, it encompasses
all the food insecurity severity levels observed in households with and without children.f Subsequently,
in 1999, a short version of the North American scale was developed containing six questions, with the aim of building a quicker and cheaper alternative to assess food insecurity.4
The differential of the present study was the use of two samples, one from a poor area of a medium-sized city in Brazil, and the other, representative of Brazilian women of childbearing age, which made the analysis become more robust. However, some limitations of the proposed instrument are: the impossibility of capturing other causes of food insecurity, such as the unavailability of adequate amounts of food in a certain community, neighborhood and/or region; the beliefs that restrict the consumption of available foods or some people’s lower access to foods;4 incapacity for distinguishing between
households with and without individuals younger than
18 years; higher risk of food insecurity; and, like the EBIA, incapacity for capturing the food insecurity measure in an individual way, as it relects a relative measure of the situation experienced by all the indi -viduals in the same household.
Given the above-mentioned circumstances and reasons, we suggest the use of the proposed model with ive questions, as its results were very similar to the original scale but with a lower number of questions compared to the proposed model with seven questions. In certain cases, like studies with very large samples, 14 questions increase the answering time; thus, the short version of the instrument will allow tracking the families in a food insecurity situation. If there is interest in verifying the food insecurity intensity degrees, the full scale can be subsequently adminis-tered only to the families classiied with food insecu-rity by the short version. Furthermore, many studies have used food insecurity in a dichotomous way (pres -ence or abs-ence), and, along this line, the short version is also an option of instrument.
To conclude, it is necessary to apply the short version with ive questions to population-based studies, in populations from different regions of Brazil, in order to attest its use as a food insecurity tracker and aid studies that investigate this condition, as well as the programs that aim to combat this problem.
h Hamilton WL, Cook JT, Thompson WW, Buron LF, Frongillo EA, Olson CM, et al. Household food security in the United States in 1995:
The authors declare no conflict of interest.
1. Albert PL, Sanjur D. La adaptacion y validación de una escala de seguridad alimentaria en una comunidad de Caracas, Venezuela. Arch Latinoam Nutr. 2000;50(4):334-40.
2. Alvarez MC, Estrada A, Montoya EC, Melgar-Quiñónez H. Validación de escala de la seguridad alimentaria doméstica en Antioquia, Colombia. Salud Publica Mex. 2006;48(6):474-81. DOI:10.1590/S0036-36342006000600005
3. Antunes MML, Sichieri R, Salles-Costa R. Consumo alimentar de crianças de três anos residentes em área de alta prevalência de insegurança alimentar domiciliar. Cad Saude Publica. 2010;26(8):1642-50. DOI:10.1590/S0102-311X2010000800017
4. Blumberg SJ, Bialostosky K, Hamilton WL, Briefel RR. The effectiveness of a short form of the Household Food Security Scale. Am J Public Health. 1999;89(8):1231-4.
5. Fletcher RH, Fletcher SW. Epidemiologia clínica: elementos essenciais. 4.ed. Porto Alegre: ArtMed; 2006.
6. Harrison GG, Stormer A, Herman DR, Winham DM. Development of a Spanish-language version of the U.S. household food security survey module. J Nutr. 2003;133(4):1192-7.
7. Kendall A, Olson CM, Frongillo Jr EA. Validation of the Radimer/Cornell measures of hunger and food insecurity. J Nutr. 1995;125(11):2793-801.
8. Melgar-Quiñonez H, Zubieta AC, Valdez E, Whitelaw B, Kaiser L. Validación de un instrumento para vigilar la inseguridad alimentaria en la Sierra de Manantlán, Jalisco. Salud Publica Mex. 2005;47(6):413-22. DOI:10.1590/S0036-36342005000600005
9. Panigassi G, Segall-Corrêa AM, Marin-León L, Pérez-Escamilla R, Sampaio MFA, Maranha LK. Insegurança alimentar como indicador de
iniquidade: análise de inquérito populacional.
Cad Saude Publica. 2008;24(10):2376-84. DOI:10.1590/S0102-311X2008001000018
10. Pérez-Escamilla R, Segall-Corrêa AM, Kurdian-Maranha L, Sampaio MMF, Marín-León L, Panigassi G. An adapted version of the U.S. Department of Agriculture Food Insecurity module is a valid tool for assessing household food insecurity in Campinas, Brazil. J Nutr. 2004;134(8):1923-8.
11. Santos JV, Gigante DP, Domingues MR. Prevalência de insegurança alimentar em Pelotas, Rio Grande do Sul, Brasil, e estado nutricional de indivíduos que vivem nessa condição. Cad Saude Publica. 2010;26(1):41-9. DOI:10.1590/S0102-311X2010000100005
12. Santos LMP, Carneiro FF, Hoefel MGL, Santos W, Nogueira TQ. The precarious livelihood in waste dumps: a report on food insecurity and hunger among recyclable waste collectors. Rev Nutr. 2013;26(3):323-34. DOI:10.1590/S1415-52732013000300007
13. Santos LP, Costa MG, Santos JV, Lindemann IL, Gigante DP. Comparação entre duas escalas de segurança alimentar. Cienc Saude Coletiva. 2014;19(1):279-86. DOI:10.1590/1413-81232014191.2058
14. Segall-Corrêa AM. Insegurança alimentar medida a partir da percepção das pessoas. Estud Avan. 2007;21(60):143-54. DOI:10.1590/S0103-40142007000200012
15. Segall-Corrêa AM, Marin-Leon L. A segurança alimentar no Brasil: proposição e usos da Escala Brasileira de Medida da Insegurança Alimentar (EBIA) de 2003 a 2009. Segur Aliment Nutr. 2009;16(2):1-19.
16. Velásquez-Melendez G, Schlüssel MM, Brito AS, Silva AAM, Lopes-Filho JD, Kac G. Mild but not light or severe food insecurity is associated with obesity among Brazilian women. J Nutr. 2011;141(5):898-902. DOI:10.3945/jn.110.135046.