José Cazuza de Farias JúniorI Lisandra Maria KonradII Fabiana Maluf RabacowII Susane GrupII
Valbério Candido AraújoII
I Departamento de Educação Física. Centro de Ciências da Saúde. Universidade Federal da Paraíba. João Pessoa, PB, Brasil II Centro de Desportos. Universidade Federal
de Santa Catarina. Florianópolis, SC, Brasil
Correspondence:
José Cazuza de Farias Júnior Departamento de Educação Física Centro de Ciências da Saúde Universidade Federal da Paraíba Cidade Universitária
58059-900 João Pessoa, PB, Brasil E-mail: [email protected] Received: 5/21/2008 Approved: 8/28/2008
Sensitivity and specifi city of
criteria for classifying body
mass index in adolescents
ABSTRACT
OBJECTIVE: To estimate the prevalence of overweight among adolescents using different body mass index (BMI) classifi cation criteria, and to determine sensitivity and specifi city values for these criteria.
METHODS: Weight, height, and tricipital and subscapular skinfolds in 934 adolescents (462 males and 472 females) aged 14-18 years (mean age 16.2; SD=1.0) of the city of Florianópolis, Southern Brazil, in 2001. Percent fat estimated based on skinfold measurements (≥25% in males and ≥30% in females) was used as a gold-standard for determining specifi city and sensitivity of BMI classifi cation criteria among adolescents.
RESULTS: The different cutoff points used for classifying BMI in general resulted in similar prevalence of overweight (p>0.05). Sensitivity of the evaluated criteria was high for males (85.4% to 91.7%) and low for females (33.8 to 52.8%). Specifi city of all criteria was high for both sexes (83.6% to 98.8%).
CONCLUSIONS: Estimates of prevalence of obesity among adolescents using different BMI classifi cation criteria were similar and highly specifi c for both sexes, but sensitivity for females was low.
DESCRIPTORS: Adolescent. Body Mass Index. Sensitivity and
Specifi city. Overweight, diagnosis. Obesity, diagnosis. Nutritional Status.
INTRODUCTION
Screening for excess weight (overweight/obesity) among youths has been widely recommended,24 given the rapid increase in prevalence, its health-related
implications, and the possibility of transfer to adult age. This has underscored the need for a simple, safe, valid, and precise instrument for evaluating nutri-tional status.
The Body Mass Index (BMI) is recommended by the World Health Organization (WHO)24 as an indicator for evaluating the nutritional status of adolescents,
and has been widely employed in epidemiological studies.5,6 This is due to the
fact that BMI is based on easily obtained measures, has high precision, does not require sophisticated equipment or specialized personnel, and shows good ability to discriminate excess body fat in adolescents.13,14,19
Prevention (CDC – Kuczmarski et al11 2002), and Must
et al15 (1991), are the most widely used. More recently,
Conde & Monteiro3 (2006) proposed critical BMI
val-ues for Brazilian children and adolescents.
Unlike those for adults,24 cutoff points for adolescents
have been established in an arbitrary manner, not grounded on health considerations.17 Moreover, there
is limited information on the validity of such criteria, especially among populations different from those for which they were developed.17
Studies comparing prevalence of excess weight ac-cording to different BMI classifi cation criteria and evaluating the sensitivity and specifi city of these criteria in adolescents are scarce,16,19 especially in Brazil.21 The
aim of the present study was to investigate prevalence of overweight among adolescents using fi ve different BMI classifi cation criteria, and to determine sensitivity and specifi city values for these criteria.
METHODS
Sampling in this survey was carried out in two stages. In the fi rst, the 98 secondary schools (both public and pri-vate) in the municipality of Florianópolis, Southern Bra-zil, were listed in increasing order of number of students (small, up to 200 students; medium, 200 to 499 students; large, 500 or more students). Twenty-one schools were then systematically selected, of which 14 were public and seven private. In the second stage, after obtaining authorization from the schools’ managers, classes were randomly selected so as to compose the sample. As the present study was nested within a larger sur-vey, sample size was determined by assuming 60% prevalence of physical inactivity, with 95% confi dence intervals (95%CI), a four percentage point error, and an additional 30% to allow for potential losses and refus-als (population estimated at 22,067 based on data from 2001). These assumptions led to a sample size of 731 subjects. The fi nal sample included 1,062 adolescents of both sexes, aged 14-18 years, previously authorized by a parent or guardian to take part in the survey. Ado-lescents with limitations that prevented anthropometric measurement or who were pregnant were excluded from the sample. According to previous work,18 this sample
size would suffi ce for the present analysis. Of the 1,062 adolescents that participated in data collection, seven were excluded due to lack of information on sex and/or age, and 121 (52 males and 69 females) refused to un-dergo anthropometric measurement. The fi nal sample included 934 adolescents (462 males and 472 females) aged 14 to 18 years (mean age 16.2; sd = 1.0). Data collection was carried out between May and August 2001 by a team of four previously trained researchers. Weight and height measures were always obtained by the same researcher (intraclass correlation
coeffi cients (ICC): weight = 0.99; height = 0.98). Sub-scapular (SB) and tricipital (TR) skinfold (SF) thickness (ICC SB = 0.96; TR = 0.98) was measured exclusively by another researcher. Measurements were recorded by the other researchers.
Weight was measured using a Filizola electronic scale with 100 g precision, with the subject wearing light clothing and no shoes. Height was measured using a non-extensible tape measure with 1 cm precision, fi xed to the wall, on a plain support surface. Subjects were measured without shoes, arms held straight alongside the body, and in apnea. Both measures were taken in duplicate, according to the procedures described by Gordon et al9 (1988), the fi nal value being considered
as the mean of the two measurements.
SB and TR SF thickness was measured according to Harrison10 (1988), using a Cescorf-type caliper with
0.01 mm resolution. We performed three separate mea-surements in the same place, in an alternate manner. A further series of three measurements was performed in case the three previous measures diverged by more than 5%. The mean of the three measurements was used as the fi nal value for skinfold thickness.
BMI was determined based on the ratio between weight and height (BMI = weight [kg]/height [m2]).
The quantity of fat in relation to the body mass (%F) was estimated using equations specifi c for adolescents, proposed by Lohman12 (1986), based on the measures
of TR and SB SF thickness.
For data analysis, we used Student’s t test for unpaired measurements in order to compare the mean anthropo-metric measures of males and females. We determined prevalences of excess weight (grouped into the risk categories overweight and obesity), with their respective 95%CI, based on the critical BMI values derived from the fi ve criteria analyzed: Conde & Monteiro3 (2006);
IOTF2 (2000); CDC11 (2002); WHO24 (1995);and Must
et al15 (1991). Differences between these prevalences
were evaluated using the McNemar test.
We estimated the sensitivity and specifi city of each BMI classifi cation criterion using %F as a gold-standard. Excess weight was defi ned as body fat values greater than 25% in male, and 35% in female adolescents. These cutoff points have been used in other works assessing the validity BMI classifi cation criteria in adolescents,16,21 and are shown to be associated with
risk of disease.23
Statistical analyses were carried out using Stata 10.0 software and adopting a 5% signifi cance level. The study was approved by the Research Ethics Com-mittee of the Federal University of Santa Catarina (process no. 066/2000).
RESULTS
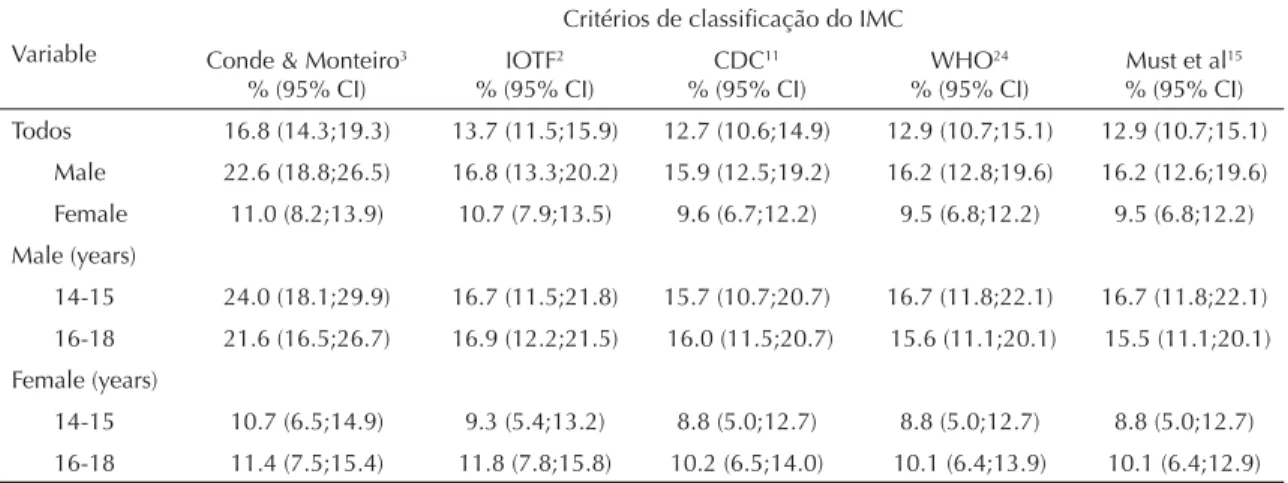
Mean SF thickness (SB and TR) and %F were statisti-cally higher among females (p<0.001), whereas mean BMI was higher among males (p=0.02) (Table 1). No signifi cant differences were found in terms of excess weight prevalence when using the different BMI clas-sifi cation criteria, with the exception of male subjects, for whom the critical BMI values proposed by Conde & Monteiro3 yielded prevalences 4% to 8% higher than
the remaining criteria (p<0.05) (Table 2).
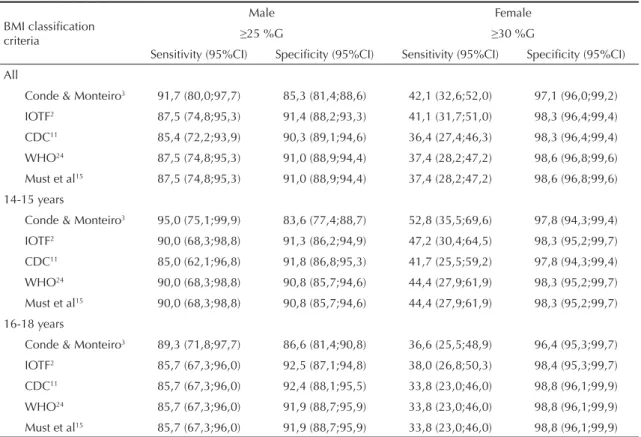
Table 3 presents values of sensitivity and specifi c-ity for the fi ve BMI classifi cation criteria. Assuming %F ≥ 25% for males and ≥ 30% for females as the gold-standard for excess weight, for all fi ve criteria,
specifi city was higher than sensitivity among both males and females.
Sensitivity was high for males (> 85%) and low for females (< 60%). The criteria proposed by Conde & Monteiro3 showed higher sensitivity when compared
to the remaining criteria. However, these differences were small (≈6%), especially when compared to those of IOTF,2 Must et al,15 and WHO,24 for males, and when
compared to IOTF2 for females.
All BMI criteria evaluated (Table 3) showed high
speci-fi city. Specifi city was higher for females (> 95%) than for males (> 80%). The critical values proposed by Conde & Monteiro3 showed slightly lower specifi city (≈7%)
for males than the remaining criteria. Among females, sensitivity was similar in for all criteria evaluated.
DISCUSSION
The use of the critical BMI values for defi ning excess weight among adolescents proposed by IOTF,2 CDC,11
WHO,24 and Must et al,15 resulted in similar prevalences
of excess weight. The critical values proposed by Conde
Table 1. Mean and standard deviation of anthropometric indicators among adolescents. Florianópolis, Southern Brazil, 2001.
Variable All (n= 934) Male (n= 472) Female (n= 462) p Mean (sd) Mean (dp) Mean (sd)
BMI (kg/m2) 21.1 (3.1) 21.3 (3.3) 20.9 (2.8) 0.021
Subscapular skinfold (mm) 10.8 (6.0) 9.2 (5.8) 12.3 (5.8) <0.001
Tricipital skinfold (mm) 12.9 (6.1) 9.2 (4.8) 16.4 (5.3) <0.001
%F (%) 20.1 (8.0) 15.2 (6.8) 24.8 (6.0) <0.001
BMI: Body mass index
%F: percent fat estimated based on skinfold thickness
Table 2. Prevalence of excess body weight according to body mass index classifi cation criteria among adolescents. Florianópolis, Southern Brazil, 2001.
Variable
Critérios de classifi cação do IMC
Conde & Monteiro3 % (95% CI)
IOTF2 % (95% CI)
CDC11 % (95% CI)
WHO24 % (95% CI)
Must et al15 % (95% CI)
Todos 16.8 (14.3;19.3) 13.7 (11.5;15.9) 12.7 (10.6;14.9) 12.9 (10.7;15.1) 12.9 (10.7;15.1)
Male 22.6 (18.8;26.5) 16.8 (13.3;20.2) 15.9 (12.5;19.2) 16.2 (12.8;19.6) 16.2 (12.6;19.6) Female 11.0 (8.2;13.9) 10.7 (7.9;13.5) 9.6 (6.7;12.2) 9.5 (6.8;12.2) 9.5 (6.8;12.2)
Male (years)
14-15 24.0 (18.1;29.9) 16.7 (11.5;21.8) 15.7 (10.7;20.7) 16.7 (11.8;22.1) 16.7 (11.8;22.1)
16-18 21.6 (16.5;26.7) 16.9 (12.2;21.5) 16.0 (11.5;20.7) 15.6 (11.1;20.1) 15.5 (11.1;20.1) Female (years)
14-15 10.7 (6.5;14.9) 9.3 (5.4;13.2) 8.8 (5.0;12.7) 8.8 (5.0;12.7) 8.8 (5.0;12.7)
16-18 11.4 (7.5;15.4) 11.8 (7.8;15.8) 10.2 (6.5;14.0) 10.1 (6.4;13.9) 10.1 (6.4;12.9) BMI: Body mass index
IOTF: International Obesity Task Force
& Monteiro3 yielded higher prevalences among males
than the remaining criteria. It is likely that the small differences in the cutoff points of IOFT,2 CDC,11 Must et
al,15 and WHO24 for adolescents aged 14 to 18 years, in
addition to the distribution of BMI values in the studied population, have led to the differences in prevalence of excess weight detected between these criteria. However, the higher prevalences found using the criteria proposed by Conde & Monteiro3 can be explained by the critical
BMI values adopted by these authors, which are lower than those of the other criteria.
Our results are similar to those reported in other surveys with adolescents,8,22 including a study carried out in
Bra-zil,1 which also failed to detect signifi cant differences in
prevalence of excess weight as defi ned by the criteria proposed by IOTF,2 WHO,24 and Must et al.15
Though not signifi cant, Vieira et al21 (2006) found
discrepancies (differences of up to 21.3%) between excess weight prevalences determined using different BMI classifi cation criteria (percentile 85 of Brazilian youths, IOTF,2 CDC,11 and Must et al15), among
Brazil-ian adolescents (12-19 years).
We were unable to locate any studies comparing preva-lence of excess weight determined based on the critical values recommended by Conde & Monteiro3 with the
other criteria evaluated in the present study. However, the use of BMI percentile 85 from the same population studied by Conde & Monteiro3 generated prevalences
of excess weight that were higher than those detected using other criteria.20,21
Differences in age group, sampling procedures, and distribution of BMI values in the population/sample may explain part of the divergence between different studies of prevalence of BMI in adolescents determined using different criteria.8
There is no consensus regarding the establishment of a universal criterion for classifying BMI in adolescents. This is due to the changes in body composition result-ing from the process of sexual maturation, which vary greatly according to age, sex, and ethnicity, and which are not captured precisely by the BMI.4,13
As described in other Brazilian1,20,21 and international8,16
studies, the BMI classifi cation criteria for adolescents evaluated here show higher specifi city than sensitivity.
Table 3. Sensitivity and specifi city of body mass index classifi cation criteria in comparison to percent fat estimated based on skinfold thickness. Florianópolis, Southern Brazil, 2001.
BMI classifi cation criteria
Male Female
≥25 %G ≥30 %G
Sensitivity (95%CI) Specifi city (95%CI) Sensitivity (95%CI) Specifi city (95%CI) All
Conde & Monteiro3 91,7 (80,0;97,7) 85,3 (81,4;88,6) 42,1 (32,6;52,0) 97,1 (96,0;99,2)
IOTF2 87,5 (74,8;95,3) 91,4 (88,2;93,3) 41,1 (31,7;51,0) 98,3 (96,4;99,4)
CDC11 85,4 (72,2;93,9) 90,3 (89,1;94,6) 36,4 (27,4;46,3) 98,3 (96,4;99,4) WHO24 87,5 (74,8;95,3) 91,0 (88,9;94,4) 37,4 (28,2;47,2) 98,6 (96,8;99,6)
Must et al15 87,5 (74,8;95,3) 91,0 (88,9;94,4) 37,4 (28,2;47,2) 98,6 (96,8;99,6)
14-15 years
Conde & Monteiro3 95,0 (75,1;99,9) 83,6 (77,4;88,7) 52,8 (35,5;69,6) 97,8 (94,3;99,4) IOTF2 90,0 (68,3;98,8) 91,3 (86,2;94,9) 47,2 (30,4;64,5) 98,3 (95,2;99,7)
CDC11 85,0 (62,1;96,8) 91,8 (86,8;95,3) 41,7 (25,5;59,2) 97,8 (94,3;99,4)
WHO24 90,0 (68,3;98,8) 90,8 (85,7;94,6) 44,4 (27,9;61,9) 98,3 (95,2;99,7)
Must et al15 90,0 (68,3;98,8) 90,8 (85,7;94,6) 44,4 (27,9;61,9) 98,3 (95,2;99,7) 16-18 years
Conde & Monteiro3 89,3 (71,8;97,7) 86,6 (81,4;90,8) 36,6 (25,5;48,9) 96,4 (95,3;99,7)
IOTF2 85,7 (67,3;96,0) 92,5 (87,1;94,8) 38,0 (26,8;50,3) 98,4 (95,3;99,7)
CDC11 85,7 (67,3;96,0) 92,4 (88,1;95,5) 33,8 (23,0;46,0) 98,8 (96,1;99,9) WHO24 85,7 (67,3;96,0) 91,9 (88,7;95,9) 33,8 (23,0;46,0) 98,8 (96,1;99,9)
Must et al15 85,7 (67,3;96,0) 91,9 (88,7;95,9) 33,8 (23,0;46,0) 98,8 (96,1;99,9)
%F: percent fat estimated based on skinfold thickness BMI: Body mass index
IOTF: International Obesity Task Force
The sensitivity of different the criteria evaluated in the present study was higher to that reported in some studies1,16,20 and similar to that reported in others.19,21
The use of these criteria for diagnosing excess weight as determined by excess body fat should accurately classify approximately 85-90% of males (10-15% false positives) and results in a large proportion of false-nega-tive results among females (50-70%).
The low sensitivity of BMI classifi cation criteria among females, especially those aged 16-18 years, may be a consequence of the use of a single value to defi ne excess body fat at all ages, which may lead to overestimation of the prevalence of excess body fat. On the other hand, the critical BMI values evaluated may be too high to diagnose excess body fat in this subgroup.16
The slightly higher sensitivity found for the critical values proposed by Conde & Monteiro3 resulted in differences
below 10% in the number of false-negatives when com-pared to the remaining criteria, especially IOTF,2 Must et
al,15 and WHO24 for males and IOTF2 for females.
Other studies using BMI percentile 85, specifi c for sex and age, of the same reference population used by Conde & Monteiro3 (Brazilian adolescents), also found
that critical values of BMI for the Brazilian population were more sensitive than those suggested by Must et al,15 IOTF,2 and CDC.11
Part of the variability in the sensitivity of BMI clas-sifi cation criteria for adolescents in the different stud-ies may be explained by differences in the methods employed for estimating %F; in the critical values used to defi ne excess body fat based on this indicator;17 and
on the age group of the study population; as well as by the infl uence of factors such as ethnicity, culture, and environment on indicators of body composition.17
As seen in previous work,1,8,16,20,21 the BMI classifi cation
criteria evaluated in the present study were highly spe-cifi c (between 83.6% and 98.8% specifi city), especially for females, with little variation between the different criteria. Although they result in lower specificity, the cutoff points suggested by Conde & Monteiro4
strengthen the results of previous studies that used BMI percentile 85 of the same reference population.20,21
Irrespective of the criteria used to classify BMI, we found that the number of false-positive results was always below 10%.
Given the good ability of BMI to discriminate excess body fat in adolescents,13,14,19 the major challenge
re-mains that of establishing cutoff points that will allow us to reduce the number of false-negatives, especially among females (increase sensitivity), while maintaining the high levels of specifi city already seen for the dif-ferent criteria, in addition to ensuring that these levels are associated to health hazard.7
Since our measurements were carried out independently by two researchers, and considering that both were blinded as to the hypotheses of the present study, we believe the possibility of observer bias may be dis-carded. Furthermore, reproducibility of anthropometric measurements was high (ICC >0.95).
Although the refusal rate for the different anthropo-metric measurements was relatively low (≈12%), we cannot discard the possibility of selection bias, given that we were unable to compare these characteristics between participants and non-participants.
Another limitation to be considered when interpreting the present results is the use of %F determined based on skinfold thickness measurements. This procedure is expected to underestimate the amount of fat in leaner adolescents while overestimating this amount in fatter ones.
We conclude that the BMI classifi cation criteria ana-lyzed in the present study provide similar estimates of prevalence of excess weight, with the exception of the criteria proposed by Conde & Monteiro,3 which result
in higher prevalence among males.
1. Chiara V, Sichieri R, Martins PD. Sensibilidade e especifi cidade de classifi cação de sobrepeso em adolescentes, Rio de Janeiro. Rev Saude Publica. 2003;37(2):226-31. DOI: 10.1590/S0034-89102003000200010
2. Cole TJ, Bellizzi MC, Flegal KM, Dietz WD.
Establishing a standard defi nition for child overweight and obesity worldwide: international survey. BMJ. 2000;320(7244):1240-3. DOI: 10.1136/ bmj.320.7244.1240
3. Conde WL, Monteiro CA. Body mass index cutoff points for evaluation of nutritional status in Brazilian children and adolescents. J Pediatr (Rio J). 2006;82(4):266-72. DOI: 10.2223/JPED.1502
4. Demerath EW, Schubert CM, Maynard LM, Sun SS, Chumlea WC, Pickoff A. Do changes in body mass index percentile refl ect changes in body composition in children? Data from the feels longitudinal study. Pediatrics. 2006;117(3):487-95. DOI: 10.1542/ peds.2005-0572
5. Dutra CL, Araújo CL, Bertoldi AD. Prevalência de sobrepeso em adolescentes: um estudo de base populacional em uma cidade no sul do Brasil. Cad Saude Publica. 2006;22(1):151-62. DOI: 10.1590/ S0102-311X2006000100016
6. Eaton DK, Kann L, Kinchen S, Ross J, Hawkins J, Harris WA. Youth Risk Behavior Surveillance - United States, 2005. MWR Surveill Summ. 2006;55(5):1-108
7. Engeland A, Bjorge T, Sogaard AJ, Tverdal A. Body mass index in adolescence in relation to total mortality: 32-year follow-up of 227,000 Norwegian boys and girls. Am J Epidemiol. 2003;157(6):517-23. DOI: 10.1093/aje/kwf219
8. Flegal KM, Ogden CL, Wei R, Kuczmarski RL, Johnson CL. Prevalence of overweight in US children: comparison of US growth charts from the Centers for Disease Control and Prevention with other reference values for body mass index. Am J Clin Nutr. 2001;73(6):1086-93.
9. Gordon CC, Chumlea WC, Roche AF. Stature, recumbent length, and weight. In: Lohman TG, Roche AF, Martorell R, editors. Anthropometric standardization reference manual. Champaign: Human Kinetics; 1988. p.3-8.
10. Harrison GG. Skinfold thickness and measurement technique. In: Lohman T, Roche AF, Martorell R, editors. Anthropometric standardization reference manual. Champaign: Human Kinetics; 1988. p.55-80.
11. Kuczmarski RJ, Ogden CL, Guo SS, Grummer-Strawn LM, Flegal KM, Mei Z, et al. 2000 CDC growth charts for the United States: methods and development. Vital Health Stat 11. 2002;(246):1-190.
12. Lohman TG. Applicability of body composition techniques and constants for children and youths. Exerc Sport Sci Rev. 1986;14:325-57. DOI: 10.1249/00003677-198600140-00014
13. Malina RM, Katzmarzyk PT. Validity of the body mass index as an indicator of the risk and presence of overweight in adolescents. Am J Clin Nutr. 1999;70(1):131S-6S.
14. Mei Z, Grummer-Strawn LM, Pietrobelli A, Goulding A, Goran MI, Dietz WH. Validity of body mass index compared with other body-composition screening indexes for the assessment of body fatness in children and adolescents. Am J Clin Nutr. 2002;75(6):978-85.
15. Must A, Dallal GE, Dietz WH. Reference data for obesity: 85th and 95th percentiles of body mass index (wt/ht2) and triceps skinfold thickness. Am J Clin Nutr. 1991;53(4):839-46.
16. Neovius MG, Linné YM, Barkeling BS, Rossner S. Sensitivity and specifi city of classifi cation systems for fatness in adolescents. Am J Clin Nutr. 2004;80(3):597-603.
17. Neovius M, Linné Y, Barkeling B, Rössner S. Discrepancies between classifi cation systems of childhood obesity. Obes Rev. 2004;5(2):105-14. DOI: 10.1111/j.1467-789X.2004.00136.x
18. Pereira MG, Andrade ALS. Métodos de investigação epidemiológica em doenças transmissíveis. Brasília: Organização Pan-Americana da Saúde; 2003. Avaliação de testes diagnósticos; p.22-40.
19. Taylor RW, Jones IE, Williams SM, Goulding A. Body fat percentages measured by dual-energy x-ray absorptiometry corresponding to recently recommended body mass index cutoffs for overweight and obesity in children and adolescents aged 3-18 y. Am J Clin Nutri. 2002;76(6):1416-21.
20. Veiga GV, Dias PC, Anjos LA. A comparison of distribution curves of body mass index from Brazil and the United States for assessing overweight and obesity in Brazilian adolescents. Rev Panam Salud Publica. 2001;10(2):79-85. DOI: 10.1590/S1020-49892001000800002
21. Vieira AC, Alvarez MM, Martins VMR, Sichieri R, Veiga GV. Desempenho de pontos de corte do índice de massa corporal de diferentes referências na predicação de gordura corporal em adolescentes. Cad Saude Publica. 2006;22(8):1681-90. DOI: 10.1590/S0102-311X2006000800016
22. Wang Y, Wang JQ. A comparison on international references for the assessment of child and adolescent overweight and obesity in different populations. Euro J Clin Nutr. 2002;56(10):973-82. DOI: 10.1038/ sj.ejcn.1601415
23. Williams DP, Going SB, Lohman TG, Harsha DW, Srinivasan SR, Webber LS, et al. Body Fatness and Risk for Elevated Blood Pressure, Total Cholesterol, and Serum lipoprotein Ratios in Children and Adolescents. Am J Public Health. 1992;82(3):358-63.
24. World Health Organization. Physical status: the use and interpretation of anthropometry. Geneva; 1995. (WHO Technical Report Series, 854).
REFERENCES